44 Wynn Way · Pendergrass, GA
Flood risk 1/10 · Minimal
- FEMA flood zone
- X (unshaded)
- Chance of flooding over 30 yrs
- 0.0%
- Est. flood insurance / yr
- $507 – $1,088
Fire risk 3/10 · Minor
- Est. fire insurance / yr
- $963 – $1,789
Heat risk 5/10 · Moderate
- Hot days now (above 105°F)
- 7 days/yr
- Hot days in 30 yrs
- 18 days/yr
Wind risk 4/10 · Minor
- Chance of severe wind over 30 yrs
- 13.0%
Air-quality risk 3/10 · Minor
- Unhealthy air days now
- 3 days/yr
- Unhealthy air days in 30 yrs
- 4 days/yr
Risk factors via First Street. Map © Google.
Why this score? — see what drove the D grade
The composite is a weighted blend of 9 inputs, each scored 0–100. Each bar is that input's sub-score; the figure is the points it added to the 100-point composite (weight × sub-score).
- ARV discount +11.7/15.0
- Appreciation +10.0/10.0
- Cash flow +7.3/30.0
- Livability +3.4/5.0
- Schools +3.3/10.0
- Rent growth +2.5/5.0
- Condition / age +2.5/5.0
- 1% rule +1.9/10.0
- DSCR +1.5/10.0
$330,000
🖨 Deal sheet (PDF) 📄 Offer letter ✓ Due diligence
Listing remarks
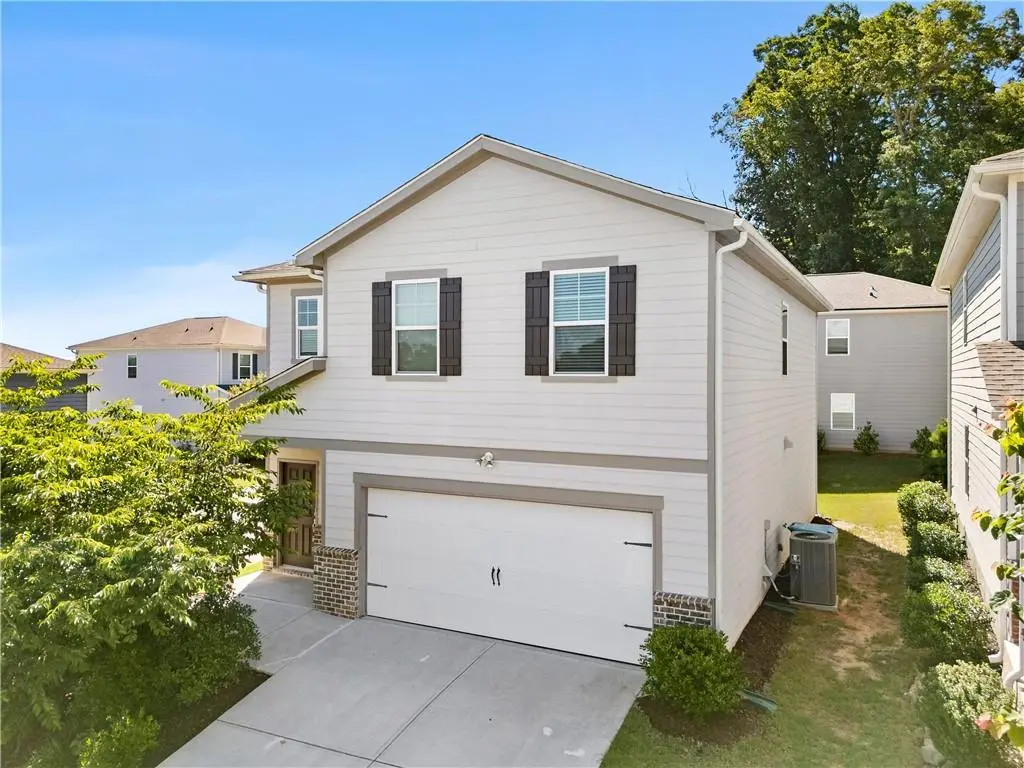
Welcome to this beautifully maintained home in the desirable Pendergrass Glen community! Built in 2021, this spacious two-story residence offers approximately 1,928 square feet of thoughtfully designed living space with 2.5 bathrooms, an open-concept layout, and modern finishes throughout. The bright and inviting main level features a seamless flow between the living, dining, and kitchen areas, creating the perfect setting for everyday living and entertaining. The kitchen overlooks the family room and offers ample cabinet and counter space for the home chef. Upstairs, you'll find generously sized bedrooms and flexible living space to accommodate a variety of lifestyle needs. Enjoy the conve
Key facts
- Low-maintenance lot
- Prime location
- Open-concept layout
Tags
Property features AI
Finance
- HOA & community: Homeowners association with an annual fee of $475
Exterior
- Parking: One-car garage with garage door opener (garage faces front); One carport space; Driveway parking; Two total parking spaces; Open parking available
- Utilities: Public water; Public sewer; 110V electrical service with 220V in garage; Cable available; Phone available; Underground utilities; Electricity available; Water available; Sewer available
- Home design: Two-story home; Fee simple ownership; Resale property
- Construction: Aluminum siding; Asbestos shingle roof
- Exterior features: Deck
Interior
- Kitchen: Breakfast bar; Eat-in kitchen; Kitchen island; Pantry with walk-in pantry; Dishwasher; Electric cooktop; Electric oven; Microwave; Refrigerator; Disposal
- Bedrooms: Four bedrooms on the upper level
- Flooring: Luxury vinyl
- Bathrooms: Two full bathrooms; One half bathroom (main level); Upper level full bathrooms include double vanity in master
- Heating & cooling: Central heating; Central air conditioning
- Interior features: Walk-in closets; Double pane windows; No shared/common walls
- Laundry & utility: Dedicated laundry room; Washer and dryer included; Electric water heater
Neighborhood map
What this means for you Summary
Snapshot
- This is a 4-bed/2.5-bath single-family listed at $330k.
Deal economics
- At list price, monthly cash flow is $-436 ($-5k/yr) — negative.
- To cash-flow at today's rent, offer at most $253k (23.3% below list).
- To meet the 1% rule (rent ≥ 1% of price), the offer needs to be $227k (31.2% below list).
- Recommended offer: $227k (31.2% below list) — sets the bar for 1% rule.
- Cap rate 4.7% vs local median 3.6% in Pendergrass — meaningfully above typical; check what's discounted (condition, days-on-market, listing class) to confirm the premium yield is real.
Location & tenants
- Location reads 67/100 on livability (#174 in GA) — a middle-class / working-renter tenant base. Strengths: cost of living A+, housing A+, crime A; Watch: amenities F, commute F.
- Jackson County (rural): math 38% / reading 37% proficiency, ranked #50 of 174 in GA (top 29%) — families likely to look elsewhere, expect single-tenant / working-renter base with shorter leases.
- Zoned schools: North Jackson Elementary School (math 36% / reading 30%, grade F, #567 of 1,228 statewide, top 47%, 687 students, 43% FRL); West Jackson Middle School (math 39% / reading 43%, grade F, #135 of 470 statewide, top 29%, 1,502 students, 28% FRL); Jackson County High School (math 20% / reading 17%, grade F, #254 of 424 statewide, top 61%, 1,833 students, 26% FRL).
- Market conditions: 143 active listings in the ZIP; 21 comparable units currently listed for rent nearby; rentals at typical pace (median 23d on market — plan ~3-4 weeks tenant-placement turnaround); 43% of comp listings sitting > 30 days — soft ceiling on asking rent; solid renter incomes; 2,167 units permitted in Jackson County in 2024 (59 in 5+ unit buildings).
Forward outlook
- In year one you build about $35k of equity ($2k loan paydown + $33k appreciation (10.0% local appreciation)).
- Jackson County population projected at +14% by 2050 — modest demand growth; plan on rents tracking national, not racing it.
- By year 2, paydown + projected appreciation supports a ~$57k cash-out refi (75% LTV) — recoverable capital for the next deal without selling this one.
Negotiation context
- Only 13 days on market — expect competitive offers; lowballing is unlikely to land.
Risks & watch-outs
- Climate carrying-cost: extreme-heat days projected 7→18/yr by 2055 (HVAC capex compounding) — expect insurance premiums to compound above CPI over the hold.
Questions for the listing agent
- What do current leases actually rent for vs. the listed asking? Can we see a recent rent roll and the last 12 months of T-12 income?
- What does the HOA fee cover, when was the last increase, and are there any pending special assessments or reserve-fund shortfalls?
- Is there a deadline driving the sale (1031 exchange, divorce, estate, relocation)? That informs how much negotiation room exists.
- Schools are F-rated, which usually means shorter tenancies and higher turnover. Who's the typical renter profile here, and what's been the actual vacancy rate?
- The area grade is low — what's the realistic commute time and amenity access for the typical tenant pool here? Any planned neighborhood developments (good or bad) we should know about?
- What's the average days-on-market for RENTAL listings here right now (not sales)? A rising rental-DOM trend means longer vacancies and softer asking-rent achievability than the comps imply.
- What's the recent tenant-quality profile in this submarket — average credit score on applications, eviction rate, late-payment / NSF rate, and stable-employment percentage? A property-management company in the area should have these aggregated.
- How much new for-sale + rental construction is in the pipeline within 1–3 miles? Heavy new supply typically softens prices + rents 12–24 months out; constrained supply supports both.
Investment metrics
- 1% rule
- 0.69% ✗
- Cap rate
- 4.71%
- Cash-on-cash
- -5.66%
- DSCR
- 0.75
- GRM
- 12.1
CMA / ARV
- ARV (on-the-fly)
- $364,392
- Comps found
- 12
Show comp detail 12 sales within ~0.75 mi
| Address | Dist | Beds/Ba | Sqft | Sold | Price | $/sf | Match |
|---|---|---|---|---|---|---|---|
| 108 Seed Ln | 0.09mi | 4/2.5 | 1,928 (0%) | 2mo | $325,000 | $169 | 94 |
| 24 Seed Ln | 0.01mi | 4/2.5 | 1,822 (-6%) | 10mo | $315,000 | $173 | 82 |
| 186 Wynn Way | 0.10mi | 5/2.5 (+1) | 2,182 (+13%) | 4mo | $336,675 | $154 | 65 |
| 195 Cedar Dr | 0.74mi | 4/2.0 | 1,922 (-0%) | 3mo | $384,900 | $200 | 60 |
| 237 Academy St | 0.13mi | 3/2.0 (-1) | 1,638 (-15%) | 4mo | $400,000 | $244 | 58 |
| 128 Embry Blvd | 0.48mi | 4/2.5 | 2,115 (+10%) | 9mo | $359,900 | $170 | 54 |
| 272 Blackberry Ln | 0.35mi | 4/2.0 | 2,205 (+14%) | 9mo | $387,000 | $176 | 50 |
| 235 Mountain Creek Dr | 0.48mi | 4/3.0 | 2,198 (+14%) | 5mo | $415,000 | $189 | 48 |
| 284 Sope Crk | 0.65mi | 3/2.5 (-1) | 2,001 (+4%) | 12mo | $386,890 | $193 | 48 |
| 159 Sope Creek Cir | 0.69mi | 3/2.0 (-1) | 1,838 (-5%) | 12mo | $377,990 | $206 | 43 |
| 708 Starbuck Pkwy | 0.73mi | 4/2.5 | 2,115 (+10%) | 10mo | $335,000 | $158 | 42 |
| 575 Cottage Loop | 0.67mi | 3/2.0 (-1) | 1,657 (-14%) | 4mo | $364,000 | $220 | 34 |
Match score weights: distance 35% · size 25% · config 20% · recency 20%. Top-matched comps best support the ARV.
Projected returns pro-forma
10.0% appreciation · 3.0% rent growth · sell at horizon
- IRR
- 20.3%
- Equity multiple
- 2.64×
- Total profit
- $151,980
- Equity at exit
- $297,290
- IRR
- 18.5%
- Equity multiple
- 6.08×
- Total profit
- $469,383
- Equity at exit
- $641,117
Cash invested: $92,400 (down + closing). Projections, not guarantees.
Landlord ↔ Tenant lean methodology
- Overall (STATE)
- 90 Strongly Landlord-Friendly
- State Georgia
- 90 Strongly Landlord-Friendly · R+3
- County
- — inherits STATE
- City
- — inherits STATE
ZIP-level market 30567
- Home prices YoY
- 14.7%
- Active inventory
- 143
- Price-to-rent
- 12.1×
Monthly cashflow live
- Estimated rent
- $2,270 high interval (Pro) →
- Mortgage (P&I)
- −$1,731
- Tax from tax record
- −$321 /mo · $3,853/yr
- Insurance
- −$138
- HOA
- −$40
- Vacancy / Maint / Mgmt
- −$477
- Net cashflow
- $-436
Break-even live
Sensitivity live
| Price | -10% $-249 | -5% $-342 | +0% $-436 | +5% $-529 | +10% $-622 |
|---|---|---|---|---|---|
| Rent | -10% $-615 | -5% $-525 | +0% $-436 | +5% $-346 | +10% $-256 |
| Rate | -1.0pp $-270 | -0.5pp $-352 | base $-436 | +0.5pp $-521 | +1.0pp $-608 |
UW: 25.0% down · 7.5% · 30yr · 1.5% tax · 5.0% vac · 8.0% maint · 8.0% mgmt
Financing live
Cash to close
- Down payment
- $82,500
- Closing costs
- $9,900
- Reserves months
- —
- Total cash needed
- —
Loan-product check · same deal, 3 products live
Conventional
25% down · 7.5% · 30yr
- Down + closing
- —
- Monthly P&I
- —
- Monthly cashflow
- —
- DSCR
- —
- Eligible?
- —
Personal DTI + credit; lowest rate.
DSCR
20% down · 8.5% · 30yr
- Down + closing
- —
- Monthly P&I
- —
- Monthly cashflow
- —
- DSCR
- —
- Eligible?
- —
No personal income docs; deal must DSCR.
Hard money
10% down · 12.0% · 12mo
- Down + closing
- —
- Monthly P&I
- —
- Monthly cashflow
- —
- DSCR
- —
- Eligible?
- —
Short-term bridge; refi at stabilization.
Rent comps 21 comps
| Address | Beds | Baths | Sqft | Rent | $/sqft | DOM | Units | Dist |
|---|---|---|---|---|---|---|---|---|
| 107 Wynn Way Pendergrass, GA | 4.0 | 2.5 | 1928 | $2,300 | $1.19 | 23d | 1 | 0.05mi |
| 25 Blue River Ct Pendergrass, GA | 4.0 | 2.5 | 1928 | $1,899 | $0.98 | 45d | 1 | 0.05mi |
| 15 Constitution Ave Pendergrass, GA | 3.0 | 3.5 | 2265 | $2,250 | $0.99 | 23d | 1 | 0.17mi |
| 149 Star Ct Pendergrass, GA | 3.0 | 2.5 | 1455 | $1,900 | $1.31 | 23d | 1 | 0.18mi |
| 228 Banner Rd Pendergrass, GA | 3.0 | 2.5 | 1455 | $1,900 | $1.31 | 23d | 1 | 0.21mi |
| 59 Constitution Ave Pendergrass, GA | 3.0 | 3.5 | 2265 | $2,200 | $0.97 | 23d | 1 | 0.21mi |
| 100 Mission Blvd Pendergrass, GA | 3.0 | 2.5 | 1831 | $1,950 | $1.06 | 15d | 1 | 0.26mi |
| 653 Glenn Gee Rd Pendergrass, GA | 3.0 | 2.5 | 2529 | $2,350 | $0.93 | 23d | 1 | 0.57mi |
| 250 Sope Creek Cir Pendergrass, GA | 4.0 | 3.0 | 2479 | $2,200 | $0.89 | 45d | 1 | 0.67mi |
| 274 Walnut Grove Way Pendergrass, GA | 5.0 | 3.0 | 2449 | $2,300 | $0.94 | 45d | 1 | 0.71mi |
| 306 Walnut Grove Way Pendergrass, GA | 5.0 | 3.0 | 2449 | $2,400 | $0.98 | 45d | 1 | 0.73mi |
| 63 Steel Trl Pendergrass, GA | 4.0 | 2.5 | 2156 | $2,160 | $1.00 | 45d | 1 | 0.78mi |
| 916 Independence Ave Pendergrass, GA | 4.0 | 2.5 | 1904 | $1,995 | $1.05 | 15d | 1 | 1.04mi |
| 929 Independence Ave Pendergrass, GA | 4.0 | 2.5 | 2000 | $1,901 | $0.95 | 15d | 1 | 1.07mi |
| 732 Independence Ave Pendergrass, GA | 4.0 | 2.5 | 1829 | $1,910 | $1.04 | 15d | 1 | 1.16mi |
| 960 Walnut Creek Cir Pendergrass, GA | 4.0 | 2.5 | 2000 | $1,850 | $0.93 | 45d | 1 | 1.17mi |
| 960 Walnut Creek Cir Pendergrass, GA | 4.0 | 2.5 | 2000 | $1,850 | $0.93 | 23d | 1 | 1.17mi |
| 731 Independence Ave Pendergrass, GA | 3.0 | 2.0 | 1615 | $1,799 | $1.11 | 45d | 1 | 1.18mi |
| 706 Independence Ave Pendergrass, GA | 4.0 | 2.5 | 1829 | $1,900 | $1.04 | 45d | 1 | 1.20mi |
| 542 Glenn Gee Rd Pendergrass, GA | 1.0–3.0 | 1.0–2.0 | 1149 | $2,813 | $2.45 | 14d | 1 | 1.34mi |
| 11 Darling Ln Pendergrass, GA | 4.0 | 2.5 | 1837 | $1,900 | $1.03 | 45d | 1 | 1.40mi |
HOA detail
- Monthly dues
- $40 · $480/yr
Listing history 11 events
-
2026-06-22days on market $330,000 Active 13 DOM
-
2026-06-19days on market $330,000 Active 11 DOM
-
2026-06-18days on market $330,000 Active 10 DOM
-
2026-06-17days on market $330,000 Active 9 DOM
-
2026-06-16days on market $330,000 Active 8 DOM
-
2026-06-15days on market $330,000 Active 7 DOM
-
2026-06-14days on market $330,000 Active 5 DOM
-
2026-06-13days on market $330,000 Active 4 DOM
-
2026-06-10days on market $330,000 Active 2 DOM
-
2026-06-09remarks 699-char remark
-
2026-06-09$330,000 Active 1 DOM
ⓘ Source: listings_history table (triggers on properties + properties_extension) + one-shot
backfill from property_details.listing_events for pre-trigger history.
Tax reassessment forecast GA · Resets to sale price
- Current annual tax
- $3,853 · $321/mo
- Projected year-2 tax
- $3,853 · $321/mo
- Expected delta
- $0/yr ($0/mo · 0.0%)
ⓘ Screening estimate from a state-policy table — verify with the county assessor before closing.
Climate risk First Street
- Flood 1/10 Low FEMA zone X (unshaded) · 0% chance over 30 yrs
- Wildfire 3/10 Moderate
- Heat 5/10 Major 7 d/yr ≥105°F today · 18 d/yr by 30 yrs out
- Wind 4/10 Moderate 13% chance of damaging wind over 30 yrs
- Air quality 3/10 Moderate 3 unhealthy d/yr today · 4 by 30 yrs out
Nearby sold comps map
Loading sold comps map…
Walkable amenities ~0.75 mi
Loading nearby amenities…
Taxation est. · year 1
- Rental income
- $27,243
- − Mortgage interest
- −$18,485
- − Property taxes
- −$3,853
- − Insurance
- −$1,650
- − Repairs & maintenance
- −$2,179
- − Management
- −$2,179
- − HOA
- −$480
- − Depreciation
- −$9,600
- Taxable loss
- −$11,185
- Est. tax savings @ 24.0%
- +$2,684
- After-tax cash flow
- $-2,544/yr
For passive investors: Depreciation is non-cash, so a rental often shows a tax loss while cash-flowing — sheltering income. Rental losses are passive: they offset passive income freely, and up to $25,000/yr can offset ordinary (W-2) income if you actively participate and your MAGI is under $100k (phasing out to $0 by $150k); unused losses carry forward. On sale, claimed depreciation is recaptured at up to 25%, and gains may owe capital-gains tax (a 1031 exchange can defer both). Figures are a year-1 estimate at your 24.0% rate — not tax advice; consult a CPA.
Schools (NCES district)
- District
- Jackson County
- NCES district ID
- 1302940
- Math proficiency
- 38% ▼ -14.00%
- Reading proficiency
- 37% ▼ -10.00%
- Median HH income
- $56,773
- Composite
- 33.08/100
- National rank
- #5566
- State rank
- #50 of 174 in GA
Livability — Pendergrass
- Score
- 67/100
- State rank
- #174
- US rank
- #10962
Category grades
Schools grade is shown separately in the Schools card above.
Census & demographics
- Census place
- Pendergrass, GA
- County
- Jackson County · 50,436 people
- City population
- 5,487
- Metro
- Jefferson, GA
- Population (ZIP)
- 5,487
- Household income
- $97,181
- Rent vs Own
- Severe rent burden
- 115.0
Population outlook (Jackson County) Hauer SSP2
- Today (2025)
- 68,403 people
- By 2030
- 70,771 · +3.5%
- By 2040
- 75,050 · +9.7%
- By 2050
- 78,022 · +14.1%
- By 2075
- 82,646 · +20.8%
- By 2100
- 80,701 · +18.0%
Race, ethnicity, and origin ACS 2023
- Neighborhood character
- Diverse neighborhood (Simpson 0.56)
- Race & ethnicity
- White 63% Hispanic / Latino 20% Two or more races 8% Black 7% Asian 4%
- Hispanic origin (detail)
- Mexican 13%
- Common ancestry
- Slovak 1% Serbian 1% Lithuanian 1%
- Foreign-born
- 15% · Canada, Vietnam
- Languages at home
- 81% English-only · Spanish 14% Other Asian/Pacific 1% Vietnamese 1%
Political lean MEDSL · Jackson
- 2024 margin
- Solid R (+55.1) · D 22.2% · R 77.2%
- 2008→2024 swing
- +0.8pp no change · 2008: -55.9pp · 2024: -55.1pp
- All cycles
- 2024: R+55.1 2020: R+58.0 2016: R+63.9 2012: R+62.9 2008: R+55.9
Not yet ingested
- Civics
- —
Market trends
- HPI YoY
- ▲ 46.83%
- Current HPI
- 364.4902
- Rent YoY
- —
- Metro
- Jefferson, GA
- State GDP YoY
- ▲ 2.66%
- F500 in state
- 28
Industry mix (Fortune 500 HQ in GA)
| Industry | F500 HQs | Revenue |
|---|---|---|
| Paper / Packaging | 2 | $29B |
|
||
| Retail | 1 | $160B |
|
||
| Transportation / Logistics | 1 | $91B |
|
||
| Airlines | 1 | $62B |
|
||
| Consumer Goods | 1 | $47B |
|
||
| Utilities | 1 | $25B |
|
||
Price history
+0.0% since first listed2 events — show timeline
- 2026-06-05 Listed $330,000 FMLS
- 2023-09-26 Sold (Public Records) $330,000 Public Records
Property tax history
+60.3%/yrLatest (2025): $3,853 · -0.9% YoY. Source: county tax records.
Cash-flow waterfall
monthlySold comps — $/sqft
last 12 mo · ≤1 miLoading sold comps…