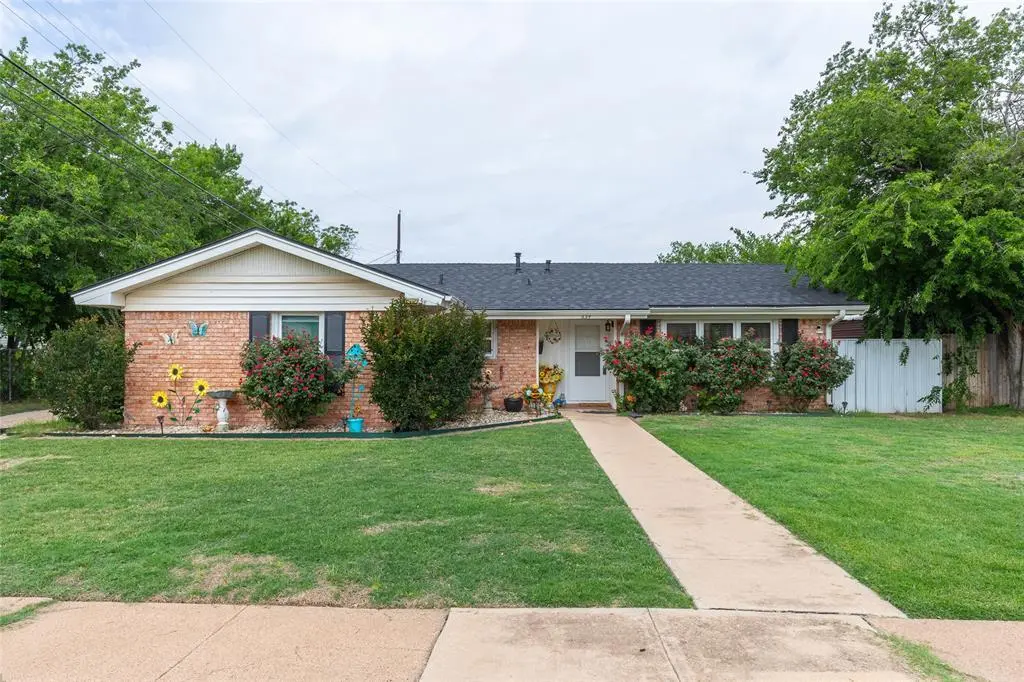
634 Lillius St · Abilene, TX
Flood risk 1/10 · Minimal
- FEMA flood zone
- X (shaded)
- Chance of flooding over 30 yrs
- 0.0%
- Est. flood insurance / yr
- $507 – $1,088
Fire risk 1/10 · Minimal
- Est. fire insurance / yr
- $1,222 – $2,270
Heat risk 7/10 · Major
- Hot days now (above 104°F)
- 7 days/yr
- Hot days in 30 yrs
- 23 days/yr
Wind risk 4/10 · Minor
- Chance of severe wind over 30 yrs
- 11.0%
Air-quality risk 1/10 · Minimal
- Unhealthy air days now
- 0 days/yr
- Unhealthy air days in 30 yrs
- 0 days/yr
Risk factors via First Street. Map © Google.
Why this score? — see what drove the C- grade
The composite is a weighted blend of 9 inputs, each scored 0–100. Each bar is that input's sub-score; the figure is the points it added to the 100-point composite (weight × sub-score).
- Cash flow +18.4/30.0
- ARV discount +7.5/15.0
- DSCR +5.8/10.0
- Rent growth +5.0/5.0
- 1% rule +4.8/10.0
- Livability +3.8/5.0
- Schools +2.8/10.0
- Condition / age +2.5/5.0
- Appreciation +0.0/10.0
$255,000
🖨 Deal sheet (PDF) 📄 Offer letter ✓ Due diligence
Listing remarks
Fresh updates, tons of space, and a location that makes everyday life easy! This recently updated and remodeled 3 bedroom, 2 bathroom home sits in a well-established neighborhood and offers two living areas, an attached 2-car carport, and storage galore. Plus a shop! The kitchen is a standout with all new cabinetry, granite countertops, a gas cooktop, high-end appliances, and a clean, modern feel that’s hard to find in this price range. Both bathrooms have also been beautifully updated, giving the home a fresh, cohesive feel throughout. Fresh paint, updated electrical, all new windows, new gutters, no carpet and LVP flooring and a new roof installed last year mean the hard work ha
Key facts
- 7,492 sq ft lot
- 2 parking spots
- Built 1959
Property features AI
Finance
- Other: Property type: Residential - Single family residence; Possession at closing/funding; Exclusions: all patio furniture and decor
- Financial info: Listing terms include Cash, Conventional, FHA; No second mortgage indicated
- HOA & community: No association
Exterior
- Parking: Attached carport; Carport with 2 covered spaces; Driveway parking; Alley access to parking; Storage at parking area
- Security: No accessibility-specific features listed
- Utilities: City water; City sewer; Electricity connected; Individual gas meter; Individual water meter; Curbs
- Home design: Single family residence; Attached (property attached: yes); Built in 1959; Composition roof; Slab foundation; Subdivision: Henry Sayles Of Harris
- Construction: Brick and siding construction; Composition roof; Slab foundation; Year built: 1959
- Exterior features: Covered front and rear porches; Covered porch(es); Gutters; Storage; Workshop with electricity; Other outdoor structure(s) noted; Landscaped yard; Large backyard with grass; Sprinkler system; Metal fencing; Alley access
Interior
- Kitchen: Dishwasher; Disposal; Electric oven; Gas cooktop; Microwave; Granite counters
- Bedrooms: Primary bedroom on main level with walk-in closet; Two additional bedrooms on main level
- Flooring: Luxury vinyl plank
- Bathrooms: 2 full bathrooms
- Heating & cooling: Central heating; Central air; Electric cooling
- Interior features: Decorative lighting; Granite counters; High-speed internet available; Walk-in closets; Two living areas; One dining area; Total rooms: 5; One level (single story)
- Laundry & utility: Utility room; Full-size washer/dryer area; Gas water heater
Neighborhood map
What this means for you Summary
Snapshot
- This is a 3-bed/2.0-bath single-family listed at $255k.
Deal economics
- At list price, monthly cash flow is $238 ($3k/yr) — positive.
- The deal already cash-flows at list — no discount required.
- To meet the 1% rule (rent ≥ 1% of price), the offer needs to be $249k (2.3% below list).
- Recommended offer: $249k (2.3% below list) — sets the bar for 1% rule.
Location & tenants
- Location reads 75/100 on livability (#142 in TX, #4,037 nationally) — a middle-class / working-renter tenant base. Strengths: cost of living A+, housing A+, health & safety A+; Watch: schools D+, crime D, commute F.
- Abilene ISD (urban): math 32% / reading 34% proficiency, ranked #575 of 826 in TX (top 70%) — families likely to look elsewhere, expect single-tenant / working-renter base with shorter leases.
- Market conditions: Rents rising fast (+40.2%/yr); 87 active listings in the ZIP; 10 comparable units currently listed for rent nearby; rentals at typical pace (median 23d on market — plan ~3-4 weeks tenant-placement turnaround); 508 units permitted in Taylor County in 2024 (0 in 5+ unit buildings).
- At $2,493/mo this rent would consume 56% of the median local household income ($54k/yr) (locally 662% of renters already pay >50% of income on rent) — very limited rent-growth headroom before tenants either downsize or default.
Forward outlook
- Local home prices are declining (-3.0%/yr); year-one equity from $2k of loan paydown is wiped out by about $8k of value loss. Plan a longer hold.
- Taylor County population projected at +16% by 2050 — long-run rental-demand tailwind backs the buy-and-hold thesis.
- At projected returns (-3.0% appreciation + 8.0% rent growth), your $71k cash investment doubles in ~10 years — after that, you're playing with house money.
Negotiation context
- Only 8 days on market — expect competitive offers; lowballing is unlikely to land.
Risks & watch-outs
- Watch-outs: built in 1959 — expect roof / HVAC / electrical / plumbing capex.
- Climate carrying-cost: extreme-heat days projected 7→23/yr by 2055 (HVAC capex compounding) — expect insurance premiums to compound above CPI over the hold.
Questions for the listing agent
- Built in 1959 — when were the roof, HVAC, electrical panel, plumbing, and water heater last replaced?
- Is there a deadline driving the sale (1031 exchange, divorce, estate, relocation)? That informs how much negotiation room exists.
- Schools are D-rated, which usually means shorter tenancies and higher turnover. Who's the typical renter profile here, and what's been the actual vacancy rate?
- Crime grade is D in this area — have there been break-ins, vandalism, or insurance claims at this property in the last 3 years? What carrier currently insures it and at what premium?
- What's the average days-on-market for RENTAL listings here right now (not sales)? A rising rental-DOM trend means longer vacancies and softer asking-rent achievability than the comps imply.
- What's the recent tenant-quality profile in this submarket — average credit score on applications, eviction rate, late-payment / NSF rate, and stable-employment percentage? A property-management company in the area should have these aggregated.
- How much new for-sale + rental construction is in the pipeline within 1–3 miles? Heavy new supply typically softens prices + rents 12–24 months out; constrained supply supports both.
Investment metrics
- 1% rule
- 0.98% ✗
- Cap rate
- 7.41%
- Cash-on-cash
- 4.00%
- DSCR
- 1.18
- GRM
- 8.5
CMA / ARV
- ARV (median comp)
- $124,657
- List price
- $255,000
- Delta
- 104.56%
- Verdict
- OVERPRICED
- Comps
- 20 within 1.0 mi
Show comp detail 12 sales within ~0.75 mi
| Address | Dist | Beds/Ba | Sqft | Sold | Price | $/sf | Match |
|---|---|---|---|---|---|---|---|
| 634 Lillius St | 0.00mi | 3/2.0 | 1,675 (0%) | 0mo | $255,000 | $152 | 100 |
| 502 Kirkwood St | 0.18mi | 3/2.5 | 1,758 (+5%) | 1mo | $199,900 | $114 | 81 |
| 1730 N 3rd St | 0.31mi | 3/1.0 | 1,648 (-2%) | 2mo | $209,000 | $127 | 77 |
| 1209 Kirkwood St | 0.54mi | 3/2.0 | 1,674 (-0%) | 3mo | $195,000 | $116 | 72 |
| 1833 N 7th St | 0.18mi | 3/2.0 | 1,516 (-10%) | 6mo | $80,000 | $53 | 71 |
| 449 Clinton St | 0.20mi | 2/1.0 (-1) | 1,577 (-6%) | 4mo | $184,000 | $117 | 68 |
| 642 Victoria St | 0.05mi | 4/2.5 (+1) | 1,910 (+14%) | 3mo | $199,900 | $105 | 65 |
| 210 Meander St | 0.55mi | 4/2.0 (+1) | 1,638 (-2%) | 2mo | $110,000 | $67 | 64 |
| 518 Meander St | 0.74mi | 3/2.0 | 1,632 (-3%) | 5mo | $212,000 | $130 | 57 |
| 2134 S 2nd St | 0.49mi | 3/2.0 | 1,424 (-15%) | 1mo | $145,000 | $102 | 52 |
| 934 Burger St | 0.63mi | 4/1.5 (+1) | 1,544 (-8%) | 3mo | $137,900 | $89 | 48 |
| 226 Palm St | 0.69mi | 2/2.0 (-1) | 1,512 (-10%) | 3mo | $69,900 | $46 | 44 |
Match score weights: distance 35% · size 25% · config 20% · recency 20%. Top-matched comps best support the ARV.
Projected returns pro-forma
-3.0% appreciation · 8.0% rent growth · sell at horizon
- IRR
- -4.6%
- Equity multiple
- 0.82×
- Total profit
- $-12,957
- Equity at exit
- $38,021
- IRR
- 10.1%
- Equity multiple
- 1.96×
- Total profit
- $68,283
- Equity at exit
- $22,048
Cash invested: $71,400 (down + closing). Projections, not guarantees.
Landlord ↔ Tenant lean methodology
- Overall (STATE)
- 87 Strongly Landlord-Friendly
- State Texas
- 87 Strongly Landlord-Friendly · R+5
- County
- — inherits STATE
- City
- — inherits STATE
ZIP-level market 79603
- Home prices YoY
- -32.5%
- Rents YoY
- 40.2%
- Active inventory
- 87
- Price-to-rent
- 8.5×
Monthly cashflow live
- Estimated rent
- $2,493 high interval (Pro) →
- Mortgage (P&I)
- −$1,337
- Tax from tax record
- −$287 /mo · $3,448/yr
- Insurance
- −$106
- HOA
- −$0
- Vacancy / Maint / Mgmt
- −$523
- Net cashflow
- $238
Break-even live
Sensitivity live
| Price | -10% $383 | -5% $310 | +0% $238 | +5% $166 | +10% $94 |
|---|---|---|---|---|---|
| Rent | -10% $41 | -5% $140 | +0% $238 | +5% $337 | +10% $435 |
| Rate | -1.0pp $367 | -0.5pp $303 | base $238 | +0.5pp $172 | +1.0pp $105 |
UW: 25.0% down · 7.5% · 30yr · 1.5% tax · 5.0% vac · 8.0% maint · 8.0% mgmt
Financing live
Cash to close
- Down payment
- $63,750
- Closing costs
- $7,650
- Reserves months
- —
- Total cash needed
- —
Loan-product check · same deal, 3 products live
Conventional
25% down · 7.5% · 30yr
- Down + closing
- —
- Monthly P&I
- —
- Monthly cashflow
- —
- DSCR
- —
- Eligible?
- —
Personal DTI + credit; lowest rate.
DSCR
20% down · 8.5% · 30yr
- Down + closing
- —
- Monthly P&I
- —
- Monthly cashflow
- —
- DSCR
- —
- Eligible?
- —
No personal income docs; deal must DSCR.
Hard money
10% down · 12.0% · 12mo
- Down + closing
- —
- Monthly P&I
- —
- Monthly cashflow
- —
- DSCR
- —
- Eligible?
- —
Short-term bridge; refi at stabilization.
Rent comps 10 comps
| Address | Beds | Baths | Sqft | Rent | $/sqft | DOM | Units | Dist |
|---|---|---|---|---|---|---|---|---|
| 1209 Kirkwood St Abilene, TX | 3.0 | 2.0 | 1674 | $2,500 | $1.49 | 22d | 1 | 0.52mi |
| 1481 Burger St Abilene, TX | 3.0 | 2.0 | 1330 | $2,400 | $1.80 | 22d | 1 | 0.90mi |
| 1638 Merchant St Abilene, TX | 3.0 | 2.0 | 1328 | $2,895 | $2.18 | 15d | 1 | 0.92mi |
| 2850 S 5th St Abilene, TX | 4.0 | 2.0 | 1175 | $1,995 | $1.70 | 15d | 1 | 0.93mi |
| 725 Peach St Abilene, TX | 3.0 | 2.0 | 1618 | $3,500 | $2.16 | 22d | 1 | 1.00mi |
| 889 Ross Ave Abilene, TX | 2.0 | 1.0 | 1223 | $1,700 | $1.39 | 22d | 1 | 1.17mi |
| 702 N 13th St Abilene, TX | 3.0 | 2.0 | 1334 | $2,200 | $1.65 | 15d | 1 | 1.22mi |
| 1426 Plum St Abilene, TX | 3.0 | 2.0 | 1090 | $2,014 | $1.85 | 15d | 1 | 1.28mi |
| 1470 Beechwood Ln Abilene, TX | 3.0 | 2.0 | 1799 | $4,500 | $2.50 | 45d | 1 | 1.35mi |
| 1685 N Willis St Abilene, TX | 3.0 | 2.0 | 1349 | $1,800 | $1.33 | 22d | 1 | 1.36mi |
Listing history 6 events
-
2026-05-15status Pending 1151-char remark
-
2026-05-10historical Active Option Contract 1151-char remark
-
2026-05-07$255,000 Active 1151-char remark
-
2006-01-20soldstatus
-
2005-11-16soldstatus
-
2000-04-20soldstatus
ⓘ Source: listings_history table (triggers on properties + properties_extension) + one-shot
backfill from property_details.listing_events for pre-trigger history.
Tax reassessment forecast TX · Resets to sale price
- Current annual tax
- $3,448 · $287/mo
- Projected year-2 tax
- $4,666 · $389/mo
- Expected delta
- +$1,218/yr (+$102/mo · 35.3%)
ⓘ Screening estimate from a state-policy table — verify with the county assessor before closing.
Climate risk First Street
- Flood 1/10 Low FEMA zone X (shaded) · 0% chance over 30 yrs
- Wildfire 1/10 Low
- Heat 7/10 Severe 7 d/yr ≥104°F today · 23 d/yr by 30 yrs out
- Wind 4/10 Moderate 11% chance of damaging wind over 30 yrs
- Air quality 1/10 Low 0 unhealthy d/yr today · 0 by 30 yrs out
Nearby sold comps map
Loading sold comps map…
Walkable amenities ~0.75 mi
Loading nearby amenities…
Taxation est. · year 1
- Rental income
- $29,910
- − Mortgage interest
- −$14,284
- − Property taxes
- −$3,448
- − Insurance
- −$1,275
- − Repairs & maintenance
- −$2,393
- − Management
- −$2,393
- − Depreciation
- −$7,418
- Taxable loss
- −$1,301
- Est. tax savings @ 24.0%
- +$312
- After-tax cash flow
- $3,171/yr
For passive investors: Depreciation is non-cash, so a rental often shows a tax loss while cash-flowing — sheltering income. Rental losses are passive: they offset passive income freely, and up to $25,000/yr can offset ordinary (W-2) income if you actively participate and your MAGI is under $100k (phasing out to $0 by $150k); unused losses carry forward. On sale, claimed depreciation is recaptured at up to 25%, and gains may owe capital-gains tax (a 1031 exchange can defer both). Figures are a year-1 estimate at your 24.0% rate — not tax advice; consult a CPA.
Schools (NCES district)
- District
- Abilene ISD
- NCES district ID
- 4807440
- Math proficiency
- 32% ▼ -11.00%
- Reading proficiency
- 34% ▼ -5.00%
- Median HH income
- $39,782
- Composite
- 27.71/100
- National rank
- #6909
- State rank
- #575 of 826 in TX
Livability — Abilene
- Score
- 75/100
- State rank
- #142
- US rank
- #4037
Category grades
Schools grade is shown separately in the Schools card above.
Census & demographics
- Census place
- Abilene, TX
- County
- Taylor County · 136,672 people
- City population
- 136,672
- Metro
- Abilene, TX
- Population (ZIP)
- 23,548
- Household income
- $53,513
- Rent vs Own
- Severe rent burden
- 662.0
Population outlook (Taylor County) Hauer SSP2
- Today (2025)
- 145,270 people
- By 2030
- 150,050 · +3.3%
- By 2040
- 159,417 · +9.7%
- By 2050
- 168,883 · +16.3%
- By 2075
- 194,436 · +33.8%
- By 2100
- 203,163 · +39.9%
Race, ethnicity, and origin ACS 2023
- Neighborhood character
- Diverse neighborhood (Simpson 0.60)
- Race & ethnicity
- Hispanic / Latino 48% White 40% Two or more races 24% Black 8%
- Hispanic origin (detail)
- Mexican 44%
- Common ancestry
- Italian 2% Slovak 2% Portuguese 1%
- Foreign-born
- 9% · Canada
- Languages at home
- 73% English-only · Spanish 25%
Political lean MEDSL · Taylor
- 2024 margin
- Solid R (+49.8) · D 24.6% · R 74.4% · Other 1.0%
- 2008→2024 swing
- -4.2pp toward R · 2008: -45.6pp · 2024: -49.8pp
- All cycles
- 2024: R+49.8 2020: R+45.3 2016: R+51.1 2012: R+53.6 2008: R+45.6
Not yet ingested
- Civics
- —
Market trends
- HPI YoY
- ▼ -88.84%
- Current HPI
- 184.8875
- Rent YoY
- ▲ 40.19%
- Metro
- Abilene, TX
- State GDP YoY
- ▲ 3.95%
- F500 in state
- 110
Industry mix (Fortune 500 HQ in TX)
| Industry | F500 HQs | Revenue |
|---|---|---|
| Energy | 16 | $1,198B |
|
||
| Technology | 5 | $198B |
|
||
| Engineering / Construction | 4 | $72B |
|
||
| Energy Services | 3 | $60B |
|
||
| Utilities | 3 | $41B |
|
||
| Healthcare | 2 | $330B |
|
||
Price history
7 events — show timeline
- 2026-06-10 Sold (MLS) — NTREIS
- 2026-05-15 Pending — NTREIS
- 2026-05-10 Contingent — NTREIS
- 2026-05-07 Listed $255,000 NTREIS
- 2006-01-20 Sold (Public Records) — Public Records
- 2005-11-16 Sold (Public Records) — Public Records
- 2000-04-20 Sold (Public Records) — Public Records
Property tax history
+5.0%/yrLatest (2025): $3,448 · +8.3% YoY. Source: county tax records.
Cash-flow waterfall
monthlySold comps — $/sqft
last 12 mo · ≤1 miLoading sold comps…