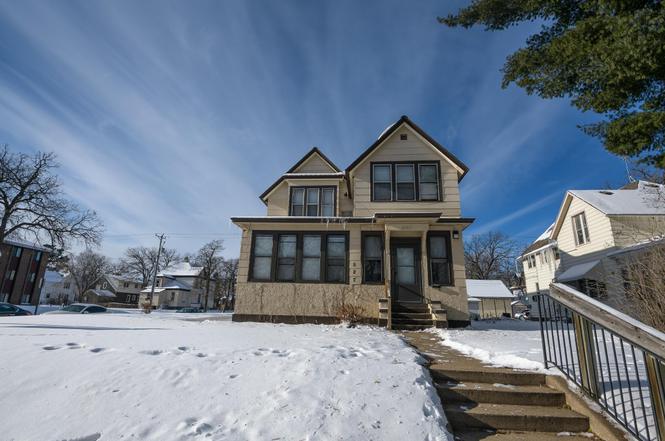
527 6th Ave S · St. Cloud, MN
Flood risk 1/10 · Minimal
- FEMA flood zone
- X (unshaded)
- Chance of flooding over 30 yrs
- 0.0%
- Est. flood insurance / yr
- $507 – $1,088
Fire risk 1/10 · Minimal
- Est. fire insurance / yr
- $888 – $1,650
Heat risk 2/10 · Minimal
- Hot days now (above 97°F)
- 7 days/yr
- Hot days in 30 yrs
- 13 days/yr
Wind risk 2/10 · Minimal
- Chance of severe wind over 30 yrs
- —
Air-quality risk 3/10 · Minor
- Unhealthy air days now
- 3 days/yr
- Unhealthy air days in 30 yrs
- 3 days/yr
Risk factors via First Street. Map © Google.
Why this score? — see what drove the C grade
The composite is a weighted blend of 9 inputs, each scored 0–100. Each bar is that input's sub-score; the figure is the points it added to the 100-point composite (weight × sub-score).
- Cash flow +23.7/30.0
- DSCR +7.6/10.0
- ARV discount +7.5/15.0
- 1% rule +6.2/10.0
- Rent growth +3.3/5.0
- Schools +2.8/10.0
- Livability +2.5/5.0
- Condition / age +2.5/5.0
- Appreciation +0.0/10.0
$184,900
🖨 Deal sheet 📄 Offer letter ✓ Due diligence
Listing remarks
Recently refreshed and ready for immediate occupancy!! 7BR plus den lodging house just a quick walk to SCSU, near Lake George & downtown amenities - A fantastic addition or start to your portfolio! Off street parking, main floor laundry, tons of storage. Updated features include fresh paint inside and out, Updated water heater & boiler, New flooring up and down! Added bonus, second kitchen on upper level & 50 year shingles!! Available for immediate showings, come take a look!
Key facts
- Off street parking
- New flooring
- Main floor laundry
Tags
Property features AI
Finance
- Financial info: Standard rental license (rental license active)
Exterior
- Parking: No carport spaces reported
- Utilities: City water connected; City sewer connected; Natural gas
- Home design: Residential property; Two levels
- Construction: Asphalt roof; Foundation area approximately 1,344 (foundation present)
- Exterior features: Wood exterior; Public transit within six blocks
Interior
- Kitchen: Two kitchens
- Bedrooms: 7 bedrooms (mix of main and upper levels)
- Bathrooms: 2 full bathrooms (one on main level, one on upper level)
- Heating & cooling: Hot water heating; No central air
- Interior features: Den; Living room; Full basement
- Laundry & utility: Shared laundry in a common area on the main level
Neighborhood map
What this means for you Summary
Snapshot
- This is a 7-bed/2.0-bath other listed at $185k.
Deal economics
- At list price, monthly cash flow is $352 ($4k/yr) — positive.
- The deal already cash-flows at list — no discount required.
- Meets the 1% rule at list price ($2k rent vs $185k).
- Recommended offer: $163k (12.0% below list) — sets the bar for market timing.
- Cap rate 8.6% vs local median 3.9% in St. Cloud — top-decile yield for the area; either an underpriced asset or a hidden risk that comps aren't pricing in. Stress-test before assuming the spread holds.
Location & tenants
- Location reads: area grade C — affects rentability + tenant quality, not the cash-flow math above.
- St. Cloud Public School District (urban): math 27% / reading 38% proficiency, ranked #264 of 301 in MN (top 88%) — families likely to look elsewhere, expect single-tenant / working-renter base with shorter leases.
- Market conditions: Rents rising (+3.4%/yr); 218 active listings in the ZIP; 661 units permitted in Stearns County in 2024 (291 in 5+ unit buildings).
- This rent runs 34% of the median local income ($73k/yr) — at the standard rent-burdened threshold; future hikes will face affordability resistance.
Forward outlook
- Local home prices are declining (-3.0%/yr); year-one equity from $1k of loan paydown is wiped out by about $6k of value loss. Plan a longer hold.
- Stearns County population projected at +9% by 2050 — modest demand growth; plan on rents tracking national, not racing it.
Negotiation context
- It's been on market 218 days — a 12% lower offer ($163k) is reasonable based on typical stale-listing flexibility.
- 2 sale attempts since 3y ago with the ask held roughly flat each time — persistent listings suggest the price (not the market) is what's stuck; bring a comps-based counter.
Risks & watch-outs
- Watch-outs: built in 1910 — expect roof / HVAC / electrical / plumbing capex.
Questions for the listing agent
- It's been on market 218 days. Have you received any prior offers? Is the seller open to a 12% concession, seller financing, or rate buy-down credit?
- Built in 1910 — when were the roof, HVAC, electrical panel, plumbing, and water heater last replaced?
- Why hasn't it sold? Are there any deal-killer items the seller is aware of (foundation, flood, title, zoning, code violations)?
- Is there a deadline driving the sale (1031 exchange, divorce, estate, relocation)? That informs how much negotiation room exists.
- What's the average days-on-market for RENTAL listings here right now (not sales)? A rising rental-DOM trend means longer vacancies and softer asking-rent achievability than the comps imply.
- What's the recent tenant-quality profile in this submarket — average credit score on applications, eviction rate, late-payment / NSF rate, and stable-employment percentage? A property-management company in the area should have these aggregated.
- How much new for-sale + rental construction is in the pipeline within 1–3 miles? Heavy new supply typically softens prices + rents 12–24 months out; constrained supply supports both.
Investment metrics
- 1% rule
- 1.12% ✓
- Cap rate
- 8.58%
- Cash-on-cash
- 8.16%
- DSCR
- 1.36
- GRM
- 7.5
CMA / ARV
No comps found within radius.
Projected returns pro-forma
-3.0% appreciation · 3.38% rent growth · sell at horizon
- IRR
- -3.4%
- Equity multiple
- 0.87×
- Total profit
- $-6,709
- Equity at exit
- $27,569
- IRR
- 6.7%
- Equity multiple
- 1.51×
- Total profit
- $26,452
- Equity at exit
- $15,987
Cash invested: $51,772 (down + closing). Projections, not guarantees.
Landlord ↔ Tenant lean methodology
- Overall (STATE)
- 46 Balanced
- State Minnesota
- 46 Balanced · D+2
- County
- — inherits STATE
- City
- — inherits STATE
ZIP-level market 56301
- Rents YoY
- 3.4%
- Active inventory
- 218
- Price-to-rent
- 7.5×
Monthly cashflow live
- Estimated rent
- $2,067 medium interval (Pro) →
- Mortgage (P&I)
- −$970
- Tax from tax record
- −$234 /mo · $2,814/yr
- Insurance
- −$77
- HOA
- −$0
- Vacancy / Maint / Mgmt
- −$434
- Net cashflow
- $352
Break-even live
UW: 25.0% down · 7.5% · 30yr · 1.5% tax · 5.0% vac · 8.0% maint · 8.0% mgmt
Financing live
Cash to close
- Down payment
- $46,225
- Closing costs
- $5,547
- Reserves months
- —
- Total cash needed
- —
Loan-product check · same deal, 3 products live
Conventional
25% down · 7.5% · 30yr
- Down + closing
- —
- Monthly P&I
- —
- Monthly cashflow
- —
- DSCR
- —
- Eligible?
- —
Personal DTI + credit; lowest rate.
DSCR
20% down · 8.5% · 30yr
- Down + closing
- —
- Monthly P&I
- —
- Monthly cashflow
- —
- DSCR
- —
- Eligible?
- —
No personal income docs; deal must DSCR.
Hard money
10% down · 12.0% · 12mo
- Down + closing
- —
- Monthly P&I
- —
- Monthly cashflow
- —
- DSCR
- —
- Eligible?
- —
Short-term bridge; refi at stabilization.
Listing history 12 events
-
2026-05-08status Pending
-
2026-04-30historical Contingent - Inspection
-
2026-02-25price $184,900
-
2025-10-01$189,900 Active
-
2025-10-01historical
-
2025-09-08price $179,900
-
2025-03-27price $189,900
-
2024-08-21price $195,000
-
2023-09-21price $199,900
-
2023-09-05price $209,900
-
2023-06-28price $219,900
-
2023-05-31$225,900 Active
ⓘ Source: listings_history table (triggers on properties + properties_extension) + one-shot
backfill from property_details.listing_events for pre-trigger history.
Tax reassessment forecast MN · Partial reset (capped growth)
- Current annual tax
- $2,814 · $234/mo
- Projected year-2 tax
- $2,814 · $234/mo
- Expected delta
- $0/yr ($0/mo · 0.0%)
ⓘ Screening estimate from a state-policy table — verify with the county assessor before closing.
Climate risk First Street
- Flood 1/10 Low FEMA zone X (unshaded) · 0% chance over 30 yrs
- Wildfire 1/10 Low
- Heat 2/10 Low 7 d/yr ≥97°F today · 13 d/yr by 30 yrs out
- Wind 2/10 Low
- Air quality 3/10 Moderate 3 unhealthy d/yr today · 3 by 30 yrs out
Nearby sold comps map
Loading sold comps map…
Walkable amenities ~0.75 mi
Loading nearby amenities…
Taxation est. · year 1
- Rental income
- $24,810
- − Mortgage interest
- −$10,357
- − Property taxes
- −$2,814
- − Insurance
- −$924
- − Repairs & maintenance
- −$1,985
- − Management
- −$1,985
- − Depreciation
- −$5,379
- Taxable income
- $1,365
- Est. tax owed @ 24.0%
- −$328
- After-tax cash flow
- $3,898/yr
For passive investors: Depreciation is non-cash, so a rental often shows a tax loss while cash-flowing — sheltering income. Rental losses are passive: they offset passive income freely, and up to $25,000/yr can offset ordinary (W-2) income if you actively participate and your MAGI is under $100k (phasing out to $0 by $150k); unused losses carry forward. On sale, claimed depreciation is recaptured at up to 25%, and gains may owe capital-gains tax (a 1031 exchange can defer both). Figures are a year-1 estimate at your 24.0% rate — not tax advice; consult a CPA.
Schools (NCES district)
- District
- St. Cloud Public School District
- NCES district ID
- 2733510
- Math proficiency
- 27% ▼ -9.00%
- Reading proficiency
- 38% ▼ -5.00%
- Median HH income
- $46,638
- Composite
- 27.91/100
- National rank
- #6866
- State rank
- #264 of 301 in MN
Livability — St. Cloud
No livability data for this city. (Only ~50 U.S. cities are tracked.)
Census & demographics
- Census place
- St. Cloud, MN
- County
- Stearns County · 90,226 people
- City population
- 60,914
- Metro
- St. Cloud, MN
- Population (ZIP)
- 35,580
- Household income
- $73,142
- Rent vs Own
- Severe rent burden
- 1831.0
Population outlook (Stearns County) Hauer SSP2
- Today (2025)
- 162,629 people
- By 2030
- 166,495 · +2.4%
- By 2040
- 172,661 · +6.2%
- By 2050
- 177,480 · +9.1%
- By 2075
- 192,907 · +18.6%
- By 2100
- 206,274 · +26.8%
Race, ethnicity, and origin ACS 2023
- Neighborhood character
- Predominantly White (66%)
- Race & ethnicity
- White 66% Black 20% Hispanic / Latino 6% Two or more races 6% Asian 4%
- Hispanic origin (detail)
- Mexican 2% Puerto Rican 1%
- Common ancestry
- Portuguese 6% Romanian 4% Lithuanian 2%
- Foreign-born
- 16% · Canada, Vietnam
- Languages at home
- 77% English-only · Spanish 4% Other Asian/Pacific 2% Other Indo-European 1%
Political lean MEDSL · Stearns
- 2024 margin
- Strong R (+26.8) · D 35.7% · R 62.5% · Other 1.9%
- 2008→2024 swing
- -19.8pp toward R · 2008: -7.0pp · 2024: -26.8pp
- All cycles
- 2024: R+26.8 2020: R+22.5 2016: R+27.9 2012: R+12.1 2008: R+7.0
Not yet ingested
- Civics
- —
Market trends
- HPI YoY
- ▼ -102.70%
- Current HPI
- 148.6882
- Rent YoY
- ▲ 3.38%
- Metro
- St. Cloud, MN
- State GDP YoY
- ▲ 2.41%
- F500 in state
- 34
Industry mix (Fortune 500 HQ in MN)
| Industry | F500 HQs | Revenue |
|---|---|---|
| Healthcare | 2 | $407B |
|
||
| Retail | 2 | $150B |
|
||
| Consumer Goods | 2 | $32B |
|
||
| Industrial Machinery | 2 | $6B |
|
||
| Agriculture | 1 | $40B |
|
||
| Healthcare / Medical Devices | 1 | $32B |
|
||
Price history
-18.1% since first listed12 events — show timeline
- 2026-05-08 Pending — NORTHSTARMLS as Distributed by MLS Grid
- 2026-04-30 Contingent — NORTHSTARMLS as Distributed by MLS Grid
- 2026-02-25 Price Changed $184,900 NORTHSTARMLS as Distributed by MLS Grid
- 2025-10-01 Listing Removed — NORTHSTARMLS as Distributed by MLS Grid
- 2025-10-01 Listed $189,900 NORTHSTARMLS as Distributed by MLS Grid
- 2025-09-08 Price Changed $179,900 NORTHSTARMLS as Distributed by MLS Grid
- 2025-03-27 Price Changed $189,900 NORTHSTARMLS as Distributed by MLS Grid
- 2024-08-21 Price Changed $195,000 NORTHSTARMLS as Distributed by MLS Grid
- 2023-09-21 Price Changed $199,900 NORTHSTARMLS as Distributed by MLS Grid
- 2023-09-05 Price Changed $209,900 NORTHSTARMLS as Distributed by MLS Grid
- 2023-06-28 Price Changed $219,900 NORTHSTARMLS as Distributed by MLS Grid
- 2023-05-31 Listed $225,900 NORTHSTARMLS as Distributed by MLS Grid
Property tax history
+1.7%/yrLatest (2025): $2,814 · +1.7% YoY. Source: county tax records.
Cash-flow waterfall
monthlySold comps — $/sqft
last 12 mo · ≤1 miLoading sold comps…