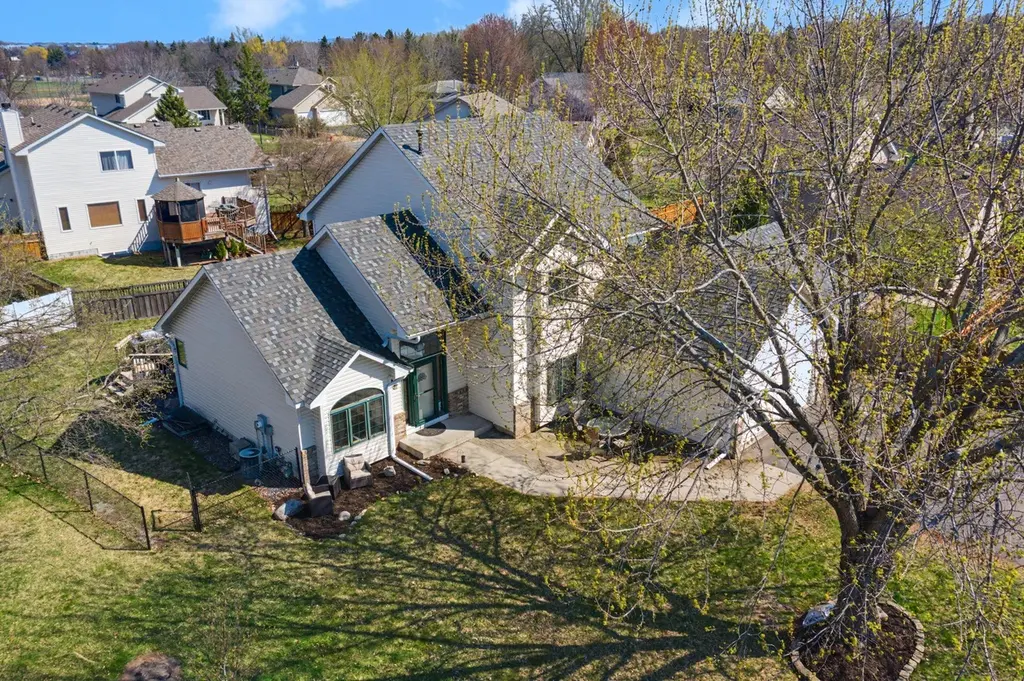
10956 Fox Hollow Cir N · Champlin, MN
Flood risk 1/10 · Minimal
- FEMA flood zone
- X (unshaded)
- Chance of flooding over 30 yrs
- 0.0%
- Est. flood insurance / yr
- $507 – $1,088
Fire risk 1/10 · Minimal
- Est. fire insurance / yr
- $888 – $1,650
Heat risk 2/10 · Minimal
- Hot days now (above 100°F)
- 7 days/yr
- Hot days in 30 yrs
- 14 days/yr
Wind risk 2/10 · Minimal
- Chance of severe wind over 30 yrs
- —
Air-quality risk 2/10 · Minimal
- Unhealthy air days now
- 2 days/yr
- Unhealthy air days in 30 yrs
- 2 days/yr
Risk factors via First Street. Map © Google.
Why this score? — see what drove the D- grade
The composite is a weighted blend of 9 inputs, each scored 0–100. Each bar is that input's sub-score; the figure is the points it added to the 100-point composite (weight × sub-score).
- ARV discount +13.8/15.0
- Cash flow +6.9/30.0
- Schools +4.7/10.0
- Livability +4.5/5.0
- Rent growth +2.5/5.0
- Condition / age +2.5/5.0
- 1% rule +1.9/10.0
- DSCR +1.1/10.0
- Appreciation +0.0/10.0
$400,000
🖨 Deal sheet 📄 Offer letter ✓ Due diligence
Listing remarks MLS
Master suite features large walk-in closet, master bath includes corner jacuzzi tub. Park less than 1 block away. Property located in a cul-de-sac. Subject to bank approval.
Key facts
- 9,147 sq ft lot
- 3 garage spots
- Built 1999
Property features AI
Finance
- Other: Lot approximately 0.21 acres (lot dimensions: 67 x 25 x 123 x 82 x 144); Above grade finished area included; Below grade finished area included
Exterior
- Parking: Attached garage with garage door opener; 3-car garage (approximately 27'8" x 22'3"); Asphalt driveway
- Utilities: City water connected (water in street); City sewer connected (sewer in street); Electrical service with circuit breakers; Natural gas
- Home design: Residential property; Two levels; Primary living on main level; Above- and below-grade finished living areas included
- Construction: Brick/stone and other construction materials; Foundation: block, brick/mortar and other; Roof 8 years old or newer
- Exterior features: Deck, patio and side porch; Stone and vinyl exterior; Full fencing (chain link, vinyl, wood); Cul-de-sac frontage; Public maintained road
Interior
- Kitchen: Dishwasher; Range; Microwave; Refrigerator; Stainless steel appliances; Kitchen island; Eat-in kitchen / informal dining
- Bedrooms: 4 bedrooms total; Primary bedroom suite (main floor); Three bedrooms on upper level; Main floor bedroom
- Flooring: Tile floors
- Bathrooms: Full primary bath with separate tub and walk-in shower; Private primary bath; Upper level full bath; Main floor 3/4 bath; Upper level 3/4 bath
- Heating & cooling: Forced air heating; Central air conditioning; Fireplace(s) provide supplementary heat
- Interior features: Ceiling fans; Gas fireplace with insert in living room; Partially finished basement with egress window(s); Water softener owned; In-ground sprinkler; Kitchen center island; Kitchen window; Walk-in closet(s)
- Laundry & utility: Main level laundry; Washer hookup; Gas dryer hookup; Washer/Dryer hookup (general)
Neighborhood map
What this means for you Summary
Snapshot
- This is a 4-bed/3.0-bath single-family listed at $400k.
Deal economics
- At list price, monthly cash flow is $-605 ($-7k/yr) — negative.
- To cash-flow at today's rent, offer at most $293k (26.7% below list).
- To meet the 1% rule (rent ≥ 1% of price), the offer needs to be $276k (31.0% below list).
- Recommended offer: $276k (31.0% below list) — sets the bar for 1% rule.
Location & tenants
- Location reads 90/100 on livability (#4 in MN, #106 nationally) — a professional / high-income tenant draw. Strengths: commute A+, employment A+, housing A+.
- Anoka-Hennepin Public School District (suburban): math 49% / reading 55% proficiency, ranked #71 of 301 in MN (top 24%) — acceptable for families but not a draw, mixed tenant base, ~2y average lease.
- Market conditions: 106 active listings in the ZIP; 3 comparable units currently listed for rent nearby; rentals at typical pace (median 20d on market — plan ~3-4 weeks tenant-placement turnaround); high-income renter base; 4,651 units permitted in Hennepin County in 2024 (2,443 in 5+ unit buildings).
Forward outlook
- Local home prices are declining (-3.0%/yr); year-one equity from $3k of loan paydown is wiped out by about $12k of value loss. Plan a longer hold.
- Hennepin County population projected at +30% by 2050 — long-run rental-demand tailwind backs the buy-and-hold thesis.
Negotiation context
- Only 14 days on market — expect competitive offers; lowballing is unlikely to land.
- 6 sale attempts since 24y ago; this cycle's ask has dropped $25k (6%) from the opening price — seller is motivated, your offer sets the floor, not the list.
- Current owner paid $260k; list at $400k implies a 54% gain — meaningful room to come down on a strong offer.
Questions for the listing agent
- What do current leases actually rent for vs. the listed asking? Can we see a recent rent roll and the last 12 months of T-12 income?
- Is there a deadline driving the sale (1031 exchange, divorce, estate, relocation)? That informs how much negotiation room exists.
- Schools are A-rated — typically a magnet for longer-tenancy family renters. What's the average tenant stay here, and is there a school-zone premium baked into asking?
- The area grade is low — what's the realistic commute time and amenity access for the typical tenant pool here? Any planned neighborhood developments (good or bad) we should know about?
- What's the average days-on-market for RENTAL listings here right now (not sales)? A rising rental-DOM trend means longer vacancies and softer asking-rent achievability than the comps imply.
- What's the recent tenant-quality profile in this submarket — average credit score on applications, eviction rate, late-payment / NSF rate, and stable-employment percentage? A property-management company in the area should have these aggregated.
- How much new for-sale + rental construction is in the pipeline within 1–3 miles? Heavy new supply typically softens prices + rents 12–24 months out; constrained supply supports both.
Investment metrics
- 1% rule
- 0.69% ✗
- Cap rate
- 4.48%
- Cash-on-cash
- -6.48%
- DSCR
- 0.71
- GRM
- 12.1
CMA / ARV
- ARV (median comp)
- $465,393
- List price
- $400,000
- Delta
- -14.05%
- Verdict
- UNDERPRICED
- Comps
- 6 within 1.0 mi
Show comp detail 3 sales within ~0.75 mi
| Address | Dist | Beds/Ba | Sqft | Sold | Price | $/sf | Match |
|---|---|---|---|---|---|---|---|
| 10013 Hidden Oaks Ln N | 0.11mi | 3/3.0 (-1) | 2,107 (+4%) | 12mo | $468,000 | $222 | 74 |
| 11140 Gettysburg Ave N | 0.42mi | 3/2.0 (-1) | 2,088 (+3%) | 21mo | $340,000 | $163 | 50 |
| 10698 Boundary Creek Ter | 0.54mi | 4/2.0 | 1,803 (-11%) | 16mo | $375,000 | $208 | 39 |
Match score weights: distance 35% · size 25% · config 20% · recency 20%. Top-matched comps best support the ARV.
Projected returns pro-forma
-3.0% appreciation · 3.0% rent growth · sell at horizon
- IRR
- -27.5%
- Equity multiple
- 0.08×
- Total profit
- $-103,292
- Equity at exit
- $59,641
- IRR
- -25.6%
- Equity multiple
- -0.24×
- Total profit
- $-139,334
- Equity at exit
- $34,585
Cash invested: $112,000 (down + closing). Projections, not guarantees.
Landlord ↔ Tenant lean methodology
- Overall (STATE)
- 46 Balanced
- State Minnesota
- 46 Balanced · D+2
- County
- — inherits STATE
- City
- — inherits STATE
ZIP-level market 55316
- Active inventory
- 106
- Price-to-rent
- 12.1×
Monthly cashflow live
- Estimated rent
- $2,761 medium interval (Pro) →
- Mortgage (P&I)
- −$2,098
- Tax from tax record
- −$522 /mo · $6,263/yr
- Insurance
- −$167
- HOA
- −$0
- Vacancy / Maint / Mgmt
- −$580
- Net cashflow
- $-605
Break-even live
UW: 25.0% down · 7.5% · 30yr · 1.5% tax · 5.0% vac · 8.0% maint · 8.0% mgmt
Financing live
Cash to close
- Down payment
- $100,000
- Closing costs
- $12,000
- Reserves months
- —
- Total cash needed
- —
Loan-product check · same deal, 3 products live
Conventional
25% down · 7.5% · 30yr
- Down + closing
- —
- Monthly P&I
- —
- Monthly cashflow
- —
- DSCR
- —
- Eligible?
- —
Personal DTI + credit; lowest rate.
DSCR
20% down · 8.5% · 30yr
- Down + closing
- —
- Monthly P&I
- —
- Monthly cashflow
- —
- DSCR
- —
- Eligible?
- —
No personal income docs; deal must DSCR.
Hard money
10% down · 12.0% · 12mo
- Down + closing
- —
- Monthly P&I
- —
- Monthly cashflow
- —
- DSCR
- —
- Eligible?
- —
Short-term bridge; refi at stabilization.
Rent comps 3 comps
| Address | Beds | Baths | Sqft | Rent | $/sqft | DOM | Units | Dist |
|---|---|---|---|---|---|---|---|---|
| 10414 Valley Forge Ln N Maple Grove, MN | 4.0 | 2.0 | 2487 | $3,300 | $1.33 | 19d | 1 | 0.80mi |
| 11408 Winnetka Ave N Champlin, MN | 3.0 | 1.0 | 1428 | $1,050 | $0.74 | 20d | 1 | 1.48mi |
| 11960 Emery Village Dr N Champlin, MN | 3.0 | 3.0 | 1665 | $2,299 | $1.38 | 21d | 1 | 1.49mi |
Listing history 19 events
-
2026-05-12status Pending 1558-char remark
-
2026-05-11status Active 1558-char remark
-
2026-05-11status Pending 1558-char remark
-
2026-05-06price $400,000 1558-char remark
-
2026-04-29$425,000 Active 1558-char remark
-
2026-04-25historical $425,000 1558-char remark
-
2009-04-24soldstatus $259,500 173-char remark
Show marketing remark (173 chars)
Master suite features large walk-in closet, master bath includes corner jacuzzi tub. Park less than 1 block away. Property located in a cul-de-sac. Subject to bank approval.
-
2009-04-20historical 173-char remark
Show marketing remark (173 chars)
Master suite features large walk-in closet, master bath includes corner jacuzzi tub. Park less than 1 block away. Property located in a cul-de-sac. Subject to bank approval.
-
2009-01-14$255,000 173-char remark
Show marketing remark (173 chars)
Master suite features large walk-in closet, master bath includes corner jacuzzi tub. Park less than 1 block away. Property located in a cul-de-sac. Subject to bank approval.
-
2008-12-29historical
-
2008-09-19$249,900
-
2008-08-26historical
-
2008-02-26$259,900
-
2002-07-24soldstatus $255,000
-
2002-06-18soldstatus $255,000
-
2002-04-30soldstatus $255,000
-
2002-02-14historical
-
2002-02-01$259,900
-
1999-03-16soldstatus $45,900
ⓘ Source: listings_history table (triggers on properties + properties_extension) + one-shot
backfill from property_details.listing_events for pre-trigger history.
Tax reassessment forecast MN · Partial reset (capped growth)
- Current annual tax
- $6,263 · $522/mo
- Projected year-2 tax
- $6,263 · $522/mo
- Expected delta
- $0/yr ($0/mo · 0.0%)
ⓘ Screening estimate from a state-policy table — verify with the county assessor before closing.
Climate risk First Street
- Flood 1/10 Low FEMA zone X (unshaded) · 0% chance over 30 yrs
- Wildfire 1/10 Low
- Heat 2/10 Low 7 d/yr ≥100°F today · 14 d/yr by 30 yrs out
- Wind 2/10 Low
- Air quality 2/10 Low 2 unhealthy d/yr today · 2 by 30 yrs out
Nearby sold comps map
Loading sold comps map…
Walkable amenities ~0.75 mi
Loading nearby amenities…
Taxation est. · year 1
- Rental income
- $33,134
- − Mortgage interest
- −$22,406
- − Property taxes
- −$6,263
- − Insurance
- −$2,000
- − Repairs & maintenance
- −$2,651
- − Management
- −$2,651
- − Depreciation
- −$11,636
- Taxable loss
- −$14,474
- Est. tax savings @ 24.0%
- +$3,474
- After-tax cash flow
- $-3,786/yr
For passive investors: Depreciation is non-cash, so a rental often shows a tax loss while cash-flowing — sheltering income. Rental losses are passive: they offset passive income freely, and up to $25,000/yr can offset ordinary (W-2) income if you actively participate and your MAGI is under $100k (phasing out to $0 by $150k); unused losses carry forward. On sale, claimed depreciation is recaptured at up to 25%, and gains may owe capital-gains tax (a 1031 exchange can defer both). Figures are a year-1 estimate at your 24.0% rate — not tax advice; consult a CPA.
Schools (NCES district)
- District
- Anoka-Hennepin Public School District
- NCES district ID
- 2703180
- Math proficiency
- 49% ▼ -14.00%
- Reading proficiency
- 55% ▼ -10.00%
- Median HH income
- $73,837
- Composite
- 46.7/100
- National rank
- #2400
- State rank
- #71 of 301 in MN
Livability — Champlin
- Score
- 90/100
- State rank
- #4
- US rank
- #106
Category grades
Schools grade is shown separately in the Schools card above.
Census & demographics
- Census place
- Champlin, MN
- County
- Hennepin County · 1,150,272 people
- City population
- 23,294
- Metro
- Minneapolis-St. Paul-Bloomington, MN-WI
- Population (ZIP)
- 23,294
- Household income
- $116,102
- Rent vs Own
- Severe rent burden
- 270.0
Population outlook (Hennepin County) Hauer SSP2
- Today (2025)
- 1,405,227 people
- By 2030
- 1,492,650 · +6.2%
- By 2040
- 1,660,157 · +18.1%
- By 2050
- 1,823,498 · +29.8%
- By 2075
- 2,221,283 · +58.1%
- By 2100
- 2,509,976 · +78.6%
Race, ethnicity, and origin ACS 2023
- Neighborhood character
- Predominantly White (78%)
- Race & ethnicity
- White 78% Black 11% Asian 4% Two or more races 4% Hispanic / Latino 2%
- Common ancestry
- Portuguese 12% Romanian 4% Lithuanian 3%
- Foreign-born
- 11% · Canada, Vietnam, South Korea
- Languages at home
- 88% English-only · Russian/Polish/Slavic 2% Other Asian/Pacific 2% Spanish 1%
Political lean MEDSL · Hennepin
- 2024 margin
- Solid D (+42.6) · D 70.2% · R 27.5% · Other 2.3%
- 2008→2024 swing
- +14.0pp toward D · 2008: 28.6pp · 2024: 42.6pp
- All cycles
- 2024: D+42.6 2020: D+43.2 2016: D+35.3 2012: D+27.1 2008: D+28.6
Not yet ingested
- Civics
- —
Market trends
- HPI YoY
- ▼ -311.30%
- Current HPI
- 229.5956
- Rent YoY
- —
- Metro
- Minneapolis-St. Paul-Bloomington, MN-WI
- State GDP YoY
- ▲ 2.41%
- F500 in state
- 34
Industry mix (Fortune 500 HQ in MN)
| Industry | F500 HQs | Revenue |
|---|---|---|
| Healthcare | 2 | $407B |
|
||
| Retail | 2 | $150B |
|
||
| Consumer Goods | 2 | $32B |
|
||
| Industrial Machinery | 2 | $6B |
|
||
| Agriculture | 1 | $40B |
|
||
| Healthcare / Medical Devices | 1 | $32B |
|
||
Price history
+771.5% since first listed20 events — show timeline
- 2026-05-12 Pending — NORTHSTARMLS as Distributed by MLS Grid
- 2026-05-12 Listing Removed — NORTHSTARMLS as Distributed by MLS Grid
- 2026-05-11 Relisted — NORTHSTARMLS as Distributed by MLS Grid
- 2026-05-11 Pending — NORTHSTARMLS as Distributed by MLS Grid
- 2026-05-06 Price Changed $400,000 NORTHSTARMLS as Distributed by MLS Grid
- 2026-04-29 Listed $425,000 NORTHSTARMLS as Distributed by MLS Grid
- 2026-04-25 Coming Soon — NORTHSTARMLS as Distributed by MLS Grid
- 2009-04-24 Sold (MLS) $259,500 NORTHSTARMLS as Distributed by MLS Grid
- 2009-04-20 Listing Removed — NORTHSTARMLS as Distributed by MLS Grid
- 2009-01-14 Listed $255,000 NORTHSTARMLS as Distributed by MLS Grid
- 2008-12-29 Listing Removed — NORTHSTARMLS as Distributed by MLS Grid
- 2008-09-19 Listed $249,900 NORTHSTARMLS as Distributed by MLS Grid
- 2008-08-26 Listing Removed — NORTHSTARMLS as Distributed by MLS Grid
- 2008-02-26 Listed $259,900 NORTHSTARMLS as Distributed by MLS Grid
- 2002-07-24 Sold (Public Records) $255,000 Public Records
- 2002-06-18 Sold (Public Records) $255,000 Public Records
- 2002-04-30 Sold (MLS) $255,000 NORTHSTARMLS as Distributed by MLS Grid
- 2002-02-14 Listing Removed — NORTHSTARMLS as Distributed by MLS Grid
- 2002-02-01 Listed $259,900 NORTHSTARMLS as Distributed by MLS Grid
- 1999-03-16 Sold (Public Records) $45,900 Public Records
Property tax history
+3.6%/yrLatest (2025): $6,263 · -4.9% YoY. Source: county tax records.
Cash-flow waterfall
monthlySold comps — $/sqft
last 12 mo · ≤1 miLoading sold comps…