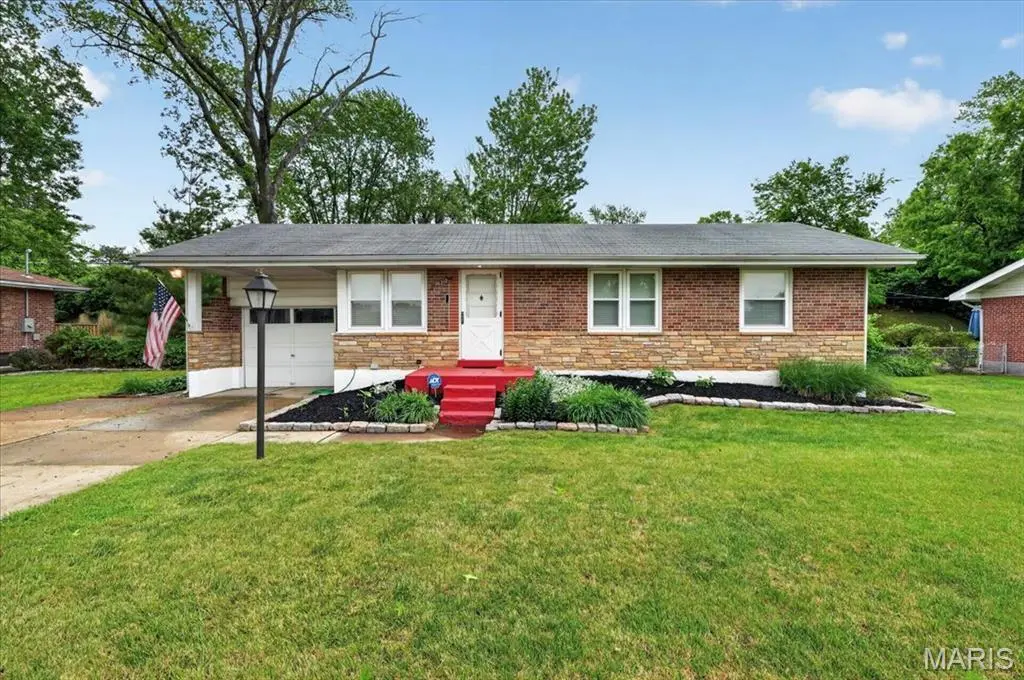
10312 Seaton Dr · Bellefontaine Neighbors, MO
Flood risk 1/10 · Minimal
- FEMA flood zone
- X (unshaded)
- Chance of flooding over 30 yrs
- 0.0%
- Est. flood insurance / yr
- $473 – $860
Fire risk 1/10 · Minimal
- Est. fire insurance / yr
- $1,054 – $1,958
Heat risk 5/10 · Moderate
- Hot days now (above 107°F)
- 7 days/yr
- Hot days in 30 yrs
- 21 days/yr
Wind risk 2/10 · Minimal
- Chance of severe wind over 30 yrs
- 1.0%
Air-quality risk 4/10 · Minor
- Unhealthy air days now
- 4 days/yr
- Unhealthy air days in 30 yrs
- 5 days/yr
Risk factors via First Street. Map © Google.
Why this score? — see what drove the C- grade
The composite is a weighted blend of 9 inputs, each scored 0–100. Each bar is that input's sub-score; the figure is the points it added to the 100-point composite (weight × sub-score).
- Cash flow +22.2/30.0
- ARV discount +7.7/15.0
- DSCR +7.1/10.0
- 1% rule +6.0/10.0
- Rent growth +4.1/5.0
- Livability +2.9/5.0
- Condition / age +2.5/5.0
- Schools +0.4/10.0
- Appreciation +0.0/10.0
$139,900
🖨 Deal sheet 📄 Offer letter ✓ Due diligence
Listing remarks
Spacious 4 bedroom, 2 bath brick ranch offering nearly 1,500 sq ft on the main level! This well-maintained home features a desirable family room addition and private primary bedroom suite with convenient half bath. Hardwood flooring flows through the living room, dining room, hallway, and three bedrooms. The eat-in kitchen opens to the inviting family room—perfect for everyday living and entertaining. The partially finished lower level expands your living space with a rec room, bar area, plus plenty of storage and a dedicated laundry area. Step outside to enjoy the large fenced yard complete with a spacious patio and garden areas—ideal for relaxing or hosting gatherings. A 1-car
Key facts
- 0.23 acre lot
- Garage
- Built 1955
Property features AI
Exterior
- Parking: Driveway; Attached garage that faces the front (1 garage space, total parking for 1 vehicle)
- Utilities: Public water; Public sewer; Electricity provided by Ameren; Natural gas connected; Electricity connected; Water connected; Sewer connected
- Home design: Single-family residence; One level; House
- Construction: Brick construction
- Exterior features: Front porch; Patio; Chain link fencing; Near public transit
Interior
- Kitchen: Dishwasher; Electric oven; Free-standing refrigerator
- Bedrooms: 4 bedrooms (all on the main level)
- Flooring: Vinyl flooring; Wood flooring
- Bathrooms: 1 full bath; 1 half bath
- Heating & cooling: Forced air heating; Central air conditioning; Attic fan
- Interior features: Eat-in kitchen; Partially finished basement
- Laundry & utility: Washer and dryer included
Neighborhood map
What this means for you Summary
Snapshot
- This is a 4-bed/2.0-bath single-family listed at $140k.
Deal economics
- At list price, monthly cash flow is $227 ($3k/yr) — positive.
- The deal already cash-flows at list — no discount required.
- Meets the 1% rule at list price ($2k rent vs $140k).
Location & tenants
- Location reads 58/100 on livability (#592 in MO) — a working-class tenant base; expect higher turnover. Strengths: cost of living A+, housing B+; Watch: employment D+, crime F, amenities F.
- Riverview Gardens (suburban): math 2% / reading 9% proficiency, ranked #324 of 324 in MO (top 100%) — low school quality limits family demand, transient renter base, plan for 1-2y turnover; 90% free/reduced lunch — lower-income household profile, screen leases tightly.
- Zoned schools: Gibson Elem. (math 0% / reading 7%, grade F, #1,097 of 1,115 statewide, top 98%, 429 students, 99% FRL); Riverview Gardens Sr. High (math 2% / reading 18%, grade F, #501 of 521 statewide, top 97%, 1,331 students, 100% FRL).
- Market conditions: Rents rising fast (+6.6%/yr); 201 active listings in the ZIP; 40 comparable units currently listed for rent nearby; rentals at typical pace (median 22d on market — plan ~3-4 weeks tenant-placement turnaround); lower-income renter base — watch delinquency; 920 units permitted in St. Louis County in 2024 (250 in 5+ unit buildings).
- This rent runs 42% of the median local income ($43k/yr) — at the standard rent-burdened threshold; future hikes will face affordability resistance.
Forward outlook
- Local home prices are declining (-3.0%/yr); year-one equity from $967 of loan paydown is wiped out by about $4k of value loss. Plan a longer hold.
- At projected returns (-3.0% appreciation + 6.6% rent growth), your $39k cash investment doubles in ~9 years — after that, you're playing with house money.
Negotiation context
- Only 3 days on market — expect competitive offers; lowballing is unlikely to land.
- Current owner paid $80k; list at $140k implies a 75% gain — meaningful room to come down on a strong offer.
Risks & watch-outs
- Watch-outs: built in 1955 — expect roof / HVAC / electrical / plumbing capex.
- Climate carrying-cost: extreme-heat days projected 7→21/yr by 2055 (HVAC capex compounding) — expect insurance premiums to compound above CPI over the hold.
Questions for the listing agent
- Built in 1955 — when were the roof, HVAC, electrical panel, plumbing, and water heater last replaced?
- Is there a deadline driving the sale (1031 exchange, divorce, estate, relocation)? That informs how much negotiation room exists.
- Schools are F-rated, which usually means shorter tenancies and higher turnover. Who's the typical renter profile here, and what's been the actual vacancy rate?
- Crime grade is F in this area — have there been break-ins, vandalism, or insurance claims at this property in the last 3 years? What carrier currently insures it and at what premium?
- What's the average days-on-market for RENTAL listings here right now (not sales)? A rising rental-DOM trend means longer vacancies and softer asking-rent achievability than the comps imply.
- What's the recent tenant-quality profile in this submarket — average credit score on applications, eviction rate, late-payment / NSF rate, and stable-employment percentage? A property-management company in the area should have these aggregated.
- How much new for-sale + rental construction is in the pipeline within 1–3 miles? Heavy new supply typically softens prices + rents 12–24 months out; constrained supply supports both.
Investment metrics
- 1% rule
- 1.10% ✓
- Cap rate
- 8.24%
- Cash-on-cash
- 6.97%
- DSCR
- 1.31
- GRM
- 7.6
CMA / ARV
- ARV (on-the-fly)
- $140,530
- Comps found
- 12
Show comp detail 12 sales within ~0.75 mi
| Address | Dist | Beds/Ba | Sqft | Sold | Price | $/sf | Match |
|---|---|---|---|---|---|---|---|
| 10312 Seaton Dr | 0.00mi | 4/1.5 | 1,495 (0%) | 1mo | $139,900 | $94 | 97 |
| 10454 Coburg Lands Dr | 0.22mi | 3/1.0 (-1) | 1,477 (-1%) | 2mo | $139,400 | $94 | 77 |
| 10232 Tappan Dr | 0.30mi | 3/1.0 (-1) | 1,504 (+1%) | 1mo | $134,900 | $90 | 75 |
| 10300 Toelle Ln | 0.41mi | 3/2.0 (-1) | 1,423 (-5%) | 2mo | $125,000 | $88 | 66 |
| 10240 Toelle Ln | 0.41mi | 3/2.0 (-1) | 1,424 (-5%) | 3mo | $150,000 | $105 | 65 |
| 10537 Repose Dr | 0.35mi | 3/1.0 (-1) | 1,446 (-3%) | 7mo | $139,900 | $97 | 63 |
| 10201 Mccartney Ln | 0.59mi | 3/2.0 (-1) | 1,504 (+1%) | 6mo | $110,900 | $74 | 62 |
| 10519 Repose Dr | 0.32mi | 3/1.0 (-1) | 1,592 (+6%) | 7mo | $29,900 | $19 | 59 |
| 808 Bella Ln | 0.37mi | 4/2.0 | 1,300 (-13%) | 2mo | $104,900 | $81 | 59 |
| 10409 Gardo Ct | 0.62mi | 3/2.5 (-1) | 1,300 (-13%) | 5mo | $149,900 | $115 | 38 |
| 1422 Akron Dr | 0.62mi | 3/1.0 (-1) | 1,663 (+11%) | 7mo | $150,000 | $90 | 38 |
| 1443 Attica Dr | 0.68mi | 3/1.0 (-1) | 1,302 (-13%) | 3mo | $159,600 | $123 | 35 |
Match score weights: distance 35% · size 25% · config 20% · recency 20%. Top-matched comps best support the ARV.
Projected returns pro-forma
-3.0% appreciation · 6.59% rent growth · sell at horizon
- IRR
- -1.6%
- Equity multiple
- 0.94×
- Total profit
- $-2,416
- Equity at exit
- $20,860
- IRR
- 11.7%
- Equity multiple
- 2.07×
- Total profit
- $42,035
- Equity at exit
- $12,096
Cash invested: $39,172 (down + closing). Projections, not guarantees.
Landlord ↔ Tenant lean methodology
- Overall (STATE)
- 81 Strongly Landlord-Friendly
- State Missouri
- 81 Strongly Landlord-Friendly · R+10
- County
- — inherits STATE
- City
- — inherits STATE
ZIP-level market 63137
- Rents YoY
- 6.6%
- Active inventory
- 201
- Price-to-rent
- 7.6×
Monthly cashflow live
- Estimated rent
- $1,533 high interval (Pro) →
- Mortgage (P&I)
- −$734
- Tax from tax record
- −$192 /mo · $2,304/yr
- Insurance
- −$58
- HOA
- −$0
- Vacancy / Maint / Mgmt
- −$322
- Net cashflow
- $227
Break-even live
UW: 25.0% down · 7.5% · 30yr · 1.5% tax · 5.0% vac · 8.0% maint · 8.0% mgmt
Financing live
Cash to close
- Down payment
- $34,975
- Closing costs
- $4,197
- Reserves months
- —
- Total cash needed
- —
Loan-product check · same deal, 3 products live
Conventional
25% down · 7.5% · 30yr
- Down + closing
- —
- Monthly P&I
- —
- Monthly cashflow
- —
- DSCR
- —
- Eligible?
- —
Personal DTI + credit; lowest rate.
DSCR
20% down · 8.5% · 30yr
- Down + closing
- —
- Monthly P&I
- —
- Monthly cashflow
- —
- DSCR
- —
- Eligible?
- —
No personal income docs; deal must DSCR.
Hard money
10% down · 12.0% · 12mo
- Down + closing
- —
- Monthly P&I
- —
- Monthly cashflow
- —
- DSCR
- —
- Eligible?
- —
Short-term bridge; refi at stabilization.
Rent comps 40 comps
| Address | Beds | Baths | Sqft | Rent | $/sqft | DOM | Units | Dist |
|---|---|---|---|---|---|---|---|---|
| 1009 Bliss Dr Saint Louis, MO | 3.0 | 1.0 | 912 | $1,400 | $1.54 | 43d | 1 | 0.05mi |
| 10367 Coburg Lands Dr Saint Louis, MO | 3.0 | 1.0 | 912 | $1,270 | $1.39 | 43d | 1 | 0.15mi |
| 1115 Bakewell Dr Saint Louis, MO | 3.0 | 1.0 | 916 | $1,300 | $1.42 | 43d | 1 | 0.19mi |
| 10203 Trio Ln Saint Louis, MO | 3.0 | 1.0 | 912 | $1,435 | $1.57 | 16d | 1 | 0.27mi |
| 10508 Druid Dr Saint Louis, MO | 3.0 | 1.0 | 1122 | $1,475 | $1.31 | 16d | 1 | 0.29mi |
| 10200 Tappan Dr Saint Louis, MO | 3.0 | 1.0 | 912 | $1,450 | $1.59 | 16d | 1 | 0.35mi |
| 1230 Roxton Dr Saint Louis, MO | 3.0 | 1.0 | 912 | $1,400 | $1.54 | 21d | 1 | 0.36mi |
| 808 Bella Ln Saint Louis, MO | 4.0 | 2.0 | 1300 | $1,650 | $1.27 | 17d | 1 | 0.36mi |
| 1208 Rapid Dr Saint Louis, MO | 3.0 | 1.0 | 992 | $1,375 | $1.39 | 4d | 1 | 0.36mi |
| 1238 Hoyt Dr Saint Louis, MO | 3.0 | 1.0 | 1176 | $1,400 | $1.19 | 21d | 1 | 0.42mi |
| 10331 Ewell Dr Saint Louis, MO | 3.0 | 1.0 | 1658 | $1,540 | $0.93 | 3d | 1 | 0.46mi |
| 10421 Gardo Ct Saint Louis, MO | 3.0 | 2.0 | 1000 | $1,395 | $1.40 | 14d | 1 | 0.58mi |
| 1205 Shepley Dr Saint Louis, MO | 3.0 | 1.0 | 901 | $1,325 | $1.47 | 23d | 1 | 0.59mi |
| 1205 Shepley Dr Saint Louis, MO | 3.0 | 1.0 | 901 | $1,350 | $1.50 | 43d | 1 | 0.59mi |
| 10201 McCartney Ln Saint Louis, MO | 3.0 | 2.0 | 1504 | $1,565 | $1.04 | 16d | 1 | 0.60mi |
| 1255 Bosworth Dr Saint Louis, MO | 3.0 | 1.0 | 1071 | $1,575 | $1.47 | 10d | 1 | 0.67mi |
| 743 Shepley Dr Saint Louis, MO | 3.0 | 1.0 | 932 | $1,025 | $1.10 | 7d | 1 | 0.69mi |
| 10401 Hobkirk Dr Saint Louis, MO | 3.0 | 1.0 | 1050 | $1,500 | $1.43 | 17d | 1 | 0.72mi |
| 10052 Lilac Ave Saint Louis, MO | 3.0 | 1.5 | 1143 | $1,100 | $0.96 | 7d | 1 | 0.74mi |
| 10201 Gourock Dr Saint Louis, MO | 3.0 | 1.0 | 886 | $1,275 | $1.44 | 43d | 1 | 0.75mi |
| 10052 Diamond Dr Saint Louis, MO | 4.0 | 1.0 | 1181 | $1,495 | $1.27 | 12d | 1 | 0.86mi |
| 10524 Durness Dr Saint Louis, MO | 3.0 | 1.0 | 1000 | $1,250 | $1.25 | 43d | 1 | 0.88mi |
| 10515 Renfrew Dr Saint Louis, MO | 3.0 | 1.0 | 1670 | $1,400 | $0.84 | 4d | 1 | 0.91mi |
| 10515 Renfrew Dr Saint Louis, MO | 3.0 | 1.0 | 1670 | $1,400 | $0.84 | 7d | 1 | 0.91mi |
| 10519 Renfrew Dr Saint Louis, MO | 3.0 | 1.5 | 982 | $1,399 | $1.42 | 43d | 1 | 0.91mi |
| 10409 Renfrew Dr Saint Louis, MO | 3.0 | 1.0 | 1644 | $1,250 | $0.76 | 23d | 1 | 0.91mi |
| 9924 Gloucester Dr Saint Louis, MO | 3.0 | 2.0 | 992 | $1,565 | $1.58 | 10d | 1 | 0.92mi |
| 437 Lancashire Rd Saint Louis, MO | 3.0 | 1.0 | 1082 | $1,395 | $1.29 | 43d | 1 | 0.97mi |
| 432 Midlothian Rd Saint Louis, MO | 3.0 | 1.0 | 1120 | $1,350 | $1.21 | 10d | 1 | 0.99mi |
| 1130 Forest Home Dr Saint Louis, MO | 3.0 | 1.0 | 1025 | $1,275 | $1.24 | 43d | 1 | 1.00mi |
| 10518 Gretna Cir Saint Louis, MO | 3.0 | 1.0 | 1082 | $1,450 | $1.34 | 23d | 1 | 1.01mi |
| 10309 Galloway Dr Saint Louis, MO | 3.0 | 1.0 | 892 | $1,295 | $1.45 | 12d | 1 | 1.01mi |
| 400 Lancashire Rd Saint Louis, MO | 3.0 | 1.0 | 1200 | $1,095 | $0.91 | 43d | 1 | 1.05mi |
| 10557 Castle Dr Saint Louis, MO | 3.0 | 2.0 | 1023 | $1,300 | $1.27 | 14d | 1 | 1.11mi |
| 10421 Prince Dr Saint Louis, MO | 3.0 | 2.0 | 1023 | $1,275 | $1.25 | 23d | 1 | 1.12mi |
| 10441 Prince Dr Saint Louis, MO | 4.0 | 1.5 | 1380 | $1,380 | $1.00 | 43d | 1 | 1.13mi |
| 308 Lanark Rd Saint Louis, MO | 3.0 | 1.0 | 1154 | $1,400 | $1.21 | 23d | 1 | 1.15mi |
| 368 Cameron Rd Saint Louis, MO | 4.0 | 1.0 | 1628 | $1,580 | $0.97 | 43d | 1 | 1.18mi |
| 10019 Northgate Dr Saint Louis, MO | 3.0 | 1.0 | 991 | $1,150 | $1.16 | 21d | 1 | 1.19mi |
| 251 Midlothian Rd Saint Louis, MO | 3.0 | 1.0 | 1058 | $1,499 | $1.42 | 43d | 1 | 1.21mi |
Listing history 5 events
-
2026-05-01status Pending
-
2026-04-29$139,900 Active
-
2026-04-17historical $139,900
-
2002-12-18soldstatus $79,900
-
1997-02-20soldstatus
ⓘ Source: listings_history table (triggers on properties + properties_extension) + one-shot
backfill from property_details.listing_events for pre-trigger history.
Tax reassessment forecast MO · Resets to sale price
- Current annual tax
- $2,304 · $192/mo
- Projected year-2 tax
- $2,304 · $192/mo
- Expected delta
- $0/yr ($0/mo · 0.0%)
ⓘ Screening estimate from a state-policy table — verify with the county assessor before closing.
Climate risk First Street
- Flood 1/10 Low FEMA zone X (unshaded) · 0% chance over 30 yrs
- Wildfire 1/10 Low
- Heat 5/10 Major 7 d/yr ≥107°F today · 21 d/yr by 30 yrs out
- Wind 2/10 Low 100% chance of damaging wind over 30 yrs
- Air quality 4/10 Moderate 4 unhealthy d/yr today · 5 by 30 yrs out
Nearby sold comps map
Loading sold comps map…
Walkable amenities ~0.75 mi
Loading nearby amenities…
Taxation est. · year 1
- Rental income
- $18,400
- − Mortgage interest
- −$7,837
- − Property taxes
- −$2,304
- − Insurance
- −$700
- − Repairs & maintenance
- −$1,472
- − Management
- −$1,472
- − Depreciation
- −$4,070
- Taxable income
- $546
- Est. tax owed @ 24.0%
- −$131
- After-tax cash flow
- $2,598/yr
For passive investors: Depreciation is non-cash, so a rental often shows a tax loss while cash-flowing — sheltering income. Rental losses are passive: they offset passive income freely, and up to $25,000/yr can offset ordinary (W-2) income if you actively participate and your MAGI is under $100k (phasing out to $0 by $150k); unused losses carry forward. On sale, claimed depreciation is recaptured at up to 25%, and gains may owe capital-gains tax (a 1031 exchange can defer both). Figures are a year-1 estimate at your 24.0% rate — not tax advice; consult a CPA.
Schools (NCES district)
- District
- Riverview Gardens
- NCES district ID
- 2926670
- Math proficiency
- 2% ▼ -6.00%
- Reading proficiency
- 9% ▼ -6.00%
- Median HH income
- $32,759
- Composite
- 4.22/100
- National rank
- #10058
- State rank
- #324 of 324 in MO
Livability — Bellefontaine Neighbors
- Score
- 58/100
- State rank
- #592
- US rank
- #20944
Category grades
Schools grade is shown separately in the Schools card above.
Census & demographics
- Census place
- Bellefontaine Neighbors, MO
- County
- Saint Louis County · 888,823 people
- City population
- 19,684
- Metro
- St. Louis, MO-IL
- Population (ZIP)
- 19,684
- Household income
- $43,422
- Rent vs Own
- Severe rent burden
- 1863.0
Population outlook (St. Louis County) Hauer SSP2
- Today (2025)
- 1,025,227 people
- By 2030
- 1,028,023 · +0.3%
- By 2040
- 1,020,940 · -0.4%
- By 2050
- 1,007,280 · -1.8%
- By 2075
- 987,277 · -3.7%
- By 2100
- 921,984 · -10.1%
Race, ethnicity, and origin ACS 2023
- Neighborhood character
- Predominantly Black (82%)
- Race & ethnicity
- Black 82% White 13% Two or more races 3%
- Common ancestry
- Romanian 1% Lithuanian 1% Italian 1%
- Foreign-born
- 1%
Political lean MEDSL · St. Louis
- 2024 margin
- Strong D (+23.4) · D 60.8% · R 37.4% · Other 1.7%
- 2008→2024 swing
- +3.5pp toward D · 2008: 19.9pp · 2024: 23.4pp
- All cycles
- 2024: D+23.4 2020: D+24.0 2016: D+16.2 2012: D+13.7 2008: D+19.9
Not yet ingested
- Civics
- —
Market trends
- HPI YoY
- ▼ -96.70%
- Current HPI
- 130.6765
- Rent YoY
- ▲ 6.59%
- Metro
- St. Louis, MO-IL
- State GDP YoY
- ▲ 1.84%
- F500 in state
- 20
Industry mix (Fortune 500 HQ in MO)
| Industry | F500 HQs | Revenue |
|---|---|---|
| Healthcare | 1 | $163B |
|
||
| Insurance | 1 | $21B |
|
||
| Industrial Technology | 1 | $17B |
|
||
| Retail | 1 | $16B |
|
||
| Industrial Distribution | 1 | $10B |
|
||
| Utilities | 1 | $9B |
|
||
Price history
+75.1% since first listed5 events — show timeline
- 2026-05-01 Pending — MARIS as Distributed by MLS Grid
- 2026-04-29 Listed $139,900 MARIS as Distributed by MLS Grid
- 2026-04-17 Coming Soon $139,900 MARIS as Distributed by MLS Grid
- 2002-12-18 Sold (Public Records) $79,900 Public Records
- 1997-02-20 Sold (Public Records) — Public Records
Property tax history
+7.3%/yrLatest (2022): $2,304 · +0.9% YoY. Source: county tax records.
Cash-flow waterfall
monthlySold comps — $/sqft
last 12 mo · ≤1 miLoading sold comps…