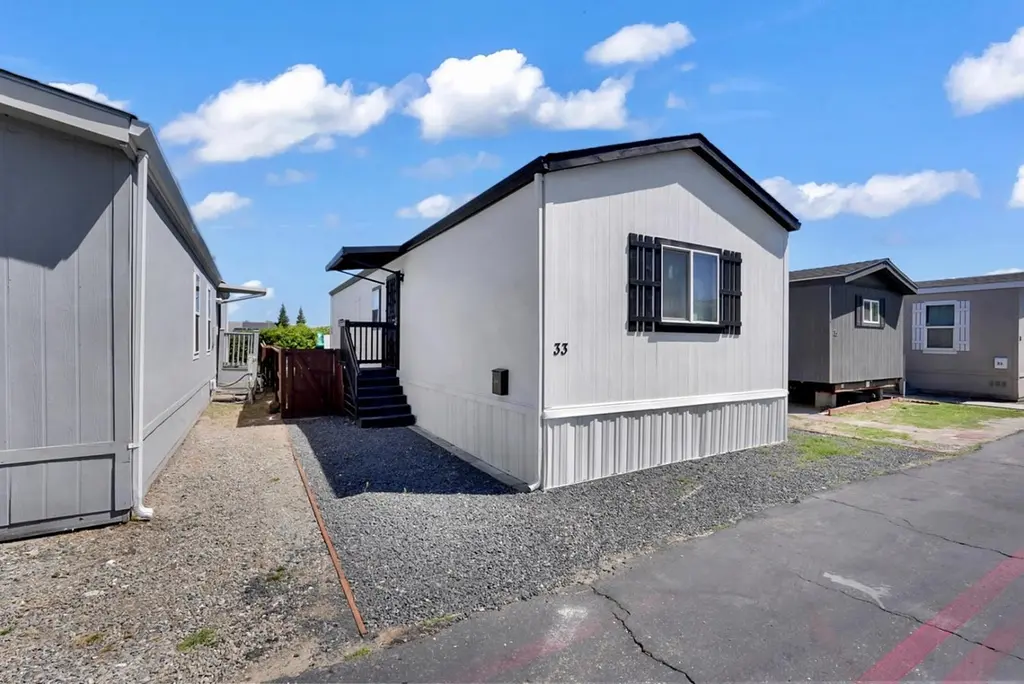
555 Moffat Blvd #33 · Manteca, CA
Flood risk 1/10 · Minimal
- FEMA flood zone
- X (unshaded)
- Chance of flooding over 30 yrs
- 0.0%
- Est. flood insurance / yr
- $507 – $1,088
Fire risk 5/10 · Moderate
- Est. fire insurance / yr
- $659 – $1,223
Heat risk 7/10 · Major
- Hot days now (above 102°F)
- 7 days/yr
- Hot days in 30 yrs
- 15 days/yr
Wind risk 1/10 · Minimal
- Chance of severe wind over 30 yrs
- —
Air-quality risk 10/10 · Severe
- Unhealthy air days now
- 30 days/yr
- Unhealthy air days in 30 yrs
- 31 days/yr
Risk factors via First Street. Map © Google.
Why this score? — see what drove the B- grade
The composite is a weighted blend of 9 inputs, each scored 0–100. Each bar is that input's sub-score; the figure is the points it added to the 100-point composite (weight × sub-score).
- Cash flow +30.0/30.0
- 1% rule +10.0/10.0
- DSCR +10.0/10.0
- ARV discount +7.5/15.0
- Condition / age +4.0/5.0
- Livability +3.1/5.0
- Schools +2.9/10.0
- Rent growth +2.3/5.0
- Appreciation +0.0/10.0
$97,900
🖨 Deal sheet (PDF) 📄 Offer letter ✓ Due diligence
Listing remarks
FULLY REMODELED & UNDER $100K! This beautifully updated 2 Bed, 1 Bath home in the heart of Manteca is the definition of affordable luxury. Completely remodeled from floor to ceiling, located in an all-age park with affordable space rent and just minutes from shopping, restaurants, and freeway access. You truly have to see this one to believe it!
Key facts
- Fully remodeled
- Updated home
- Freeway access
Tags
Property features AI
Finance
- Other: Located in Manteca, CA 95336 (555 Moffat Blvd #33); Directions available to Manteca Mobile Home Park
- HOA & community: No association; Not a senior community; Land lease: No (note: a land lease amount of $1,195 is listed)
Exterior
- Parking: Assigned parking; Attached parking; Guest parking available; No garage
- Utilities: Electric: Other; Public sewer; Public water
- Home design: Manufactured home in a park; Single wide; Built in 2012
- Construction: Manufactured construction; Manufacturer: CMH Manufacturing West Inc; Make: Karsten
- Exterior features: Fence; Regular-shaped lot; Shingle roof
Interior
- Kitchen: Kitchen island
- Bedrooms: 2 bedrooms
- Flooring: Vinyl
- Bathrooms: 1 full bathroom; Tub with shower over
- Heating & cooling: Central heating; Central cooling; Ceiling fan(s)
- Interior features: Vinyl flooring; Ceiling fan(s); Living room with unspecified 'Other' feature; Dining area combined with kitchen; Kitchen island
- Laundry & utility: Laundry inside the unit
Neighborhood map
What this means for you Summary
Snapshot
- This is a 2-bed/1.0-bath manufactured listed at $98k. Condition is rated good.
Deal economics
- At list price, monthly cash flow is $1k ($12k/yr) — positive.
- The deal already cash-flows at list — no discount required.
- Meets the 1% rule at list price ($2k rent vs $98k).
- Recommended offer: $95k (3.0% below list) — sets the bar for market timing.
- Cap rate 18.6% vs local median 2.7% in Manteca — top-decile yield for the area; either an underpriced asset or a hidden risk that comps aren't pricing in. Stress-test before assuming the spread holds.
Location & tenants
- Location reads 61/100 on livability (#535 in CA) — a middle-class / working-renter tenant base. Strengths: housing A+, employment A; Watch: amenities D, commute F, cost of living F.
- Manteca Unified (suburban): math 15% / reading 48% proficiency, ranked #297 of 517 in CA (top 57%) — families likely to look elsewhere, expect single-tenant / working-renter base with shorter leases.
- Zoned schools: Lincoln Elementary (648 students, 65% FRL); Manteca High (math 13% / reading 50%, grade F, #696 of 1,170 statewide, top 60%, 1,811 students, 57% FRL).
- Market conditions: Rents soft (-0.7%/yr); 273 active listings in the ZIP; 30 comparable units currently listed for rent nearby; rentals at typical pace (median 17d on market — plan ~3-4 weeks tenant-placement turnaround); solid renter incomes; 3,779 units permitted in San Joaquin County in 2024 (0 in 5+ unit buildings).
Forward outlook
- Local home prices are declining (-3.0%/yr); year-one equity from $677 of loan paydown is wiped out by about $3k of value loss. Plan a longer hold.
- San Joaquin County population projected at +17% by 2050 — long-run rental-demand tailwind backs the buy-and-hold thesis.
- At projected returns (-3.0% appreciation + 0.0% rent growth), your $27k cash investment doubles in ~3 years — after that, you're playing with house money.
Negotiation context
- It's been on market 37 days — a 3% lower offer ($95k) is reasonable based on typical stale-listing flexibility.
Risks & watch-outs
- Climate carrying-cost: moderate wildfire risk; extreme-heat days projected 7→15/yr by 2055 (HVAC capex compounding) — expect insurance premiums to compound above CPI over the hold.
Questions for the listing agent
- It's been on market 37 days. Have you received any prior offers? Is the seller open to a 3% concession, seller financing, or rate buy-down credit?
- Is there a deadline driving the sale (1031 exchange, divorce, estate, relocation)? That informs how much negotiation room exists.
- Schools are D-rated, which usually means shorter tenancies and higher turnover. Who's the typical renter profile here, and what's been the actual vacancy rate?
- What's the average days-on-market for RENTAL listings here right now (not sales)? A rising rental-DOM trend means longer vacancies and softer asking-rent achievability than the comps imply.
- What's the recent tenant-quality profile in this submarket — average credit score on applications, eviction rate, late-payment / NSF rate, and stable-employment percentage? A property-management company in the area should have these aggregated.
- How much new for-sale + rental construction is in the pipeline within 1–3 miles? Heavy new supply typically softens prices + rents 12–24 months out; constrained supply supports both.
Investment metrics
- 1% rule
- 2.18% ✓
- Cap rate
- 18.65%
- Cash-on-cash
- 44.13%
- DSCR
- 2.96
- GRM
- 3.8
CMA / ARV
- ARV (median comp)
- $63,450
- List price
- $97,900
- Delta
- 54.29%
- Verdict
- OVERPRICED
- Comps
- 10 within 2.0 mi
Show comp detail 3 sales within ~0.75 mi
| Address | Dist | Beds/Ba | Sqft | Sold | Price | $/sf | Match |
|---|---|---|---|---|---|---|---|
| 555 Moffat Blvd #47 | 0.00mi | 2/1.0 | 775 (0%) | 22mo | $95,000 | $123 | 82 |
| 555 Moffat Blvd #37 | 0.00mi | 2/1.0 | 728 (-6%) | 20mo | $85,000 | $117 | 74 |
| 555 Moffat Blvd #14 | 0.00mi | 3/2.0 (+1) | 860 (+11%) | 6mo | $105,100 | $122 | 68 |
Match score weights: distance 35% · size 25% · config 20% · recency 20%. Top-matched comps best support the ARV.
Projected returns pro-forma
-3.0% appreciation · 0.0% rent growth · sell at horizon
- IRR
- 37.7%
- Equity multiple
- 2.54×
- Total profit
- $42,124
- Equity at exit
- $14,597
- IRR
- 42.7%
- Equity multiple
- 4.48×
- Total profit
- $95,335
- Equity at exit
- $8,465
Cash invested: $27,412 (down + closing). Projections, not guarantees.
Landlord ↔ Tenant lean methodology
- Overall (STATE)
- 18 Strongly Tenant-Friendly
- State California
- 18 Strongly Tenant-Friendly · D+13
- County
- — inherits STATE
- City
- — inherits STATE
ZIP-level market 95336
- Rents YoY
- -0.7%
- Active inventory
- 273
- Price-to-rent
- 3.8×
Monthly cashflow live
- Estimated rent
- $2,132 high interval (Pro) →
- Mortgage (P&I)
- −$513
- Tax est. 1.5%
- −$122 /mo · $1,468/yr
- Insurance
- −$41
- HOA
- −$0
- Vacancy / Maint / Mgmt
- −$448
- Net cashflow
- $1,008
Break-even live
Sensitivity live
| Price | -10% $1,076 | -5% $1,042 | +0% $1,008 | +5% $974 | +10% $940 |
|---|---|---|---|---|---|
| Rent | -10% $840 | -5% $924 | +0% $1,008 | +5% $1,092 | +10% $1,177 |
| Rate | -1.0pp $1,057 | -0.5pp $1,033 | base $1,008 | +0.5pp $983 | +1.0pp $957 |
UW: 25.0% down · 7.5% · 30yr · 1.5% tax · 5.0% vac · 8.0% maint · 8.0% mgmt
Financing live
Cash to close
- Down payment
- $24,475
- Closing costs
- $2,937
- Reserves months
- —
- Total cash needed
- —
Loan-product check · same deal, 3 products live
Conventional
25% down · 7.5% · 30yr
- Down + closing
- —
- Monthly P&I
- —
- Monthly cashflow
- —
- DSCR
- —
- Eligible?
- —
Personal DTI + credit; lowest rate.
DSCR
20% down · 8.5% · 30yr
- Down + closing
- —
- Monthly P&I
- —
- Monthly cashflow
- —
- DSCR
- —
- Eligible?
- —
No personal income docs; deal must DSCR.
Hard money
10% down · 12.0% · 12mo
- Down + closing
- —
- Monthly P&I
- —
- Monthly cashflow
- —
- DSCR
- —
- Eligible?
- —
Short-term bridge; refi at stabilization.
Rent comps 30 comps
| Address | Beds | Baths | Sqft | Rent | $/sqft | DOM | Units | Dist |
|---|---|---|---|---|---|---|---|---|
| 134 Oak St Manteca, CA | 3.0 | 1.0 | 1007 | $3,045 | $3.02 | 46d | 1 | 0.42mi |
| 225 N Fremont St Manteca, CA | 2.0 | 2.0 | 926 | $1,875 | $2.02 | 46d | 1 | 0.53mi |
| 139 W Yosemite Ave Unit 1 Manteca, CA | 2.0 | 1.0 | 948 | $1,650 | $1.74 | 5d | 1 | 0.56mi |
| 430 Sutter St Manteca, CA | 2.0 | 1.0 | 804 | $1,922 | $2.39 | 5d | 3 | 0.72mi |
| 801 Atherton Dr Manteca, CA | 1.0–2.0 | 1.0–2.0 | 977 | $2,695 | $2.76 | 4d | 8 | 0.77mi |
| 311 Charles Ave Manteca, CA | 3.0 | 2.0 | 1092 | $2,750 | $2.52 | 25d | 1 | 0.83mi |
| 222 Elm Ave Unit B Manteca, CA | 2.0 | 1.0 | 750 | $1,700 | $2.27 | 21d | 1 | 0.88mi |
| 420 N Maple Ave Unit 13 Manteca, CA | 1.0 | 1.0 | 600 | $1,395 | $2.33 | 25d | 1 | 0.88mi |
| 1005 E Atherton Dr Manteca, CA | 1.0–3.0 | 1.0–2.0 | 1008 | $2,495 | $2.47 | 1d | 6 | 0.89mi |
| 529 N Lincoln Ave Manteca, CA | 2.0 | 1.0 | 734 | $1,900 | $2.59 | 46d | 1 | 0.95mi |
| 556 N Lincoln Ave Unit 32 Manteca, CA | 1.0 | 1.0 | 850 | $1,495 | $1.76 | 16d | 1 | 0.97mi |
| 556 N Lincoln Ave Unit 12 Manteca, CA | 1.0 | 1.0 | 600 | $1,400 | $2.33 | 46d | 1 | 0.97mi |
| 556 N Lincoln Ave Unit 15 Manteca, CA | 2.0 | 1.0 | 900 | $1,895 | $2.11 | 46d | 1 | 0.97mi |
| 809 Marion St Manteca, CA | 3.0 | 2.0 | 910 | $2,400 | $2.64 | 46d | 1 | 0.97mi |
| 218 W Alameda St Manteca, CA | 3.0 | 2.0 | 1000 | $2,450 | $2.45 | 13d | 1 | 0.97mi |
| 366 E Edison St Unit 12 Manteca, CA | 2.0 | 1.0 | 750 | $1,595 | $2.13 | 5d | 1 | 0.99mi |
| 832 Marion St Unit A Manteca, CA | 2.0 | 2.0 | 836 | $2,100 | $2.51 | 46d | 1 | 1.01mi |
| 1224 Schirra Ct Manteca, CA | 2.0 | 1.0 | 528 | $1,750 | $3.31 | 23d | 1 | 1.03mi |
| 1360 Lakeside Ave Manteca, CA | 1.0–3.0 | 1.0–2.0 | 1007 | $2,580 | $2.56 | 4d | 3 | 1.05mi |
| 221 E Edison St Unit 2 Manteca, CA | 1.0 | 1.0 | 600 | $1,475 | $2.46 | 5d | 1 | 1.06mi |
| 221 E Edison St Unit 8 Manteca, CA | 1.0 | 1.0 | 600 | $1,475 | $2.46 | 16d | 1 | 1.06mi |
| 717 W Atherton Dr Manteca, CA | 3.0 | 1.0–2.0 | 903 | $2,552 | $2.82 | 1d | 6 | 1.08mi |
| 200 Northwoods Ave Manteca, CA | 2.0 | 1.0 | 900 | $1,675 | $1.86 | 5d | 1 | 1.09mi |
| 794 Button Ave Manteca, CA | 1.0 | 1.0 | 625 | $1,900 | $3.04 | 5d | 1 | 1.35mi |
| 794 Button Ave Manteca, CA | 2.0 | 1.0 | 760 | $2,100 | $2.76 | 25d | 1 | 1.35mi |
| 794 Button Ave Manteca, CA | 2.0 | 2.0 | 1075 | $2,300 | $2.14 | 16d | 1 | 1.35mi |
| 1155 W Center St Manteca, CA | 1.0–2.0 | 1.0–1.5 | 770 | $2,249 | $2.92 | 5d | 11 | 1.43mi |
| 150 Pestana Ave Apt Home Manteca, CA | 1.0 | 1.0 | 700 | $2,250 | $3.21 | 46d | 1 | 1.43mi |
| 207 S Union Rd Manteca, CA | 1.0 | 1.0 | 600 | $1,745 | $2.91 | 12d | 1 | 1.43mi |
| 426 Cherry Ln Manteca, CA | 2.0 | 1.0 | 941 | $2,100 | $2.23 | 5d | 1 | 1.48mi |
Listing history 16 events
-
2026-06-21days on market $97,900 Active 37 DOM
-
2026-06-18days on market $97,900 Active 34 DOM
-
2026-06-17days on market $97,900 Active 33 DOM
-
2026-06-16days on market $97,900 Active 32 DOM
-
2026-06-15days on market $97,900 Active 31 DOM
-
2026-06-14days on market $97,900 Active 29 DOM
-
2026-06-13days on market $97,900 Active 28 DOM
-
2026-06-10days on market $97,900 Active 26 DOM
-
2026-06-09days on market $97,900 Active 25 DOM
-
2026-06-08days on market $97,900 Active 24 DOM
-
2026-06-07days on market $97,900 Active 23 DOM
-
2026-06-05days on market $97,900 Active 20 DOM
-
2026-06-03days on market $97,900 Active 19 DOM
-
2026-06-03days on market $97,900 Active 18 DOM
-
2026-06-01days on market $97,900 Active 17 DOM
-
2026-05-31days on market $97,900 Active 16 DOM
ⓘ Source: listings_history table (triggers on properties + properties_extension) + one-shot
backfill from property_details.listing_events for pre-trigger history.
Climate risk First Street
- Flood 1/10 Low FEMA zone X (unshaded) · 0% chance over 30 yrs
- Wildfire 5/10 Major
- Heat 7/10 Severe 7 d/yr ≥102°F today · 15 d/yr by 30 yrs out
- Wind 1/10 Low
- Air quality 10/10 Extreme 30 unhealthy d/yr today · 31 by 30 yrs out
Nearby sold comps map
Loading sold comps map…
Walkable amenities ~0.75 mi
Loading nearby amenities…
Taxation est. · year 1
- Rental income
- $25,590
- − Mortgage interest
- −$5,484
- − Property taxes
- −$1,468
- − Insurance
- −$490
- − Repairs & maintenance
- −$2,047
- − Management
- −$2,047
- − Depreciation
- −$2,848
- Taxable income
- $11,205
- Est. tax owed @ 24.0%
- −$2,689
- After-tax cash flow
- $9,408/yr
For passive investors: Depreciation is non-cash, so a rental often shows a tax loss while cash-flowing — sheltering income. Rental losses are passive: they offset passive income freely, and up to $25,000/yr can offset ordinary (W-2) income if you actively participate and your MAGI is under $100k (phasing out to $0 by $150k); unused losses carry forward. On sale, claimed depreciation is recaptured at up to 25%, and gains may owe capital-gains tax (a 1031 exchange can defer both). Figures are a year-1 estimate at your 24.0% rate — not tax advice; consult a CPA.
Condition & rehab AI · 12 photos
This fully remodeled 2-bedroom, 1-bathroom home in Manteca offers a modern and affordable living experience.
Value-add opportunities
- Both Paint exterior — Enhances curb appeal and value
- Both Replace window screens — Improves energy efficiency and aesthetics
- Both Install smart home devices — Enhances convenience and marketability
Renovation cost estimate screening
Value-add ROI direction
- Both Paint exterior — Enhances curb appeal and value ↑
- Both Replace window screens — Improves energy efficiency and aesthetics ↑
- Both Install smart home devices — Enhances convenience and marketability ↑
ⓘ Cost ranges are severity-bucket heuristics (US national rule-of-thumb). Get contractor quotes + a written scope before underwriting a rehab budget.
Schools (NCES district)
- District
- Manteca Unified
- NCES district ID
- 0623610
- Math proficiency
- 15% ▼ -14.00%
- Reading proficiency
- 48% ▬ 0.00%
- Median HH income
- $62,426
- Composite
- 28.5/100
- National rank
- #6737
- State rank
- #297 of 517 in CA
Livability — Manteca
- Score
- 61/100
- State rank
- #535
- US rank
- #17877
Category grades
Schools grade is shown separately in the Schools card above.
Census & demographics
- Census place
- Manteca, CA
- County
- San Joaquin County · 729,570 people
- City population
- 98,916
- Metro
- Stockton, CA
- Population (ZIP)
- 50,185
- Household income
- $89,172
- Rent vs Own
- Severe rent burden
- 876.0
Population outlook (San Joaquin County) Hauer SSP2
- Today (2025)
- 796,965 people
- By 2030
- 828,849 · +4.0%
- By 2040
- 885,611 · +11.1%
- By 2050
- 929,798 · +16.7%
- By 2075
- 994,578 · +24.8%
- By 2100
- 971,291 · +21.9%
Race, ethnicity, and origin ACS 2023
- Neighborhood character
- Diverse neighborhood (Simpson 0.63)
- Race & ethnicity
- Hispanic / Latino 43% White 42% Two or more races 18% Asian 7% Black 2%
- Hispanic origin (detail)
- Mexican 37%
- Common ancestry
- Russian 3% Lithuanian 2% Slovak 1%
- Foreign-born
- 17% · Canada
- Languages at home
- 69% English-only · Spanish 23% Other Asian/Pacific 3% Other Indo-European 2%
Political lean MEDSL · San Joaquin
- 2024 margin
- Toss-up / Even · D 48.0% · R 48.9% · Other 3.0%
- 2008→2024 swing
- -11.6pp toward R · 2008: 10.7pp · 2024: -0.9pp
- All cycles
- 2024: R+0.9 2020: D+13.9 2016: D+12.9 2012: D+8.9 2008: D+10.7
Not yet ingested
- Civics
- —
Market trends
- HPI YoY
- ▼ -407.05%
- Current HPI
- 268.5708
- Rent YoY
- ▼ -0.68%
- Metro
- Stockton, CA
- State GDP YoY
- ▲ 3.21%
- F500 in state
- 116
Industry mix (Fortune 500 HQ in CA)
| Industry | F500 HQs | Revenue |
|---|---|---|
| Technology | 27 | $1,492B |
|
||
| Financial Services | 3 | $174B |
|
||
| Retail | 3 | $44B |
|
||
| Insurance | 3 | $26B |
|
||
| Media / Entertainment | 2 | $115B |
|
||
| Pharmaceuticals / Biotech | 2 | $62B |
|
||
Cash-flow waterfall
monthlySold comps — $/sqft
last 12 mo · ≤1 miLoading sold comps…