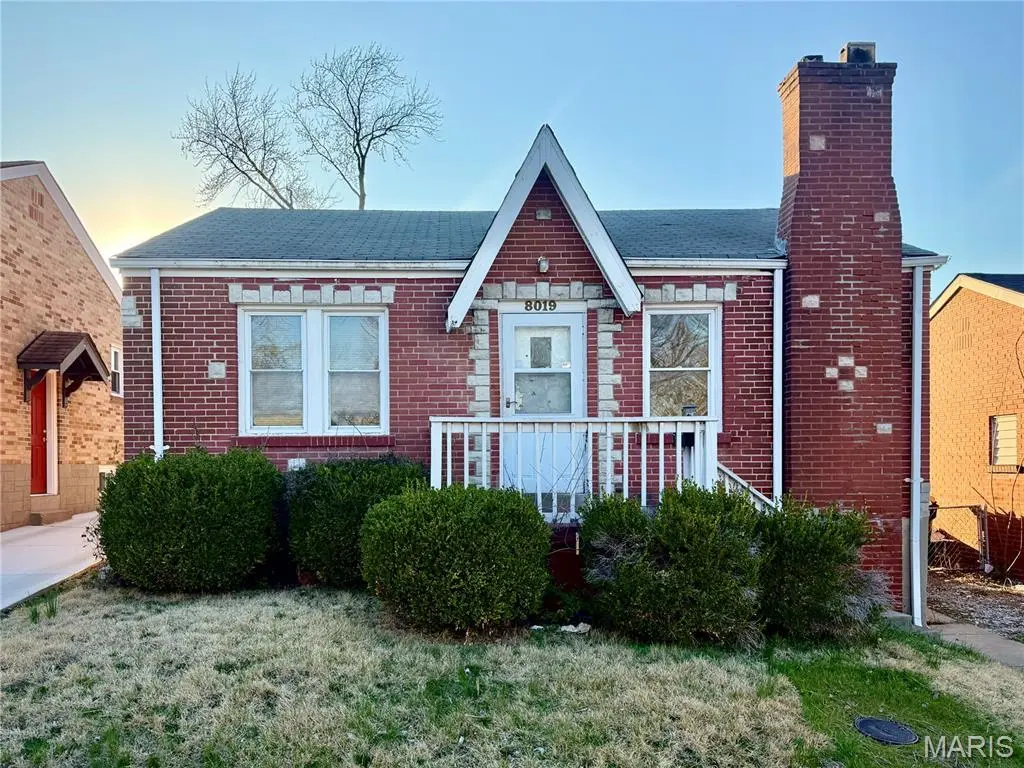
8019 Genesta St · Affton, MO
Flood risk 1/10 · Minimal
- FEMA flood zone
- X (unshaded)
- Chance of flooding over 30 yrs
- 0.0%
- Est. flood insurance / yr
- $473 – $860
Fire risk 1/10 · Minimal
- Est. fire insurance / yr
- $1,054 – $1,958
Heat risk 5/10 · Moderate
- Hot days now (above 107°F)
- 7 days/yr
- Hot days in 30 yrs
- 21 days/yr
Wind risk 2/10 · Minimal
- Chance of severe wind over 30 yrs
- 1.0%
Air-quality risk 3/10 · Minor
- Unhealthy air days now
- 3 days/yr
- Unhealthy air days in 30 yrs
- 4 days/yr
Risk factors via First Street. Map © Google.
Why this score? — see what drove the C- grade
The composite is a weighted blend of 9 inputs, each scored 0–100. Each bar is that input's sub-score; the figure is the points it added to the 100-point composite (weight × sub-score).
- Cash flow +17.4/30.0
- ARV discount +15.0/15.0
- DSCR +5.4/10.0
- 1% rule +4.8/10.0
- Livability +3.6/5.0
- Rent growth +3.3/5.0
- Schools +2.7/10.0
- Condition / age +2.5/5.0
- Appreciation +0.0/10.0
$120,000
🖨 Deal sheet 📄 Offer letter ✓ Due diligence
Listing remarks MLS
Investor opportunity in the Affton School District. This 2 bedroom, 1 bath full brick bungalow offers 783 sq ft above grade with a spacious living room, eat in kitchen, and classic masonry exterior featuring attractive stone work. The home also includes a full basement with potential for additional finished space and off street parking. This property is being sold as-is and a bit of sweat equity will make it your own. With the right vision and improvements, the upside is significant. Renovated homes in Affton School district of similar size within a mile have recently sold in the $190K to $230K range. Solid brick construction, a desirable South County location, and strong after-repair sales in the area create an appealing value-add opportunity for a flip, BRRR strategy, or long-term rental hold. Bring your contractor and your imagination.
Key facts
- Full brick bungalow
- Off street parking
- Full basement
Tags
Neighborhood map
What this means for you Summary
Snapshot
- This is a 1-bed/1.0-bath single-family listed at $120k.
Deal economics
- At list price, monthly cash flow is $90 ($1k/yr) — positive.
- The deal already cash-flows at list — no discount required.
- To meet the 1% rule (rent ≥ 1% of price), the offer needs to be $118k (1.7% below list).
- Recommended offer: $109k (9.0% below list) — sets the bar for market timing.
- Cap rate 7.2% vs local median 3.9% in Affton — top-decile yield for the area; either an underpriced asset or a hidden risk that comps aren't pricing in. Stress-test before assuming the spread holds.
Location & tenants
- Location reads 71/100 on livability (#121 in MO) — a middle-class / working-renter tenant base. Strengths: cost of living A+, housing A+, employment B+; Watch: crime C-, amenities F, commute F.
- Affton 101 (suburban): math 21% / reading 40% proficiency, ranked #258 of 324 in MO (top 80%) — families likely to look elsewhere, expect single-tenant / working-renter base with shorter leases.
- Market conditions: Rents rising (+3.0%/yr); 186 active listings in the ZIP; 30 comparable units currently listed for rent nearby; rentals at typical pace (median 14d on market — plan ~3-4 weeks tenant-placement turnaround); solid renter incomes; 920 units permitted in St. Louis County in 2024 (250 in 5+ unit buildings).
Forward outlook
- Local home prices are declining (-3.0%/yr); year-one equity from $830 of loan paydown is wiped out by about $4k of value loss. Plan a longer hold.
Negotiation context
- It's been on market 95 days — a 9% lower offer ($109k) is reasonable based on typical stale-listing flexibility.
- Current owner paid $42k; list at $120k implies a 186% gain — meaningful room to come down on a strong offer.
Risks & watch-outs
- Watch-outs: built in 1940 — expect roof / HVAC / electrical / plumbing capex.
- Climate carrying-cost: extreme-heat days projected 7→21/yr by 2055 (HVAC capex compounding) — expect insurance premiums to compound above CPI over the hold.
Questions for the listing agent
- It's been on market 95 days. Have you received any prior offers? Is the seller open to a 9% concession, seller financing, or rate buy-down credit?
- Built in 1940 — when were the roof, HVAC, electrical panel, plumbing, and water heater last replaced?
- Why hasn't it sold? Are there any deal-killer items the seller is aware of (foundation, flood, title, zoning, code violations)?
- Is there a deadline driving the sale (1031 exchange, divorce, estate, relocation)? That informs how much negotiation room exists.
- What's the average days-on-market for RENTAL listings here right now (not sales)? A rising rental-DOM trend means longer vacancies and softer asking-rent achievability than the comps imply.
- What's the recent tenant-quality profile in this submarket — average credit score on applications, eviction rate, late-payment / NSF rate, and stable-employment percentage? A property-management company in the area should have these aggregated.
- How much new for-sale + rental construction is in the pipeline within 1–3 miles? Heavy new supply typically softens prices + rents 12–24 months out; constrained supply supports both.
Investment metrics
- 1% rule
- 0.98% ✗
- Cap rate
- 7.19%
- Cash-on-cash
- 3.21%
- DSCR
- 1.14
- GRM
- 8.5
CMA / ARV
- ARV (median comp)
- $183,346
- List price
- $120,000
- Delta
- -34.55%
- Verdict
- UNDERPRICED
- Comps
- 20 within 1.0 mi
Show comp detail 12 sales within ~0.75 mi
| Address | Dist | Beds/Ba | Sqft | Sold | Price | $/sf | Match |
|---|---|---|---|---|---|---|---|
| 5237 Heege Rd | 0.18mi | 2/1.0 (+1) | 800 (+2%) | 1mo | $175,000 | $219 | 82 |
| 7816 Genesta St | 0.25mi | 2/1.0 (+1) | 788 (+1%) | 6mo | $169,900 | $216 | 78 |
| 5309 Staely Ave | 0.10mi | 2/1.0 (+1) | 826 (+6%) | 6mo | $129,900 | $157 | 76 |
| 8211 Mathilda Ave | 0.16mi | 2/1.0 (+1) | 748 (-4%) | 8mo | $197,000 | $263 | 74 |
| 7917 Menola St | 0.41mi | 2/1.0 (+1) | 816 (+4%) | 8mo | $184,900 | $227 | 62 |
| 7908 Fleta St | 0.18mi | 1/1.0 | 668 (-15%) | 7mo | $117,000 | $175 | 61 |
| 5311 Vine Ave | 0.17mi | 2/1.0 (+1) | 888 (+13%) | 8mo | $149,900 | $169 | 58 |
| 7616 Genesta St | 0.52mi | 1/1.0 | 672 (-14%) | 1mo | $139,000 | $207 | 51 |
| 8042 Mackenzie Rd | 0.54mi | 2/1.0 (+1) | 870 (+11%) | 1mo | $189,000 | $217 | 50 |
| 7610 Fleta St | 0.54mi | 2/2.0 (+1) | 840 (+7%) | 7mo | $219,999 | $262 | 48 |
| 6017 Maxwell Ave | 0.62mi | 2/1.0 (+1) | 864 (+10%) | 5mo | $215,000 | $249 | 45 |
| 8709 Neier Ln | 0.75mi | 2/1.0 (+1) | 864 (+10%) | 4mo | $169,999 | $197 | 39 |
Match score weights: distance 35% · size 25% · config 20% · recency 20%. Top-matched comps best support the ARV.
Projected returns pro-forma
-3.0% appreciation · 3.01% rent growth · sell at horizon
- IRR
- -11.2%
- Equity multiple
- 0.59×
- Total profit
- $-13,685
- Equity at exit
- $17,892
- IRR
- -1.9%
- Equity multiple
- 0.87×
- Total profit
- $-4,395
- Equity at exit
- $10,375
Cash invested: $33,600 (down + closing). Projections, not guarantees.
Landlord ↔ Tenant lean methodology
- Overall (STATE)
- 81 Strongly Landlord-Friendly
- State Missouri
- 81 Strongly Landlord-Friendly · R+10
- County
- — inherits STATE
- City
- — inherits STATE
ZIP-level market 63123
- Rents YoY
- 3.0%
- Active inventory
- 186
- Price-to-rent
- 8.5×
Monthly cashflow live
- Estimated rent
- $1,180 high interval (Pro) →
- Mortgage (P&I)
- −$629
- Tax from tax record
- −$163 /mo · $1,956/yr
- Insurance
- −$50
- HOA
- −$0
- Vacancy / Maint / Mgmt
- −$248
- Net cashflow
- $90
Break-even live
UW: 25.0% down · 7.5% · 30yr · 1.5% tax · 5.0% vac · 8.0% maint · 8.0% mgmt
Financing live
Cash to close
- Down payment
- $30,000
- Closing costs
- $3,600
- Reserves months
- —
- Total cash needed
- —
Loan-product check · same deal, 3 products live
Conventional
25% down · 7.5% · 30yr
- Down + closing
- —
- Monthly P&I
- —
- Monthly cashflow
- —
- DSCR
- —
- Eligible?
- —
Personal DTI + credit; lowest rate.
DSCR
20% down · 8.5% · 30yr
- Down + closing
- —
- Monthly P&I
- —
- Monthly cashflow
- —
- DSCR
- —
- Eligible?
- —
No personal income docs; deal must DSCR.
Hard money
10% down · 12.0% · 12mo
- Down + closing
- —
- Monthly P&I
- —
- Monthly cashflow
- —
- DSCR
- —
- Eligible?
- —
Short-term bridge; refi at stabilization.
Rent comps 30 comps
| Address | Beds | Baths | Sqft | Rent | $/sqft | DOM | Units | Dist |
|---|---|---|---|---|---|---|---|---|
| 7912 Olde English Rd St. Louis, MO | 1.0–2.0 | 1.0 | 750 | $895 | $1.19 | 2d | 2 | 0.31mi |
| 7529 Fleta St St. Louis, MO | 2.0 | 1.0–1.5 | 1173 | $1,612 | $1.37 | 10d | 10 | 0.60mi |
| 4831 Oldenburg Ave Affton, MO | 2.0 | 1.0 | 775 | $1,110 | $1.43 | 11d | 1 | 0.86mi |
| 9311 Sterling Pl Unit 9313 Affton, MO | 1.0 | 1.0 | 1000 | $1,100 | $1.10 | 23d | 1 | 0.88mi |
| 89 Willmore Rd Unit 89 Willmore Rd, 2N St. Louis, MO | 2.0 | 1.0 | 1103 | $1,350 | $1.22 | 23d | 1 | 0.89mi |
| 7201-7205 Gravois Rd Saint Louis, MO | 1.0 | 1.0 | 700 | $995 | $1.42 | 10d | 7 | 0.89mi |
| 7219 Hampton Ave Saint Louis, MO | 2.0 | 1.0 | 1000 | $1,195 | $1.20 | 43d | 1 | 0.91mi |
| 5825 Sunshine Dr Saint Louis, MO | 1.0 | 1.0 | 820 | $1,150 | $1.40 | 43d | 1 | 0.93mi |
| 5821 Sunshine Dr Saint Louis, MO | 1.0 | 1.0 | 700 | $925 | $1.32 | 43d | 1 | 0.94mi |
| 7055 Hampton Ave Unit 201 St. Louis, MO | 2.0 | 1.0 | 900 | $1,250 | $1.39 | 43d | 1 | 0.95mi |
| 7055 Hampton Ave Unit 102 St. Louis, MO | 1.0 | 1.0 | 750 | $1,095 | $1.46 | 43d | 1 | 0.95mi |
| 8530 Webshire Ln Unit 8566A Affton, MO | 1.0 | 1.0 | 760 | $895 | $1.18 | 43d | 1 | 1.04mi |
| 6727 Colony Acres Dr Unit 6727-B Colony Acres St. Louis, MO | 2.0 | 1.0 | 825 | $950 | $1.15 | 1d | 1 | 1.04mi |
| 7105 Circleview Dr Saint Louis, MO | 2.0 | 1.0 | 888 | $1,450 | $1.63 | 2d | 1 | 1.06mi |
| 5324 Nagel Ave Saint Louis, MO | 2.0 | 1.0 | 768 | $1,595 | $2.08 | 14d | 1 | 1.12mi |
| 4916 Robert Ave Unit 4916 St. Louis, MO | 1.0 | 1.0 | 850 | $1,100 | $1.29 | 4d | 1 | 1.21mi |
| 4916 Robert Ave Unit 4918-A St. Louis, MO | 2.0 | 1.0 | 850 | $1,200 | $1.41 | 2d | 1 | 1.21mi |
| 7594 Watson Rd Saint Louis, MO | 1.0 | 1.0 | 650 | $825 | $1.27 | 23d | 1 | 1.29mi |
| 6926 Mackenzie Rd Saint Louis, MO | 2.0 | 1.0 | 1026 | $1,025 | $1.00 | 2d | 1 | 1.30mi |
| 6960 Creekview Trl St. Louis, MO | 1.0–2.0 | 1.0 | 660 | $865 | $1.31 | 1d | 33 | 1.31mi |
| 9551 Cantwell Dr Saint Louis, MO | 2.0 | 1.0 | 1090 | $1,750 | $1.61 | 14d | 1 | 1.35mi |
| 6406 Woodbine Ct Saint Louis, MO | 2.0 | 2.0 | 1085 | $1,800 | $1.66 | 15d | 1 | 1.36mi |
| 5301 Jamieson Ave Unit C St. Louis, MO | 1.0 | 1.0 | 900 | $1,025 | $1.14 | 4d | 1 | 1.40mi |
| 7028 Heege Rd St. Louis, MO | 1.0–2.0 | 1.0 | 650 | $845 | $1.30 | 2d | 2 | 1.40mi |
| 4933 Loughborough Ave Saint Louis, MO | 2.0 | 1.0 | 945 | $1,550 | $1.64 | 1d | 1 | 1.43mi |
| 5448 Lisette Ave Saint Louis, MO | 2.0 | 2.0 | 1059 | $2,100 | $1.98 | 1d | 1 | 1.44mi |
| 6227 Eichelberger St Unit A St. Louis, MO | 1.0 | 1.0 | 780 | $1,050 | $1.35 | 21d | 1 | 1.45mi |
| 9196 Heritage Dr Affton, MO | 1.0–2.0 | 1.0 | 757 | $1,190 | $1.57 | 4d | 8 | 1.46mi |
| 9962 Chateau Roi Dr Affton, MO | 1.0 | 1.0 | 800 | $899 | $1.12 | 17d | 1 | 1.50mi |
| 5533 Holly Hills Ave Unit 1 St. Louis, MO | 1.0 | 1.0 | 975 | $1,350 | $1.38 | 23d | 1 | 1.50mi |
Listing history 18 events
-
2026-06-18price $120,000 Active 95 DOM
-
2026-06-18days on market $130,000 Active 95 DOM
-
2026-06-17days on market $130,000 Active 94 DOM
-
2026-06-16days on market $130,000 Active 93 DOM
-
2026-06-15days on market $130,000 Active 92 DOM
-
2026-06-13days on market $130,000 Active 90 DOM
-
2026-06-13days on market $130,000 Active 89 DOM
-
2026-06-09days on market $130,000 Active 86 DOM
-
2026-06-08days on market $130,000 Active 85 DOM
-
2026-06-07days on market $130,000 Active 84 DOM
-
2026-06-05days on market $130,000 Active 81 DOM
-
2026-06-03days on market $130,000 Active 80 DOM
-
2026-06-02days on market $130,000 Active 79 DOM
-
2026-06-01days on market $130,000 Active 78 DOM
-
2026-05-31days on market $130,000 Active 77 DOM
-
2026-03-15$130,000 Active 850-char remark
Show marketing remark (850 chars)
Investor opportunity in the Affton School District. This 2 bedroom, 1 bath full brick bungalow offers 783 sq ft above grade with a spacious living room, eat in kitchen, and classic masonry exterior featuring attractive stone work. The home also includes a full basement with potential for additional finished space and off street parking. This property is being sold as-is and a bit of sweat equity will make it your own. With the right vision and improvements, the upside is significant. Renovated homes in Affton School district of similar size within a mile have recently sold in the $190K to $230K range. Solid brick construction, a desirable South County location, and strong after-repair sales in the area create an appealing value-add opportunity for a flip, BRRR strategy, or long-term rental hold. Bring your contractor and your imagination.
-
1996-07-31soldstatus $42,000
-
1996-03-05soldstatus
ⓘ Source: listings_history table (triggers on properties + properties_extension) + one-shot
backfill from property_details.listing_events for pre-trigger history.
Tax reassessment forecast MO · Resets to sale price
- Current annual tax
- $1,956 · $163/mo
- Projected year-2 tax
- $1,956 · $163/mo
- Expected delta
- $0/yr ($0/mo · 0.0%)
ⓘ Screening estimate from a state-policy table — verify with the county assessor before closing.
Climate risk First Street
- Flood 1/10 Low FEMA zone X (unshaded) · 0% chance over 30 yrs
- Wildfire 1/10 Low
- Heat 5/10 Major 7 d/yr ≥107°F today · 21 d/yr by 30 yrs out
- Wind 2/10 Low 100% chance of damaging wind over 30 yrs
- Air quality 3/10 Moderate 3 unhealthy d/yr today · 4 by 30 yrs out
Nearby sold comps map
Loading sold comps map…
Walkable amenities ~0.75 mi
Loading nearby amenities…
Taxation est. · year 1
- Rental income
- $14,160
- − Mortgage interest
- −$6,722
- − Property taxes
- −$1,956
- − Insurance
- −$600
- − Repairs & maintenance
- −$1,133
- − Management
- −$1,133
- − Depreciation
- −$3,491
- Taxable loss
- −$875
- Est. tax savings @ 24.0%
- +$210
- After-tax cash flow
- $1,288/yr
For passive investors: Depreciation is non-cash, so a rental often shows a tax loss while cash-flowing — sheltering income. Rental losses are passive: they offset passive income freely, and up to $25,000/yr can offset ordinary (W-2) income if you actively participate and your MAGI is under $100k (phasing out to $0 by $150k); unused losses carry forward. On sale, claimed depreciation is recaptured at up to 25%, and gains may owe capital-gains tax (a 1031 exchange can defer both). Figures are a year-1 estimate at your 24.0% rate — not tax advice; consult a CPA.
Schools (NCES district)
- District
- Affton 101
- NCES district ID
- 2902910
- Math proficiency
- 21% ▼ -18.00%
- Reading proficiency
- 40% ▼ -7.00%
- Median HH income
- $51,274
- Composite
- 26.67/100
- National rank
- #7165
- State rank
- #258 of 324 in MO
Livability — Affton
- Score
- 71/100
- State rank
- #121
- US rank
- #7312
Category grades
Schools grade is shown separately in the Schools card above.
Census & demographics
- Census place
- Affton, MO
- County
- Saint Louis County · 888,823 people
- City population
- 49,077
- Metro
- St. Louis, MO-IL
- Population (ZIP)
- 49,077
- Household income
- $77,055
- Rent vs Own
- Severe rent burden
- 753.0
Population outlook (St. Louis County) Hauer SSP2
- Today (2025)
- 1,025,227 people
- By 2030
- 1,028,023 · +0.3%
- By 2040
- 1,020,940 · -0.4%
- By 2050
- 1,007,280 · -1.8%
- By 2075
- 987,277 · -3.7%
- By 2100
- 921,984 · -10.1%
Race, ethnicity, and origin ACS 2023
- Neighborhood character
- Predominantly White (82%)
- Race & ethnicity
- White 82% Two or more races 7% Asian 5% Hispanic / Latino 5% Black 3%
- Common ancestry
- American 5% Lithuanian 3% Romanian 2%
- Foreign-born
- 13% · Vietnam, Canada
- Languages at home
- 83% English-only · Russian/Polish/Slavic 6% Spanish 3% Other Indo-European 3%
Political lean MEDSL · St. Louis
- 2024 margin
- Strong D (+23.4) · D 60.8% · R 37.4% · Other 1.7%
- 2008→2024 swing
- +3.5pp toward D · 2008: 19.9pp · 2024: 23.4pp
- All cycles
- 2024: D+23.4 2020: D+24.0 2016: D+16.2 2012: D+13.7 2008: D+19.9
Not yet ingested
- Civics
- —
Market trends
- HPI YoY
- ▼ -229.90%
- Current HPI
- 220.258
- Rent YoY
- ▲ 3.01%
- Metro
- St. Louis, MO-IL
- State GDP YoY
- ▲ 1.84%
- F500 in state
- 20
Industry mix (Fortune 500 HQ in MO)
| Industry | F500 HQs | Revenue |
|---|---|---|
| Healthcare | 1 | $163B |
|
||
| Insurance | 1 | $21B |
|
||
| Industrial Technology | 1 | $17B |
|
||
| Retail | 1 | $16B |
|
||
| Industrial Distribution | 1 | $10B |
|
||
| Utilities | 1 | $9B |
|
||
Price history
+209.5% since first listed3 events — show timeline
- 2026-03-15 Listed $130,000 MARIS as Distributed by MLS Grid
- 1996-07-31 Sold (Public Records) $42,000 Public Records
- 1996-03-05 Sold (Public Records) — Public Records
Property tax history
+6.8%/yrLatest (2022): $1,956 · +2.4% YoY. Source: county tax records.
Cash-flow waterfall
monthlySold comps — $/sqft
last 12 mo · ≤1 miLoading sold comps…