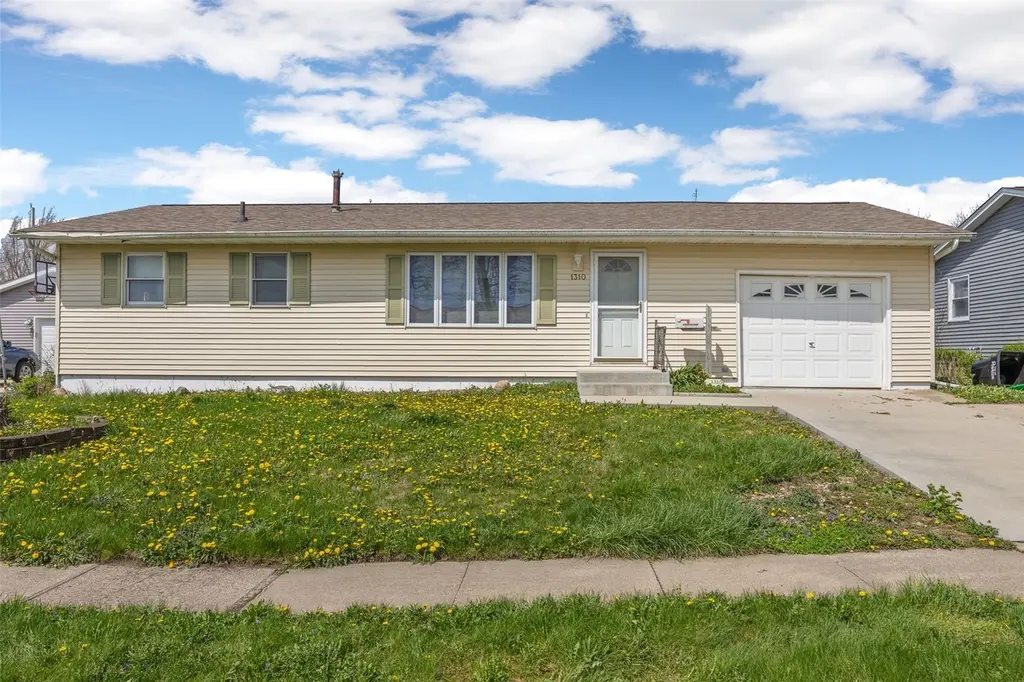
1310 G Ave · Marion, IA
Flood risk 1/10 · Minimal
- FEMA flood zone
- X (unshaded)
- Chance of flooding over 30 yrs
- 0.0%
- Est. flood insurance / yr
- $473 – $860
Fire risk 3/10 · Minor
- Est. fire insurance / yr
- $902 – $1,676
Heat risk 3/10 · Minor
- Hot days now (above 103°F)
- 7 days/yr
- Hot days in 30 yrs
- 15 days/yr
Wind risk 2/10 · Minimal
- Chance of severe wind over 30 yrs
- —
Air-quality risk 2/10 · Minimal
- Unhealthy air days now
- 1 days/yr
- Unhealthy air days in 30 yrs
- 2 days/yr
Risk factors via First Street. Map © Google.
Why this score? — see what drove the B+ grade
The composite is a weighted blend of 9 inputs, each scored 0–100. Each bar is that input's sub-score; the figure is the points it added to the 100-point composite (weight × sub-score).
- Cash flow +26.6/30.0
- ARV discount +15.0/15.0
- DSCR +9.1/10.0
- 1% rule +7.3/10.0
- Schools +5.8/10.0
- Rent growth +4.6/5.0
- Livability +4.2/5.0
- Condition / age +2.5/5.0
- Appreciation +0.0/10.0
$155,000
🖨 Deal sheet (PDF) 📄 Offer letter ✓ Due diligence
Listing remarks
Great opportunity in Marion!! This 3-bedroom home with an additional nonconforming bedroom in the lower level offers outstanding potential for investors, flippers, or buyers looking to build equity. Featuring 1.5 baths, a 1-car attached garage, and a functional layout, this property provides a sold foundation to make it your own. Conveniently located near local schools, parks, and all the Uptown Marion amenities, the location adds even more value. Available for immediate possession, this estate property is being sold as-is and is ready for its next chapter. Bring your vision and unlock the possibilities! This property currently has an ACCEPTED OFFER and is still showing for back up offers.
Key facts
- 8,843 sq ft lot
- Garage
- Built 1964
Property features AI
Exterior
- Parking: Garage (1 car)
- Utilities: Public water; Public sewer
- Home design: Single family residence; Residential property type
- Construction: Frame construction; Vinyl siding
- Exterior features: Fenced yard
Interior
- Kitchen: Range; Microwave
- Bedrooms: Total of 5 rooms (bedroom count not specified)
- Bathrooms: 1 full bathroom; 1 half bathroom
- Heating & cooling: Natural gas heating; Forced air heating; Central air conditioning
- Interior features: Disposal; Water softener (owned); Gas water heater
- Laundry & utility: Dryer
Neighborhood map
What this means for you Summary
Snapshot
- This is a 4-bed/1.0-bath single-family listed at $155k.
Deal economics
- At list price, monthly cash flow is $414 ($5k/yr) — positive.
- The deal already cash-flows at list — no discount required.
- Meets the 1% rule at list price ($2k rent vs $155k).
- Recommended offer: $150k (3.0% below list) — sets the bar for market timing.
- Cap rate 9.5% vs local median 2.8% in Marion — top-decile yield for the area; either an underpriced asset or a hidden risk that comps aren't pricing in. Stress-test before assuming the spread holds.
Location & tenants
- Location reads 84/100 on livability (#19 in IA, #633 nationally) — a professional / high-income tenant draw. Strengths: crime A+, cost of living A+, housing A+; Watch: amenities D-, commute F.
- Marion Independent School District (suburban): math 68% / reading 70% proficiency, ranked #158 of 289 in IA (top 55%) — acceptable for families but not a draw, mixed tenant base, ~2y average lease.
- Zoned schools: Francis Marion Intermediate School (math 72% / reading 63%, grade B+, #270 of 616 statewide, top 44%, 269 students, 45% FRL); Vernon Middle School (math 66% / reading 65%, grade A-, #153 of 246 statewide, top 62%, 668 students, 40% FRL); Marion High School (math 69% / reading 80%, grade B+, #89 of 336 statewide, top 30%, 722 students, 28% FRL).
- Market conditions: Rents rising fast (+8.4%/yr); 461 active listings in the ZIP; 2 comparable units currently listed for rent nearby; solid renter incomes; 1,023 units permitted in Linn County in 2024 (456 in 5+ unit buildings).
Forward outlook
- Local home prices are declining (-3.0%/yr); year-one equity from $1k of loan paydown is wiped out by about $5k of value loss. Plan a longer hold.
- Linn County population projected at +16% by 2050 — long-run rental-demand tailwind backs the buy-and-hold thesis.
- At projected returns (-3.0% appreciation + 8.0% rent growth), your $43k cash investment doubles in ~7 years — after that, you're playing with house money.
Negotiation context
- It's been on market 49 days — a 3% lower offer ($150k) is reasonable based on typical stale-listing flexibility.
- Current owner paid $18k; list at $155k implies a 749% gain — meaningful room to come down on a strong offer.
Questions for the listing agent
- It's been on market 49 days. Have you received any prior offers? Is the seller open to a 3% concession, seller financing, or rate buy-down credit?
- Built in 1964 — when were the roof, HVAC, electrical panel, plumbing, and water heater last replaced?
- Is there a deadline driving the sale (1031 exchange, divorce, estate, relocation)? That informs how much negotiation room exists.
- Schools are A-rated — typically a magnet for longer-tenancy family renters. What's the average tenant stay here, and is there a school-zone premium baked into asking?
- What's the average days-on-market for RENTAL listings here right now (not sales)? A rising rental-DOM trend means longer vacancies and softer asking-rent achievability than the comps imply.
- What's the recent tenant-quality profile in this submarket — average credit score on applications, eviction rate, late-payment / NSF rate, and stable-employment percentage? A property-management company in the area should have these aggregated.
- How much new for-sale + rental construction is in the pipeline within 1–3 miles? Heavy new supply typically softens prices + rents 12–24 months out; constrained supply supports both.
Investment metrics
- 1% rule
- 1.23% ✓
- Cap rate
- 9.50%
- Cash-on-cash
- 11.44%
- DSCR
- 1.51
- GRM
- 6.8
CMA / ARV
- ARV (median comp)
- $207,650
- List price
- $155,000
- Delta
- -25.36%
- Verdict
- UNDERPRICED
- Comps
- 20 within 1.0 mi
Show comp detail 12 sales within ~0.75 mi
| Address | Dist | Beds/Ba | Sqft | Sold | Price | $/sf | Match |
|---|---|---|---|---|---|---|---|
| 1785 Valleyview Dr | 0.23mi | 4/2.0 | 1,740 (+2%) | 7mo | $247,000 | $142 | 76 |
| 1155 A Ave | 0.30mi | 3/2.0 (-1) | 1,675 (-1%) | 3mo | $240,000 | $143 | 73 |
| 990 S 5th St | 0.48mi | 4/2.0 | 1,660 (-2%) | 3mo | $221,000 | $133 | 67 |
| 825 Westview Dr | 0.29mi | 4/2.0 | 1,594 (-6%) | 6mo | $218,000 | $137 | 67 |
| 1620 Hillcrest Ct | 0.43mi | 4/2.0 | 1,795 (+6%) | 5mo | $315,000 | $175 | 63 |
| 1105 S 15th St | 0.27mi | 4/2.0 | 1,530 (-10%) | 7mo | $212,000 | $139 | 62 |
| 1500 Pleasantview Dr | 0.35mi | 5/2.0 (+1) | 1,809 (+6%) | 4mo | $256,500 | $142 | 60 |
| 180 21st St | 0.54mi | 4/1.5 | 1,577 (-7%) | 2mo | $217,000 | $138 | 59 |
| 2365 Hillview Dr | 0.45mi | 4/2.5 | 1,870 (+10%) | 5mo | $260,000 | $139 | 52 |
| 190 26th Street Ct | 0.72mi | 4/2.0 | 1,562 (-8%) | 6mo | $237,500 | $152 | 44 |
| 2610 Bullis Dr | 0.59mi | 3/2.0 (-1) | 1,533 (-10%) | 6mo | $239,336 | $156 | 42 |
| 1405 5th Ave | 0.64mi | 3/2.0 (-1) | 1,455 (-14%) | 2mo | $80,000 | $55 | 36 |
Match score weights: distance 35% · size 25% · config 20% · recency 20%. Top-matched comps best support the ARV.
Projected returns pro-forma
-3.0% appreciation · 8.0% rent growth · sell at horizon
- IRR
- 6.4%
- Equity multiple
- 1.26×
- Total profit
- $11,367
- Equity at exit
- $23,111
- IRR
- 19.8%
- Equity multiple
- 3.07×
- Total profit
- $89,927
- Equity at exit
- $13,402
Cash invested: $43,400 (down + closing). Projections, not guarantees.
Landlord ↔ Tenant lean methodology
- Overall (STATE)
- 83 Strongly Landlord-Friendly
- State Iowa
- 83 Strongly Landlord-Friendly · R+6
- County
- — inherits STATE
- City
- — inherits STATE
ZIP-level market 52302
- Rents YoY
- 8.4%
- Active inventory
- 461
- Price-to-rent
- 6.8×
Monthly cashflow live
- Estimated rent
- $1,909 medium interval (Pro) →
- Mortgage (P&I)
- −$813
- Tax from tax record
- −$217 /mo · $2,606/yr
- Insurance
- −$65
- HOA
- −$0
- Lot rent
- −$0
- Vacancy / Maint / Mgmt
- −$401
- Net cashflow
- $414
Break-even live
Sensitivity live
| Price | -10% $501 | -5% $458 | +0% $414 | +5% $370 | +10% $326 |
|---|---|---|---|---|---|
| Rent | -10% $263 | -5% $338 | +0% $414 | +5% $489 | +10% $565 |
| Rate | -1.0pp $492 | -0.5pp $453 | base $414 | +0.5pp $374 | +1.0pp $333 |
UW: 25.0% down · 7.5% · 30yr · 1.5% tax · 5.0% vac · 8.0% maint · 8.0% mgmt
Financing live
Cash to close
- Down payment
- $38,750
- Closing costs
- $4,650
- Reserves months
- —
- Total cash needed
- —
Loan-product check · same deal, 3 products live
Conventional
25% down · 7.5% · 30yr
- Down + closing
- —
- Monthly P&I
- —
- Monthly cashflow
- —
- DSCR
- —
- Eligible?
- —
Personal DTI + credit; lowest rate.
DSCR
20% down · 8.5% · 30yr
- Down + closing
- —
- Monthly P&I
- —
- Monthly cashflow
- —
- DSCR
- —
- Eligible?
- —
No personal income docs; deal must DSCR.
Hard money
10% down · 12.0% · 12mo
- Down + closing
- —
- Monthly P&I
- —
- Monthly cashflow
- —
- DSCR
- —
- Eligible?
- —
Short-term bridge; refi at stabilization.
Rent comps 2 comps
| Address | Beds | Baths | Sqft | Rent | $/sqft | DOM | Units | Dist |
|---|---|---|---|---|---|---|---|---|
| 3040 3rd Ave Marion, IA | 3.0 | 2.0 | 1500 | $1,450 | $0.97 | 23d | 1 | 1.01mi |
| 1330 Brockman Ave Marion, IA | 4.0 | 2.0 | 1590 | $2,400 | $1.51 | 15d | 1 | 1.41mi |
Listing history 15 events
-
2026-06-15status $155,000 Pending 49 DOM
-
2026-06-15days on market $155,000 Active 49 DOM
-
2026-06-14days on market $155,000 Active 47 DOM
-
2026-06-13days on market $155,000 Active 46 DOM
-
2026-06-10days on market $155,000 Active 44 DOM
-
2026-06-09days on market $155,000 Active 43 DOM
-
2026-06-08days on market $155,000 Active 42 DOM
-
2026-06-07days on market $155,000 Active 41 DOM
-
2026-06-03days on market $155,000 Active 37 DOM
-
2026-06-02days on market $155,000 Active 36 DOM
-
2026-06-01days on market $155,000 Active 35 DOM
-
2026-05-31days on market $155,000 Active 34 DOM
-
2026-05-30days on market $155,000 Active 33 DOM
-
2026-04-27$155,000 Active 699-char remark
-
1972-07-24soldstatus $18,250
ⓘ Source: listings_history table (triggers on properties + properties_extension) + one-shot
backfill from property_details.listing_events for pre-trigger history.
Tax reassessment forecast IA · Partial reset (capped growth)
- Current annual tax
- $2,606 · $217/mo
- Projected year-2 tax
- $2,606 · $217/mo
- Expected delta
- $0/yr ($0/mo · 0.0%)
ⓘ Screening estimate from a state-policy table — verify with the county assessor before closing.
Climate risk First Street
- Flood 1/10 Low FEMA zone X (unshaded) · 0% chance over 30 yrs
- Wildfire 3/10 Moderate
- Heat 3/10 Moderate 7 d/yr ≥103°F today · 15 d/yr by 30 yrs out
- Wind 2/10 Low
- Air quality 2/10 Low 1 unhealthy d/yr today · 2 by 30 yrs out
Nearby sold comps map
Loading sold comps map…
Walkable amenities ~0.75 mi
Loading nearby amenities…
Taxation est. · year 1
- Rental income
- $22,911
- − Mortgage interest
- −$8,682
- − Property taxes
- −$2,606
- − Insurance
- −$775
- − Repairs & maintenance
- −$1,833
- − Management
- −$1,833
- − Depreciation
- −$4,509
- Taxable income
- $2,673
- Est. tax owed @ 24.0%
- −$641
- After-tax cash flow
- $4,323/yr
For passive investors: Depreciation is non-cash, so a rental often shows a tax loss while cash-flowing — sheltering income. Rental losses are passive: they offset passive income freely, and up to $25,000/yr can offset ordinary (W-2) income if you actively participate and your MAGI is under $100k (phasing out to $0 by $150k); unused losses carry forward. On sale, claimed depreciation is recaptured at up to 25%, and gains may owe capital-gains tax (a 1031 exchange can defer both). Figures are a year-1 estimate at your 24.0% rate — not tax advice; consult a CPA.
Schools (NCES district)
- District
- Marion Independent School District
- NCES district ID
- 1918690
- Math proficiency
- 68% ▼ -6.00%
- Reading proficiency
- 70% ▲ 2.00%
- Median HH income
- $49,541
- Composite
- 58.49/100
- National rank
- #997
- State rank
- #158 of 289 in IA
Livability — Marion
- Score
- 84/100
- State rank
- #19
- US rank
- #633
Category grades
Schools grade is shown separately in the Schools card above.
Census & demographics
- Census place
- Marion, IA
- County
- Linn County · 179,860 people
- City population
- 42,706
- Metro
- Cedar Rapids, IA
- Population (ZIP)
- 42,706
- Household income
- $87,983
- Rent vs Own
- Severe rent burden
- 940.0
Population outlook (Linn County) Hauer SSP2
- Today (2025)
- 239,589 people
- By 2030
- 248,587 · +3.8%
- By 2040
- 264,817 · +10.5%
- By 2050
- 278,685 · +16.3%
- By 2075
- 311,754 · +30.1%
- By 2100
- 336,773 · +40.6%
Race, ethnicity, and origin ACS 2023
- Neighborhood character
- Predominantly White (89%)
- Race & ethnicity
- White 89% Two or more races 4% Hispanic / Latino 3% Black 3% Asian 2%
- Common ancestry
- Portuguese 6% Iranian 3% Slovak 2%
- Foreign-born
- 3% · Canada
- Languages at home
- 96% English-only · Spanish 1% Other Indo-European 1%
Political lean MEDSL · Linn
- 2024 margin
- Lean D (+9.9) · D 54.2% · R 44.3% · Other 1.4%
- 2008→2024 swing
- -11.6pp toward R · 2008: 21.5pp · 2024: 9.9pp
- All cycles
- 2024: D+9.9 2020: D+13.7 2016: D+9.0 2012: D+17.6 2008: D+21.5
Not yet ingested
- Civics
- —
Market trends
- HPI YoY
- ▼ -144.98%
- Current HPI
- 199.2949
- Rent YoY
- ▲ 8.37%
- Metro
- Cedar Rapids, IA
- State GDP YoY
- ▲ 2.48%
- F500 in state
- 4
Industry mix (Fortune 500 HQ in IA)
| Industry | F500 HQs | Revenue |
|---|---|---|
| Financial Services | 1 | $16B |
|
||
| Retail / Convenience | 1 | $15B |
|
||
Price history
+749.3% since first listed3 events — show timeline
- 2026-06-15 Pending — CRAAR, CDRMLS
- 2026-04-27 Listed $155,000 CRAAR, CDRMLS
- 1972-07-24 Sold (Public Records) $18,250 Public Records
Property tax history
+1.8%/yrLatest (2025): $2,606 · -1.7% YoY. Source: county tax records.
Cash-flow waterfall
monthlySold comps — $/sqft
last 12 mo · ≤1 miLoading sold comps…