615 Lexington Ave · Dayton, OH
Flood risk 1/10 · Minimal
- FEMA flood zone
- X (unshaded)
- Chance of flooding over 30 yrs
- 0.0%
- Est. flood insurance / yr
- $473 – $860
Fire risk 1/10 · Minimal
- Est. fire insurance / yr
- $713 – $1,323
Heat risk 3/10 · Minor
- Hot days now (above 102°F)
- 7 days/yr
- Hot days in 30 yrs
- 18 days/yr
Wind risk 2/10 · Minimal
- Chance of severe wind over 30 yrs
- 0.0%
Air-quality risk 3/10 · Minor
- Unhealthy air days now
- 2 days/yr
- Unhealthy air days in 30 yrs
- 4 days/yr
Risk factors via First Street. Map © Google.
Why this score? — see what drove the D grade
The composite is a weighted blend of 9 inputs, each scored 0–100. Each bar is that input's sub-score; the figure is the points it added to the 100-point composite (weight × sub-score).
- Cash flow +15.0/30.0
- ARV discount +7.5/15.0
- 1% rule +5.0/10.0
- DSCR +5.0/10.0
- Rent growth +3.5/5.0
- Livability +3.2/5.0
- Condition / age +2.5/5.0
- Schools +1.3/10.0
- Appreciation +0.0/10.0
$18,500
🖨 Deal sheet (PDF) 📄 Offer letter ✓ Due diligence
Listing remarks
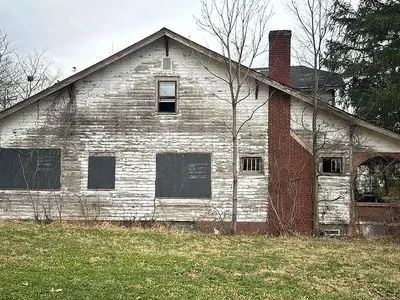
* * Investor Special & acirc; & euro; & ldquo; Prime Fixer-Upper with Incredible Potential! * * * * For Sale By Owner. * * Calling all investors, contractors, and savvy buyers looking for their next project! This 4-bedroom, 2-bath home offers * * 1,904 sq ft of living space * * on a * * 4,800 sq ft lot * * and is ready for a full renovation to unlock its true value. This property is a true * * gut-to-the-studs opportunity * * , perfect for a complete transformation. With no known foundation issues, the structure provides a solid starting point for your vision. The home will require a * * new roof, new windows, and a full interior renovation * * , making it
Key facts
- Unfinished basement
- New roof
- New windows
Tags
Property features AI
Exterior
- Home design: Built in 1909; Two-story (living area spans multiple levels)
- Construction: Historic construction from 1909
- Exterior features: Located in the Southern Dayton View subdivision
Neighborhood map
What this means for you Summary
Snapshot
- This is a 3-bed/2.0-bath single-family listed at $18k.
Deal economics
- At list price, monthly cash flow is $888 ($11k/yr) — positive.
- The deal already cash-flows at list — no discount required.
- Meets the 1% rule at list price ($1k rent vs $18k).
- Cap rate 63.9% vs local median 7.3% in Dayton — top-decile yield for the area; either an underpriced asset or a hidden risk that comps aren't pricing in. Stress-test before assuming the spread holds.
Location & tenants
- Location reads 65/100 on livability (#716 in OH) — a middle-class / working-renter tenant base. Strengths: cost of living A+, housing A+, health & safety A; Watch: amenities C-, crime F, commute F.
- Dayton City (urban): math 12% / reading 21% proficiency, ranked #641 of 656 in OH (top 98%) — low school quality limits family demand, transient renter base, plan for 1-2y turnover; 74% free/reduced lunch — lower-income household profile, screen leases tightly.
- Zoned schools: River'S Edge Montessori Elementary School (math 22% / reading 32%, grade F, #1,193 of 1,584 statewide, top 76%, 494 students, 0% FRL); Wogaman Middle School (math 8% / reading 12%, grade F, #645 of 654 statewide, top 99%, 364 students, 0% FRL); Belmont High School (math 5% / reading 20%, grade F, #720 of 781 statewide, top 93%, 1,100 students, 0% FRL) — zoned schools average 0% FRL vs 74% district-wide (74 pts lower); this property's tenant base skews higher-income than the district average.
- Market conditions: Rents rising (+4.0%/yr); 87 active listings in the ZIP; 40 comparable units currently listed for rent nearby; rentals lingering (median 46d on market — plan ~5-8 weeks vacancy on turnover, expect pricing pressure); 52% of comp listings sitting > 30 days — soft ceiling on asking rent; 907 units permitted in Montgomery County in 2024 (416 in 5+ unit buildings).
- This rent runs 32% of the median local income ($48k/yr) — at the standard rent-burdened threshold; future hikes will face affordability resistance.
Forward outlook
- Local home prices are declining (-3.0%/yr); year-one equity from $128 of loan paydown is wiped out by about $555 of value loss. Plan a longer hold.
- Montgomery County population projected at -10% by 2050 — secular population decline; favor cash flow + early exit over multi-decade hold.
- At projected returns (-3.0% appreciation + 4.0% rent growth), your $5k cash investment doubles in ~1 year — after that, you're playing with house money.
Negotiation context
- Only 6 days on market — expect competitive offers; lowballing is unlikely to land.
Risks & watch-outs
- Watch-outs: built in 1909 — expect roof / HVAC / electrical / plumbing capex.
Questions for the listing agent
- Built in 1909 — when were the roof, HVAC, electrical panel, plumbing, and water heater last replaced?
- Is there a deadline driving the sale (1031 exchange, divorce, estate, relocation)? That informs how much negotiation room exists.
- Crime grade is F in this area — have there been break-ins, vandalism, or insurance claims at this property in the last 3 years? What carrier currently insures it and at what premium?
- The area grade is low — what's the realistic commute time and amenity access for the typical tenant pool here? Any planned neighborhood developments (good or bad) we should know about?
- What's the average days-on-market for RENTAL listings here right now (not sales)? A rising rental-DOM trend means longer vacancies and softer asking-rent achievability than the comps imply.
- What's the recent tenant-quality profile in this submarket — average credit score on applications, eviction rate, late-payment / NSF rate, and stable-employment percentage? A property-management company in the area should have these aggregated.
- How much new for-sale + rental construction is in the pipeline within 1–3 miles? Heavy new supply typically softens prices + rents 12–24 months out; constrained supply supports both.
Investment metrics
- 1% rule
- 7.02% ✓
- Cap rate
- 63.87%
- Cash-on-cash
- 205.64%
- DSCR
- 10.15
- GRM
- 1.2
CMA / ARV
- ARV (on-the-fly)
- $140,896
- Comps found
- 12
Show comp detail 12 sales within ~0.75 mi
| Address | Dist | Beds/Ba | Sqft | Sold | Price | $/sf | Match |
|---|---|---|---|---|---|---|---|
| 403 Lexington Ave | 0.20mi | 4/1.5 (+1) | 1,976 (+4%) | 5mo | $35,000 | $18 | 73 |
| 430 Lexington Ave | 0.16mi | 3/1.0 | 1,788 (-6%) | 9mo | $21,560 | $12 | 71 |
| 1549 Cory Dr | 0.56mi | 3/1.5 | 1,922 (+1%) | 2mo | $195,000 | $101 | 68 |
| 1725 W Grand Ave | 0.13mi | 3/1.5 | 1,629 (-14%) | 2mo | $144,900 | $89 | 66 |
| 1331 W Grand Ave | 0.25mi | 4/1.5 (+1) | 1,816 (-5%) | 9mo | $40,000 | $22 | 66 |
| 1606 W Grand Ave | 0.11mi | 4/1.5 (+1) | 2,148 (+13%) | 5mo | $73,500 | $34 | 63 |
| 1439 Kumler Ave | 0.43mi | 3/1.5 | 1,768 (-7%) | 5mo | $165,000 | $93 | 62 |
| 1556 N Euclid Ave | 0.51mi | 3/1.0 | 1,792 (-6%) | 2mo | $120,000 | $67 | 61 |
| 1133 Vernon Dr | 0.32mi | 4/1.5 (+1) | 1,680 (-12%) | 1mo | $125,000 | $74 | 58 |
| 549 Kenwood Ave | 0.73mi | 3/1.5 | 1,840 (-3%) | 5mo | $80,000 | $43 | 54 |
| 1215 Cumberland Ave | 0.66mi | 3/2.5 | 2,108 (+11%) | 0mo | $215,000 | $102 | 49 |
| 601 Kenwood Ave | 0.69mi | 4/2.5 (+1) | 1,626 (-15%) | 8mo | $235,000 | $145 | 30 |
Match score weights: distance 35% · size 25% · config 20% · recency 20%. Top-matched comps best support the ARV.
Projected returns pro-forma
-3.0% appreciation · 3.98% rent growth · sell at horizon
- IRR
- —
- Equity multiple
- 11.59×
- Total profit
- $54,857
- Equity at exit
- $2,758
- IRR
- —
- Equity multiple
- 25.34×
- Total profit
- $126,086
- Equity at exit
- $1,600
Cash invested: $5,180 (down + closing). Projections, not guarantees.
Landlord ↔ Tenant lean methodology
- Overall (STATE)
- 73 Landlord-Friendly
- State Ohio
- 73 Landlord-Friendly · R+6
- County
- — inherits STATE
- City
- — inherits STATE
ZIP-level market 45402
- Rents YoY
- 4.0%
- Active inventory
- 87
- Price-to-rent
- 1.2×
Monthly cashflow live
- Estimated rent
- $1,299 high interval (Pro) →
- Mortgage (P&I)
- −$97
- Tax from tax record
- −$34 /mo · $403/yr
- Insurance
- −$8
- HOA
- −$0
- Vacancy / Maint / Mgmt
- −$273
- Net cashflow
- $888
Break-even live
Sensitivity live
| Price | -10% $898 | -5% $893 | +0% $888 | +5% $882 | +10% $877 |
|---|---|---|---|---|---|
| Rent | -10% $785 | -5% $836 | +0% $888 | +5% $939 | +10% $990 |
| Rate | -1.0pp $897 | -0.5pp $892 | base $888 | +0.5pp $883 | +1.0pp $878 |
UW: 25.0% down · 7.5% · 30yr · 1.5% tax · 5.0% vac · 8.0% maint · 8.0% mgmt
Financing live
Cash to close
- Down payment
- $4,625
- Closing costs
- $555
- Reserves months
- —
- Total cash needed
- —
Loan-product check · same deal, 3 products live
Conventional
25% down · 7.5% · 30yr
- Down + closing
- —
- Monthly P&I
- —
- Monthly cashflow
- —
- DSCR
- —
- Eligible?
- —
Personal DTI + credit; lowest rate.
DSCR
20% down · 8.5% · 30yr
- Down + closing
- —
- Monthly P&I
- —
- Monthly cashflow
- —
- DSCR
- —
- Eligible?
- —
No personal income docs; deal must DSCR.
Hard money
10% down · 12.0% · 12mo
- Down + closing
- —
- Monthly P&I
- —
- Monthly cashflow
- —
- DSCR
- —
- Eligible?
- —
Short-term bridge; refi at stabilization.
Rent comps 40 comps
| Address | Beds | Baths | Sqft | Rent | $/sqft | DOM | Units | Dist |
|---|---|---|---|---|---|---|---|---|
| 424 Lexington Ave Dayton, OH | 3.0 | 2.0 | 1536 | $1,025 | $0.67 | 45d | 1 | 0.19mi |
| 1119 Superior Ave Unit 1119 Dayton, OH | 3.0 | 1.0 | 1435 | $1,350 | $0.94 | 5d | 1 | 0.23mi |
| 1378 Cory Dr Dayton, OH | 2.0 | 1.0 | 1300 | $975 | $0.75 | 45d | 1 | 0.37mi |
| 1011 N Broadway St Dayton, OH | 3.0 | 1.5 | 1700 | $950 | $0.56 | 45d | 1 | 0.46mi |
| 1225 Amherst Pl Dayton, OH | 3.0 | 1.0 | 1548 | $1,300 | $0.84 | 16d | 1 | 0.53mi |
| 1045 Philadelphia Dr Dayton, OH | 2.0 | 1.0 | 1290 | $1,150 | $0.89 | 4d | 1 | 0.57mi |
| 1045 Shakespeare Ave Dayton, OH | 3.0 | 1.0 | 1435 | $1,275 | $0.89 | 45d | 1 | 0.62mi |
| 942 Harvard Blvd Dayton, OH | 3.0 | 2.0 | 1596 | $1,200 | $0.75 | 5d | 1 | 0.65mi |
| 518 Delaware Ave Dayton, OH | 2.0 | 1.0 | 1500 | $750 | $0.50 | 45d | 1 | 0.76mi |
| 437 Lorenz Ave Dayton, OH | 3.0 | 1.0 | 1322 | $1,200 | $0.91 | 25d | 1 | 0.79mi |
| 1743 Radcliffe Rd Dayton, OH | 3.0 | 1.5 | 1729 | $1,200 | $0.69 | 45d | 1 | 0.84mi |
| 132 Wroe Ave Unit 132 Dayton, OH | 3.0 | 2.5 | 1934 | $1,297 | $0.67 | 45d | 1 | 0.85mi |
| 216 N Ardmore Ave Dayton, OH | 3.0 | 1.0 | 1500 | $1,100 | $0.73 | 5d | 1 | 0.93mi |
| 338 Kenwood Ave Dayton, OH | 3.0 | 1.5 | 1512 | $1,195 | $0.79 | 45d | 1 | 0.94mi |
| 136 Rockwood Ave Dayton, OH | 3.0 | 1.5 | 1439 | $1,200 | $0.83 | 45d | 1 | 1.01mi |
| 138 Rockwood Ave Dayton, OH | 3.0 | 1.5 | 1439 | $1,200 | $0.83 | 25d | 1 | 1.01mi |
| 234 Santa Clara Ave Dayton, OH | 3.0 | 1.0 | 1368 | $1,125 | $0.82 | 45d | 1 | 1.01mi |
| 617 Westwood Ave Dayton, OH | 3.0 | 1.0 | 1304 | $1,050 | $0.81 | 45d | 1 | 1.02mi |
| 18 Holt St Unit 24 Dayton, OH | 3.0 | 2.5 | 1350 | $1,450 | $1.07 | 16d | 1 | 1.02mi |
| 848 Riverview Ter Apt 607 Dayton, OH | 2.0 | 1.0 | 1400 | $1,300 | $0.93 | 25d | 1 | 1.03mi |
| 1543 W 5th St Dayton, OH | 2.0 | 2.0 | 2276 | $1,200 | $0.53 | 45d | 1 | 1.04mi |
| 40 S Mathison St Dayton, OH | 3.0 | 1.0 | 1300 | $1,200 | $0.92 | 16d | 1 | 1.09mi |
| 42 S Mathison St Dayton, OH | 3.0 | 1.0 | 1300 | $1,220 | $0.94 | 5d | 1 | 1.09mi |
| 1927 Burroughs Dr Dayton, OH | 3.0 | 2.0 | 1409 | $1,245 | $0.88 | 16d | 1 | 1.11mi |
| 167 W Hudson Ave Dayton, OH | 3.0 | 1.5 | 1344 | $1,185 | $0.88 | 45d | 1 | 1.13mi |
| 2232 Salem Ave Dayton, OH | 3.0 | 1.0 | 1250 | $1,200 | $0.96 | 5d | 1 | 1.14mi |
| 201 W Norman Ave Dayton, OH | 3.0 | 1.0 | 1424 | $1,200 | $0.84 | 45d | 1 | 1.18mi |
| 2247 Salem Ave Unit 2247 Dayton, OH | 3.0 | 1.5 | 1300 | $1,350 | $1.04 | 5d | 1 | 1.18mi |
| 2247 Salem Ave Unit 2249 Dayton, OH | 3.0 | 1.5 | 1300 | $1,400 | $1.08 | 45d | 1 | 1.18mi |
| 1501 Viola Ave Dayton, OH | 3.0 | 1.0 | 1952 | $1,175 | $0.60 | 16d | 1 | 1.18mi |
| 181 W Norman Ave Dayton, OH | 3.0 | 2.0 | 1228 | $1,150 | $0.94 | 45d | 1 | 1.18mi |
| 439 W Fairview Ave Dayton, OH | 3.0 | 1.0 | 1500 | $1,200 | $0.80 | 45d | 1 | 1.24mi |
| 127 Mound St Dayton, OH | 3.0 | 3.0 | 1726 | $1,600 | $0.93 | 16d | 1 | 1.25mi |
| 101 W Norman Ave Unit 101 Dayton, OH | 3.0 | 1.0 | 1600 | $945 | $0.59 | 45d | 1 | 1.25mi |
| 534 Geyer St Dayton, OH | 4.0 | 1.0 | 1640 | $1,530 | $0.93 | 25d | 1 | 1.32mi |
| 41 W Fairview Ave Unit 2 Dayton, OH | 3.0 | 1.0 | 1452 | $1,200 | $0.83 | 16d | 1 | 1.34mi |
| 47 Leroy St Dayton, OH | 3.0 | 1.0 | 1456 | $1,200 | $0.82 | 45d | 1 | 1.35mi |
| 3668 Karwin Dr Unit 3672 Dayton, OH | 2.0 | 1.0 | 1500 | $995 | $0.66 | 25d | 1 | 1.36mi |
| 3672 Karwin Dr Unit 3672 Dayton, OH | 2.0 | 1.0 | 1500 | $995 | $0.66 | 45d | 1 | 1.36mi |
| 2141 Philadelphia Dr Dayton, OH | 3.0 | 1.0 | 1736 | $1,395 | $0.80 | 45d | 1 | 1.40mi |
Listing history 5 events
-
2026-06-15days on market $18,500 Active 6 DOM
-
2026-06-14days on market $18,500 Active 4 DOM
-
2026-06-13days on market $18,500 Active 3 DOM
-
2026-06-10remarks 687-char remark
-
2026-06-10$18,500 Active 1 DOM
ⓘ Source: listings_history table (triggers on properties + properties_extension) + one-shot
backfill from property_details.listing_events for pre-trigger history.
Tax reassessment forecast OH · Partial reset (capped growth)
- Current annual tax
- $403 · $34/mo
- Projected year-2 tax
- $403 · $34/mo
- Expected delta
- $0/yr ($0/mo · 0.0%)
ⓘ Screening estimate from a state-policy table — verify with the county assessor before closing.
Climate risk First Street
- Flood 1/10 Low FEMA zone X (unshaded) · 0% chance over 30 yrs
- Wildfire 1/10 Low
- Heat 3/10 Moderate 7 d/yr ≥102°F today · 18 d/yr by 30 yrs out
- Wind 2/10 Low 0% chance of damaging wind over 30 yrs
- Air quality 3/10 Moderate 2 unhealthy d/yr today · 4 by 30 yrs out
Nearby sold comps map
Loading sold comps map…
Walkable amenities ~0.75 mi
Loading nearby amenities…
Taxation est. · year 1
- Rental income
- $15,584
- − Mortgage interest
- −$1,036
- − Property taxes
- −$403
- − Insurance
- −$92
- − Repairs & maintenance
- −$1,247
- − Management
- −$1,247
- − Depreciation
- −$538
- Taxable income
- $11,021
- Est. tax owed @ 24.0%
- −$2,645
- After-tax cash flow
- $8,007/yr
For passive investors: Depreciation is non-cash, so a rental often shows a tax loss while cash-flowing — sheltering income. Rental losses are passive: they offset passive income freely, and up to $25,000/yr can offset ordinary (W-2) income if you actively participate and your MAGI is under $100k (phasing out to $0 by $150k); unused losses carry forward. On sale, claimed depreciation is recaptured at up to 25%, and gains may owe capital-gains tax (a 1031 exchange can defer both). Figures are a year-1 estimate at your 24.0% rate — not tax advice; consult a CPA.
Schools (NCES district)
- District
- Dayton City
- NCES district ID
- 3904384
- Math proficiency
- 12% ▼ -12.00%
- Reading proficiency
- 21% ▼ -11.00%
- Median HH income
- $28,688
- Composite
- 12.94/100
- National rank
- #9579
- State rank
- #641 of 656 in OH
Livability — Dayton
- Score
- 65/100
- State rank
- #716
- US rank
- #12895
Category grades
Schools grade is shown separately in the Schools card above.
Census & demographics
- Census place
- Dayton, OH
- County
- Montgomery County · 459,541 people
- City population
- 164,387
- Metro
- Dayton-Kettering, OH
- Population (ZIP)
- 9,407
- Household income
- $48,401
- Rent vs Own
- Severe rent burden
- 404.0
Population outlook (Montgomery County) Hauer SSP2
- Today (2025)
- 523,241 people
- By 2030
- 514,948 · -1.6%
- By 2040
- 493,378 · -5.7%
- By 2050
- 469,639 · -10.2%
- By 2075
- 418,360 · -20.0%
- By 2100
- 353,315 · -32.5%
Race, ethnicity, and origin ACS 2023
- Neighborhood character
- Diverse neighborhood (Simpson 0.57)
- Race & ethnicity
- Black 57% White 32% Two or more races 7% Hispanic / Latino 5%
- Hispanic origin (detail)
- Mexican 1%
- Common ancestry
- Italian 2% Serbian 2% Slovak 1%
- Foreign-born
- 5% · Canada, Vietnam, Jamaica
- Languages at home
- 94% English-only · Spanish 4% Other Asian/Pacific 1% Arabic 1%
Political lean MEDSL · Montgomery
- 2024 margin
- Toss-up / Even · D 49.8% · R 49.3%
- 2008→2024 swing
- -5.8pp toward R · 2008: 6.2pp · 2024: 0.5pp
- All cycles
- 2024: D+0.5 2020: D+2.2 2016: R+1.2 2012: D+3.1 2008: D+6.2
Not yet ingested
- Civics
- —
Market trends
- HPI YoY
- ▼ -81.89%
- Current HPI
- 149.7909
- Rent YoY
- ▲ 3.98%
- Metro
- Dayton-Kettering, OH
- State GDP YoY
- ▲ 1.98%
- F500 in state
- 48
Industry mix (Fortune 500 HQ in OH)
| Industry | F500 HQs | Revenue |
|---|---|---|
| Insurance | 3 | $145B |
|
||
| Industrial Machinery | 3 | $49B |
|
||
| Financial Services | 3 | $24B |
|
||
| Consumer Goods | 2 | $93B |
|
||
| Aerospace / Defense | 2 | $47B |
|
||
| Utilities | 2 | $33B |
|
||
Price history
1 event — show timeline
- 2026-06-10 Listed $18,500 FSBO.com
Property tax history
-12.7%/yrLatest (2025): $403 · +0.2% YoY. Source: county tax records.
Cash-flow waterfall
monthlySold comps — $/sqft
last 12 mo · ≤1 miLoading sold comps…