568 Silver Course Loop · Silver Springs Shores, FL
Flood risk 1/10 · Minimal
- FEMA flood zone
- X (unshaded)
- Chance of flooding over 30 yrs
- 0.0%
- Est. flood insurance / yr
- $507 – $1,088
Fire risk 4/10 · Minor
- Est. fire insurance / yr
- $947 – $1,759
Heat risk 8/10 · Major
- Hot days now (above 108°F)
- 7 days/yr
- Hot days in 30 yrs
- 22 days/yr
Wind risk 9/10 · Severe
- Chance of severe wind over 30 yrs
- 99.0%
Air-quality risk 3/10 · Minor
- Unhealthy air days now
- 3 days/yr
- Unhealthy air days in 30 yrs
- 4 days/yr
Risk factors via First Street. Map © Google.
Why this score? — see what drove the C grade
The composite is a weighted blend of 9 inputs, each scored 0–100. Each bar is that input's sub-score; the figure is the points it added to the 100-point composite (weight × sub-score).
- Cash flow +15.2/30.0
- ARV discount +15.0/15.0
- Appreciation +8.0/10.0
- DSCR +4.7/10.0
- Schools +3.6/10.0
- Livability +3.4/5.0
- 1% rule +3.2/10.0
- Rent growth +2.5/5.0
- Condition / age +2.5/5.0
$210,000
🖨 Deal sheet 📄 Offer letter ✓ Due diligence
Listing remarks
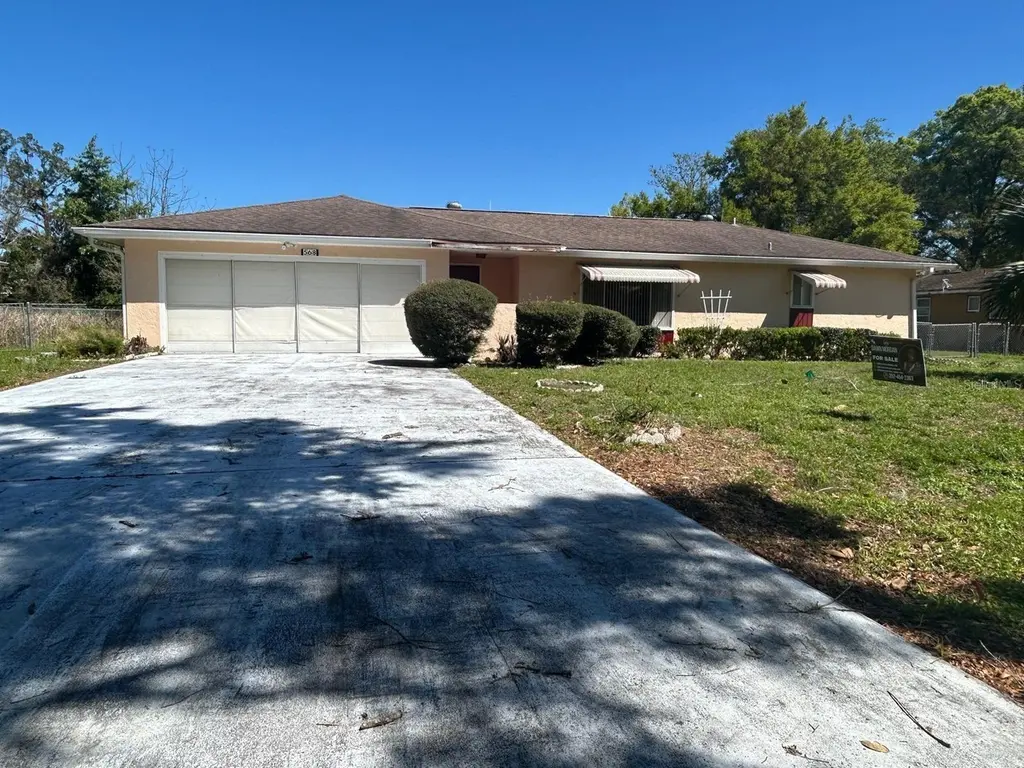
There is no HOA! Discover the potential in this Silver Springs Shores home situated on . 34 acres, offering 1,985 sq ft of heated living space in a split-plan layout with 3 bedrooms, 2 bathrooms, a formal living room, formal dining room, family room, and an eat-in kitchen. The property also includes an oversized garage, bringing the total under-roof area to 2,637 sq ft, along with a concrete deck off the Florida room—a great foundation for indoor-outdoor living. This home needs interior and exterior updates, providing a true blank canvas to customize, restore, and build value. Located in a convenient area of Ocala with major new construction nearby from well-known builders. Close to s
Key facts
- Close to parks
- Exterior updates
- No hoa
Tags
Property features AI
Finance
- Other: Zoning: R1
- Financial info: No lease restrictions indicated; Partially furnished
- HOA & community: No association indicated
Exterior
- Parking: Attached garage (2 spaces)
- Utilities: Public water; Public sewer; Public utilities
- Home design: Single family residence; One story; Faces east
- Construction: Stucco and frame construction; Shingle roof; Slab foundation; Built on a 0.34-acre lot (approximately 98 x 149)
- Exterior features: Awning(s); Paved road access
Interior
- Kitchen: Dishwasher; Microwave; Range; Refrigerator
- Bedrooms: 3 bedrooms
- Flooring: Carpet; Tile
- Bathrooms: 2 full bathrooms
- Heating & cooling: Central heating; Central air conditioning
- Interior features: Cathedral ceilings; Ceiling fans; Kitchen and family room combo
- Laundry & utility: Laundry in garage
Neighborhood map
What this means for you Summary
Snapshot
- This is a 3-bed/2.0-bath single-family listed at $210k.
Deal economics
- At list price, monthly cash flow is $73 ($882/yr) — positive.
- The deal already cash-flows at list — no discount required.
- To meet the 1% rule (rent ≥ 1% of price), the offer needs to be $173k (17.6% below list).
- Recommended offer: $173k (17.6% below list) — sets the bar for 1% rule.
- Cap rate 6.7% vs local median 4.7% in Silver Springs Shores — top-decile yield for the area; either an underpriced asset or a hidden risk that comps aren't pricing in. Stress-test before assuming the spread holds.
Location & tenants
- Location reads 68/100 on livability (#527 in FL) — a middle-class / working-renter tenant base. Strengths: cost of living A+, housing A+, health & safety A-; Watch: crime C-, employment D, amenities F.
- Marion (rural): math 42% / reading 43% proficiency, ranked #61 of 73 in FL (top 84%) — families likely to look elsewhere, expect single-tenant / working-renter base with shorter leases; 61% free/reduced lunch — lower-income household profile, screen leases tightly.
- Zoned schools: Greenway Elementary School (math 33% / reading 35%, grade F, #1,744 of 2,144 statewide, top 82%, 736 students, 67% FRL); Lake Weir High School (math 23% / reading 34%, grade F, #458 of 667 statewide, top 69%, 1,483 students, 68% FRL).
- Market conditions: Rents flat; 674 active listings in the ZIP; 17 comparable units currently listed for rent nearby; rentals at typical pace (median 21d on market — plan ~3-4 weeks tenant-placement turnaround); 7,071 units permitted in Marion County in 2024 (534 in 5+ unit buildings).
- This rent runs 32% of the median local income ($64k/yr) — at the standard rent-burdened threshold; future hikes will face affordability resistance.
Forward outlook
- In year one you build about $14k of equity ($1k loan paydown + $12k appreciation (5.9% local appreciation)).
- Marion County population projected at +13% by 2050 — modest demand growth; plan on rents tracking national, not racing it.
- At projected returns (5.9% appreciation + 0.2% rent growth), your $59k cash investment doubles in ~4 years — after that, you're playing with house money.
- By year 3, paydown + projected appreciation supports a ~$34k cash-out refi (75% LTV) — recoverable capital for the next deal without selling this one.
Negotiation context
- It's been on market 58 days — a 3% lower offer ($204k) is reasonable based on typical stale-listing flexibility.
- Current owner paid $63k; list at $210k implies a 233% gain — meaningful room to come down on a strong offer.
Risks & watch-outs
- Climate carrying-cost: severe wind risk, 99% chance of damaging wind over 30y; extreme-heat days projected 7→22/yr by 2055 (HVAC capex compounding) — expect insurance premiums to compound above CPI over the hold.
Questions for the listing agent
- It's been on market 58 days. Have you received any prior offers? Is the seller open to a 18% concession, seller financing, or rate buy-down credit?
- Built in 1975 — when were the roof, HVAC, electrical panel, plumbing, and water heater last replaced?
- Is there a deadline driving the sale (1031 exchange, divorce, estate, relocation)? That informs how much negotiation room exists.
- Schools are F-rated, which usually means shorter tenancies and higher turnover. Who's the typical renter profile here, and what's been the actual vacancy rate?
- What's the average days-on-market for RENTAL listings here right now (not sales)? A rising rental-DOM trend means longer vacancies and softer asking-rent achievability than the comps imply.
- What's the recent tenant-quality profile in this submarket — average credit score on applications, eviction rate, late-payment / NSF rate, and stable-employment percentage? A property-management company in the area should have these aggregated.
- How much new for-sale + rental construction is in the pipeline within 1–3 miles? Heavy new supply typically softens prices + rents 12–24 months out; constrained supply supports both.
Investment metrics
- 1% rule
- 0.82% ✗
- Cap rate
- 6.71%
- Cash-on-cash
- 1.50%
- DSCR
- 1.07
- GRM
- 10.1
CMA / ARV
- ARV (on-the-fly)
- $351,648
- Comps found
- 6
Show comp detail 6 sales within ~0.75 mi
| Address | Dist | Beds/Ba | Sqft | Sold | Price | $/sf | Match |
|---|---|---|---|---|---|---|---|
| 543 Silver Crse | 0.10mi | 3/2.0 | 1,939 (-3%) | 2mo | $240,000 | $124 | 89 |
| 5 Spring Lake Run | 0.35mi | 3/2.0 | 2,002 (+0%) | 24mo | $215,000 | $107 | 64 |
| 3 Diamond Cove Ct | 0.59mi | 4/2.0 (+1) | 1,825 (-9%) | 1mo | $200,000 | $110 | 52 |
| 565 Silver Course Radl | 0.37mi | 4/2.0 (+1) | 1,715 (-14%) | 6mo | $309,900 | $181 | 49 |
| 545 Silver Course Radl | 0.40mi | 4/2.0 (+1) | 1,715 (-14%) | 8mo | $314,900 | $184 | 46 |
| 38 Spring Trce | 0.57mi | 4/2.0 (+1) | 1,765 (-12%) | 17mo | $310,000 | $176 | 35 |
Match score weights: distance 35% · size 25% · config 20% · recency 20%. Top-matched comps best support the ARV.
Projected returns pro-forma
5.93% appreciation · 0.17% rent growth · sell at horizon
- IRR
- 15.3%
- Equity multiple
- 2.01×
- Total profit
- $59,611
- Equity at exit
- $131,121
- IRR
- 14.6%
- Equity multiple
- 3.77×
- Total profit
- $163,102
- Equity at exit
- $237,013
Cash invested: $58,800 (down + closing). Projections, not guarantees.
Landlord ↔ Tenant lean methodology
- Overall (STATE)
- 87 Strongly Landlord-Friendly
- State Florida
- 87 Strongly Landlord-Friendly · R+3
- County
- — inherits STATE
- City
- — inherits STATE
ZIP-level market 34472
- Home prices YoY
- 2.4%
- Rents YoY
- 0.2%
- Active inventory
- 674
- Price-to-rent
- 10.1×
Monthly cashflow live
- Estimated rent
- $1,729 high interval (Pro) →
- Mortgage (P&I)
- −$1,101
- Tax from tax record
- −$104 /mo · $1,248/yr
- Insurance
- −$88
- HOA
- −$0
- Vacancy / Maint / Mgmt
- −$363
- Net cashflow
- $73
Break-even live
UW: 25.0% down · 7.5% · 30yr · 1.5% tax · 5.0% vac · 8.0% maint · 8.0% mgmt
Financing live
Cash to close
- Down payment
- $52,500
- Closing costs
- $6,300
- Reserves months
- —
- Total cash needed
- —
Loan-product check · same deal, 3 products live
Conventional
25% down · 7.5% · 30yr
- Down + closing
- —
- Monthly P&I
- —
- Monthly cashflow
- —
- DSCR
- —
- Eligible?
- —
Personal DTI + credit; lowest rate.
DSCR
20% down · 8.5% · 30yr
- Down + closing
- —
- Monthly P&I
- —
- Monthly cashflow
- —
- DSCR
- —
- Eligible?
- —
No personal income docs; deal must DSCR.
Hard money
10% down · 12.0% · 12mo
- Down + closing
- —
- Monthly P&I
- —
- Monthly cashflow
- —
- DSCR
- —
- Eligible?
- —
Short-term bridge; refi at stabilization.
Rent comps 17 comps
| Address | Beds | Baths | Sqft | Rent | $/sqft | DOM | Units | Dist |
|---|---|---|---|---|---|---|---|---|
| 619 Silver Pass Ocala, FL | 3.0 | 2.0 | 1510 | $1,495 | $0.99 | 21d | 1 | 0.23mi |
| 553 Fairways Cir Unit B Ocala, FL | 2.0 | 2.0 | 1304 | $1,700 | $1.30 | 13d | 1 | 0.24mi |
| 708 Bahia Cir Ocala, FL | 3.0 | 2.0 | 1352 | $1,500 | $1.11 | 21d | 1 | 0.26mi |
| 582 Fairways Cir Unit A Ocala, FL | 2.0 | 2.0 | 1304 | $1,500 | $1.15 | 21d | 1 | 0.33mi |
| 9337 Bahia Rd Ocala, FL | 3.0 | 2.0 | 1402 | $1,765 | $1.26 | 13d | 1 | 0.57mi |
| 705 Lake Diamond Ave Ocala, FL | 4.0 | 2.0 | 2588 | $1,800 | $0.70 | 21d | 1 | 0.59mi |
| 478 Water Pl Ocala, FL | 3.0 | 2.0 | 1228 | $1,650 | $1.34 | 21d | 1 | 0.63mi |
| 455 Water Rd Ocala, FL | 3.0 | 2.0 | 1275 | $1,450 | $1.14 | 13d | 1 | 0.72mi |
| 446 Water Rd Ocala, FL | 3.0 | 2.0 | 1248 | $1,425 | $1.14 | 21d | 1 | 0.73mi |
| 13 Pine Radial Dr Ocala, FL | 3.0 | 2.0 | 1453 | $1,795 | $1.24 | 21d | 1 | 1.01mi |
| 7184 Hemlock Loop Ocala, FL | 3.0 | 2.0 | 1392 | $1,675 | $1.20 | 21d | 1 | 1.11mi |
| 60 Bahia Court Trak Ocala, FL | 3.0 | 2.0 | 1413 | $1,695 | $1.20 | 21d | 1 | 1.15mi |
| 9610 Bahia Rd Ocala, FL | 4.0 | 2.0 | 1617 | $1,895 | $1.17 | 21d | 1 | 1.16mi |
| 51 Hickory Course Trl Ocala, FL | 4.0 | 2.0 | 2319 | $2,300 | $0.99 | 13d | 1 | 1.22mi |
| 9649 Bahia Rd Ocala, FL | 3.0 | 2.0 | 1282 | $1,595 | $1.24 | 21d | 1 | 1.33mi |
| 308 Hickory Course Radl Ocala, FL | 3.0 | 2.0 | 1397 | $1,650 | $1.18 | 21d | 1 | 1.35mi |
| 7 Pine Run Ter Ocala, FL | 3.0 | 2.0 | 1432 | $1,500 | $1.05 | 13d | 1 | 1.46mi |
Listing history 3 events
-
2026-05-14status Pending
-
2026-03-17$210,000 Active
-
1988-10-01soldstatus $63,000
ⓘ Source: listings_history table (triggers on properties + properties_extension) + one-shot
backfill from property_details.listing_events for pre-trigger history.
Tax reassessment forecast FL · Resets to sale price
- Current annual tax
- $1,248 · $104/mo
- Projected year-2 tax
- $1,743 · $145/mo
- Expected delta
- +$495/yr (+$41/mo · 39.7%)
ⓘ Screening estimate from a state-policy table — verify with the county assessor before closing.
Climate risk First Street
- Flood 1/10 Low FEMA zone X (unshaded) · 0% chance over 30 yrs
- Wildfire 4/10 Moderate
- Heat 8/10 Severe 7 d/yr ≥108°F today · 22 d/yr by 30 yrs out
- Wind 9/10 Extreme 99% chance of damaging wind over 30 yrs
- Air quality 3/10 Moderate 3 unhealthy d/yr today · 4 by 30 yrs out
Nearby sold comps map
Loading sold comps map…
Walkable amenities ~0.75 mi
Loading nearby amenities…
Taxation est. · year 1
- Rental income
- $20,752
- − Mortgage interest
- −$11,763
- − Property taxes
- −$1,248
- − Insurance
- −$1,050
- − Repairs & maintenance
- −$1,660
- − Management
- −$1,660
- − Depreciation
- −$6,109
- Taxable loss
- −$2,738
- Est. tax savings @ 24.0%
- +$657
- After-tax cash flow
- $1,539/yr
For passive investors: Depreciation is non-cash, so a rental often shows a tax loss while cash-flowing — sheltering income. Rental losses are passive: they offset passive income freely, and up to $25,000/yr can offset ordinary (W-2) income if you actively participate and your MAGI is under $100k (phasing out to $0 by $150k); unused losses carry forward. On sale, claimed depreciation is recaptured at up to 25%, and gains may owe capital-gains tax (a 1031 exchange can defer both). Figures are a year-1 estimate at your 24.0% rate — not tax advice; consult a CPA.
Schools (NCES district)
- District
- Marion
- NCES district ID
- 1201260
- Math proficiency
- 42% ▼ -7.00%
- Reading proficiency
- 43% ▼ -4.00%
- Median HH income
- $40,015
- Composite
- 35.61/100
- National rank
- #4890
- State rank
- #61 of 73 in FL
Livability — Silver Springs Shores
- Score
- 68/100
- State rank
- #527
- US rank
- #9854
Category grades
Schools grade is shown separately in the Schools card above.
Census & demographics
- Census place
- Silver Springs Shores, FL
- County
- Marion County · 315,796 people
- City population
- 34,665
- Metro
- Ocala, FL
- Population (ZIP)
- 35,851
- Household income
- $64,208
- Rent vs Own
- Severe rent burden
- 655.0
Population outlook (Marion County) Hauer SSP2
- Today (2025)
- 365,905 people
- By 2030
- 376,768 · +3.0%
- By 2040
- 396,555 · +8.4%
- By 2050
- 412,723 · +12.8%
- By 2075
- 446,090 · +21.9%
- By 2100
- 436,193 · +19.2%
Race, ethnicity, and origin ACS 2023
- Neighborhood character
- Diverse neighborhood (Simpson 0.65)
- Race & ethnicity
- White 50% Hispanic / Latino 25% Black 21% Two or more races 18% Asian 2%
- Hispanic origin (detail)
- Mexican 2% Puerto Rican 14% Cuban 3%
- Common ancestry
- Romanian 2% Iranian 1% Lithuanian 1%
- Foreign-born
- 11% · Canada, Jamaica, China
- Languages at home
- 78% English-only · Spanish 19% Other Indo-European 1%
Political lean MEDSL · Marion
- 2024 margin
- Solid R (+31.6) · D 33.8% · R 65.5%
- 2008→2024 swing
- -20.0pp toward R · 2008: -11.6pp · 2024: -31.6pp
- All cycles
- 2024: R+31.6 2020: R+25.9 2016: R+26.2 2012: R+16.2 2008: R+11.6
Not yet ingested
- Civics
- —
Market trends
- HPI YoY
- ▲ 5.93%
- Current HPI
- 255.0714
- Rent YoY
- ▲ 0.17%
- Metro
- Ocala, FL
- State GDP YoY
- ▲ 3.28%
- F500 in state
- 36
Industry mix (Fortune 500 HQ in FL)
| Industry | F500 HQs | Revenue |
|---|---|---|
| Industrial Technology | 2 | $29B |
|
||
| Insurance | 2 | $17B |
|
||
| Retail | 1 | $60B |
|
||
| Technology Distribution | 1 | $58B |
|
||
| Homebuilding | 1 | $35B |
|
||
| Technology Manufacturing | 1 | $35B |
|
||
Price history
+233.3% since first listed3 events — show timeline
- 2026-05-14 Pending — Stellar MLS as Distributed by MLS Grid
- 2026-03-17 Listed $210,000 Stellar MLS as Distributed by MLS Grid
- 1988-10-01 Sold (Public Records) $63,000 Public Records
Property tax history
+3.2%/yrLatest (2025): $1,248 · +23.4% YoY. Source: county tax records.
Cash-flow waterfall
monthlySold comps — $/sqft
last 12 mo · ≤1 miLoading sold comps…