202 W Missouri St · Buffalo, MO
Flood risk 1/10 · Minimal
- FEMA flood zone
- X (unshaded)
- Chance of flooding over 30 yrs
- 0.0%
- Est. flood insurance / yr
- $507 – $1,088
Fire risk 4/10 · Minor
- Est. fire insurance / yr
- $1,054 – $1,958
Heat risk 5/10 · Moderate
- Hot days now (above 107°F)
- 7 days/yr
- Hot days in 30 yrs
- 19 days/yr
Wind risk 2/10 · Minimal
- Chance of severe wind over 30 yrs
- —
Air-quality risk 2/10 · Minimal
- Unhealthy air days now
- 1 days/yr
- Unhealthy air days in 30 yrs
- 1 days/yr
Risk factors via First Street. Map © Google.
Why this score? — see what drove the B grade
The composite is a weighted blend of 9 inputs, each scored 0–100. Each bar is that input's sub-score; the figure is the points it added to the 100-point composite (weight × sub-score).
- Cash flow +30.0/30.0
- 1% rule +10.0/10.0
- DSCR +10.0/10.0
- ARV discount +7.5/15.0
- Appreciation +3.6/10.0
- Livability +3.4/5.0
- Rent growth +2.5/5.0
- Condition / age +2.5/5.0
- Schools +2.4/10.0
$60,000
🖨 Deal sheet 📄 Offer letter ✓ Due diligence
Listing remarks MLS
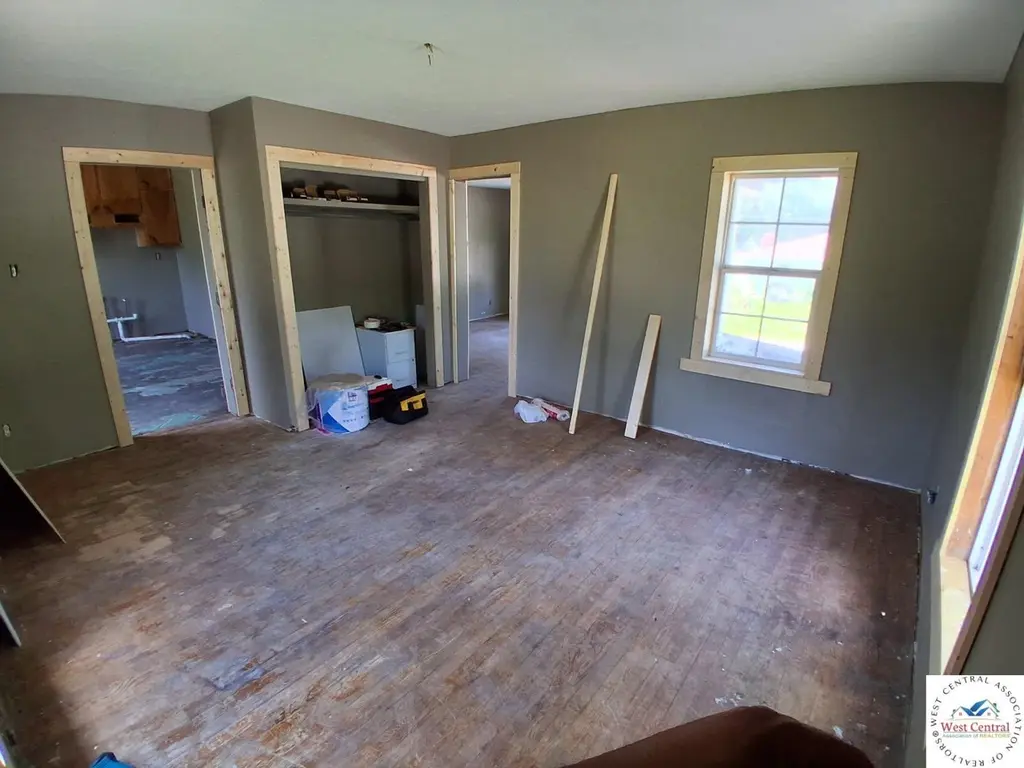
Corner Lot with Big Potential in Buffalo, Missouri!Discover the perfect spot to build your dream home on . 40+/- acre corner lot located at West Missouri and Elder Street in Buffalo. This spacious lot offers plenty of room to design your ideal layout, with the added bonus of water and sewer hookups already available--making the building process even smoother. Whether you're looking to build now or invest for the future, this property is full of opportunity. Level ground, great access, and a prime corner location make it a standout option!Call today to schedule your appointment and take the first step toward your next home project.
Key facts
- 0.48 acre lot
- Built 1920
- Listed 18 days
Property features AI
Exterior
- Parking: No garage
- Home design: Single-family residence
- Exterior features: Approximately 0.48-acre lot
Interior
- Bathrooms: Three full bathrooms
- Interior features: Basement
Neighborhood map
What this means for you Summary
Snapshot
- This is a 5-bed/3.0-bath other listed at $60k.
Deal economics
- At list price, monthly cash flow is $732 ($9k/yr) — positive.
- The deal already cash-flows at list — no discount required.
- Meets the 1% rule at list price ($1k rent vs $60k).
- Recommended offer: $59k (1.5% below list) — sets the bar for market timing.
- Cap rate 20.9% vs local median 3.0% in Buffalo — top-decile yield for the area; either an underpriced asset or a hidden risk that comps aren't pricing in. Stress-test before assuming the spread holds.
Location & tenants
- Location reads 68/100 on livability (#181 in MO) — a middle-class / working-renter tenant base. Strengths: cost of living A+, health & safety A+, housing B; Watch: schools F, amenities F, commute F.
- Dallas County R-I (town): math 23% / reading 35% proficiency, ranked #278 of 324 in MO (top 86%) — low school quality limits family demand, transient renter base, plan for 1-2y turnover.
- Market conditions: 85 active listings in the ZIP; 8 units permitted in Dallas County in 2024 (0 in 5+ unit buildings).
Forward outlook
- Local home prices are declining (-2.8%/yr); year-one equity from $415 of loan paydown is wiped out by about $2k of value loss. Plan a longer hold.
- Dallas County population projected at -26% by 2050 — secular population decline; favor cash flow + early exit over multi-decade hold.
- At projected returns (-2.8% appreciation + 3.0% rent growth), your $17k cash investment doubles in ~3 years — after that, you're playing with house money.
Negotiation context
- It's been on market 19 days — a 2% lower offer ($59k) is reasonable based on typical stale-listing flexibility.
- 2 sale attempts; this cycle's ask has dropped $15k (20%) from the opening price — seller is motivated, your offer sets the floor, not the list.
Risks & watch-outs
- Watch-outs: built in 1920 — expect roof / HVAC / electrical / plumbing capex.
- Climate carrying-cost: extreme-heat days projected 7→19/yr by 2055 (HVAC capex compounding) — expect insurance premiums to compound above CPI over the hold.
Questions for the listing agent
- Built in 1920 — when were the roof, HVAC, electrical panel, plumbing, and water heater last replaced?
- Is there a deadline driving the sale (1031 exchange, divorce, estate, relocation)? That informs how much negotiation room exists.
- Schools are F-rated, which usually means shorter tenancies and higher turnover. Who's the typical renter profile here, and what's been the actual vacancy rate?
- What's the average days-on-market for RENTAL listings here right now (not sales)? A rising rental-DOM trend means longer vacancies and softer asking-rent achievability than the comps imply.
- What's the recent tenant-quality profile in this submarket — average credit score on applications, eviction rate, late-payment / NSF rate, and stable-employment percentage? A property-management company in the area should have these aggregated.
- How much new for-sale + rental construction is in the pipeline within 1–3 miles? Heavy new supply typically softens prices + rents 12–24 months out; constrained supply supports both.
Investment metrics
- 1% rule
- 2.42% ✓
- Cap rate
- 20.94%
- Cash-on-cash
- 52.30%
- DSCR
- 3.33
- GRM
- 3.4
CMA / ARV
No comps found within radius.
Projected returns pro-forma
-2.81% appreciation · 3.0% rent growth · sell at horizon
- IRR
- 50.5%
- Equity multiple
- 3.23×
- Total profit
- $37,414
- Equity at exit
- $9,456
- IRR
- 55.8%
- Equity multiple
- 6.54×
- Total profit
- $93,129
- Equity at exit
- $6,067
Cash invested: $16,800 (down + closing). Projections, not guarantees.
Landlord ↔ Tenant lean methodology
- Overall (STATE)
- 81 Strongly Landlord-Friendly
- State Missouri
- 81 Strongly Landlord-Friendly · R+10
- County
- — inherits STATE
- City
- — inherits STATE
ZIP-level market 65622
- Home prices YoY
- -1.1%
- Active inventory
- 85
- Price-to-rent
- 3.4×
Monthly cashflow live
- Estimated rent
- $1,452 medium interval (Pro) →
- Mortgage (P&I)
- −$315
- Tax est. 1.5%
- −$75 /mo · $900/yr
- Insurance
- −$25
- HOA
- −$0
- Vacancy / Maint / Mgmt
- −$305
- Net cashflow
- $732
Break-even live
UW: 25.0% down · 7.5% · 30yr · 1.5% tax · 5.0% vac · 8.0% maint · 8.0% mgmt
Financing live
Cash to close
- Down payment
- $15,000
- Closing costs
- $1,800
- Reserves months
- —
- Total cash needed
- —
Loan-product check · same deal, 3 products live
Conventional
25% down · 7.5% · 30yr
- Down + closing
- —
- Monthly P&I
- —
- Monthly cashflow
- —
- DSCR
- —
- Eligible?
- —
Personal DTI + credit; lowest rate.
DSCR
20% down · 8.5% · 30yr
- Down + closing
- —
- Monthly P&I
- —
- Monthly cashflow
- —
- DSCR
- —
- Eligible?
- —
No personal income docs; deal must DSCR.
Hard money
10% down · 12.0% · 12mo
- Down + closing
- —
- Monthly P&I
- —
- Monthly cashflow
- —
- DSCR
- —
- Eligible?
- —
Short-term bridge; refi at stabilization.
Listing history 13 events
-
2026-06-19days on market $60,000 Active 19 DOM
-
2026-06-18days on market $60,000 Active 18 DOM
-
2026-06-17days on market $60,000 Active 17 DOM
-
2026-06-16days on market $60,000 Active 16 DOM
-
2026-06-15days on market $60,000 Active 15 DOM
-
2026-06-14pricedays on market $60,000 Active 13 DOM
-
2026-06-12days on market $75,000 Active 12 DOM
-
2026-06-09days on market $75,000 Active 9 DOM
-
2026-06-08days on market $75,000 Active 8 DOM
-
2026-06-07days on market $75,000 Active 7 DOM
-
2026-06-02days on market $75,000 Active 2 DOM
-
2026-05-31remarks 472-char remark
-
2026-05-31$75,000 Active 1 DOM
ⓘ Source: listings_history table (triggers on properties + properties_extension) + one-shot
backfill from property_details.listing_events for pre-trigger history.
Climate risk First Street
- Flood 1/10 Low FEMA zone X (unshaded) · 0% chance over 30 yrs
- Wildfire 4/10 Moderate
- Heat 5/10 Major 7 d/yr ≥107°F today · 19 d/yr by 30 yrs out
- Wind 2/10 Low
- Air quality 2/10 Low 1 unhealthy d/yr today · 1 by 30 yrs out
Nearby sold comps map
Loading sold comps map…
Walkable amenities ~0.75 mi
Loading nearby amenities…
Taxation est. · year 1
- Rental income
- $17,421
- − Mortgage interest
- −$3,361
- − Property taxes
- −$900
- − Insurance
- −$300
- − Repairs & maintenance
- −$1,394
- − Management
- −$1,394
- − Depreciation
- −$1,745
- Taxable income
- $8,327
- Est. tax owed @ 24.0%
- −$1,998
- After-tax cash flow
- $6,788/yr
For passive investors: Depreciation is non-cash, so a rental often shows a tax loss while cash-flowing — sheltering income. Rental losses are passive: they offset passive income freely, and up to $25,000/yr can offset ordinary (W-2) income if you actively participate and your MAGI is under $100k (phasing out to $0 by $150k); unused losses carry forward. On sale, claimed depreciation is recaptured at up to 25%, and gains may owe capital-gains tax (a 1031 exchange can defer both). Figures are a year-1 estimate at your 24.0% rate — not tax advice; consult a CPA.
Schools (NCES district)
- District
- Dallas County R-I
- NCES district ID
- 2906120
- Math proficiency
- 23% ▼ -1.00%
- Reading proficiency
- 35% ▬ 0.00%
- Median HH income
- $38,067
- Composite
- 24.19/100
- National rank
- #7735
- State rank
- #278 of 324 in MO
Livability — Buffalo
- Score
- 68/100
- State rank
- #181
- US rank
- #9481
Category grades
Schools grade is shown separately in the Schools card above.
Census & demographics
- Census place
- Buffalo, MO
- Population (ZIP)
- 7,591
Population outlook (Dallas County) Hauer SSP2
- Today (2025)
- 15,419 people
- By 2030
- 14,668 · -4.9%
- By 2040
- 13,045 · -15.4%
- By 2050
- 11,341 · -26.4%
- By 2075
- 8,096 · -47.5%
- By 2100
- 5,656 · -63.3%
Race, ethnicity, and origin ACS 2023
- Neighborhood character
- Predominantly White (91%)
- Race & ethnicity
- White 91% Two or more races 5% Hispanic / Latino 4%
- Common ancestry
- Italian 4% Scottish 3% Iranian 2%
- Foreign-born
- 2% · Canada
- Languages at home
- 98% English-only · Spanish 1%
Political lean MEDSL · Dallas
- 2024 margin
- Solid R (+64.6) · D 17.3% · R 81.8%
- 2008→2024 swing
- -35.4pp toward R · 2008: -29.1pp · 2024: -64.6pp
- All cycles
- 2024: R+64.6 2020: R+64.7 2016: R+62.1 2012: R+39.4 2008: R+29.1
Not yet ingested
- Civics
- —
Market trends
- HPI YoY
- ▼ -2.81%
- Current HPI
- 256.066
- Rent YoY
- —
- Metro
- —
- State GDP YoY
- ▲ 1.84%
- F500 in state
- 20
Industry mix (Fortune 500 HQ in MO)
| Industry | F500 HQs | Revenue |
|---|---|---|
| Healthcare | 1 | $163B |
|
||
| Insurance | 1 | $21B |
|
||
| Industrial Technology | 1 | $17B |
|
||
| Retail | 1 | $16B |
|
||
| Industrial Distribution | 1 | $10B |
|
||
| Utilities | 1 | $9B |
|
||
Price history
+201.2% since first listed7 events — show timeline
- 2026-05-31 Listed $75,000 WCAR
- 2025-08-18 Sold (MLS) — SOMO
- 2025-08-03 Pending — SOMO
- 2025-07-07 Price Changed $21,900 SOMO
- 2025-06-09 Listed $24,900 SOMO
- 2022-01-14 Sold (Public Records) — Public Records
- 2018-06-11 Sold (Public Records) — Public Records
Property tax history
+1.1%/yrLatest (2025): $71 · -0.8% YoY. Source: county tax records.
Cash-flow waterfall
monthlySold comps — $/sqft
last 12 mo · ≤1 miLoading sold comps…