461 W Center St · Snowflake, AZ
Flood risk 1/10 · Minimal
- FEMA flood zone
- X (shaded)
- Chance of flooding over 30 yrs
- 0.0%
- Est. flood insurance / yr
- $507 – $1,088
Fire risk 3/10 · Minor
- Est. fire insurance / yr
- $610 – $1,132
Heat risk 3/10 · Minor
- Hot days now (above 93°F)
- 5 days/yr
- Hot days in 30 yrs
- 12 days/yr
Wind risk 1/10 · Minimal
- Chance of severe wind over 30 yrs
- —
Air-quality risk 2/10 · Minimal
- Unhealthy air days now
- 0 days/yr
- Unhealthy air days in 30 yrs
- 1 days/yr
Risk factors via First Street. Map © Google.
Why this score? — see what drove the D grade
The composite is a weighted blend of 9 inputs, each scored 0–100. Each bar is that input's sub-score; the figure is the points it added to the 100-point composite (weight × sub-score).
- Appreciation +10.0/10.0
- Cash flow +7.9/30.0
- ARV discount +7.0/15.0
- Schools +4.6/10.0
- Livability +3.5/5.0
- Rent growth +2.5/5.0
- Condition / age +2.5/5.0
- DSCR +2.0/10.0
- 1% rule +1.3/10.0
$334,000
🖨 Deal sheet 📄 Offer letter ✓ Due diligence
Listing remarks MLS
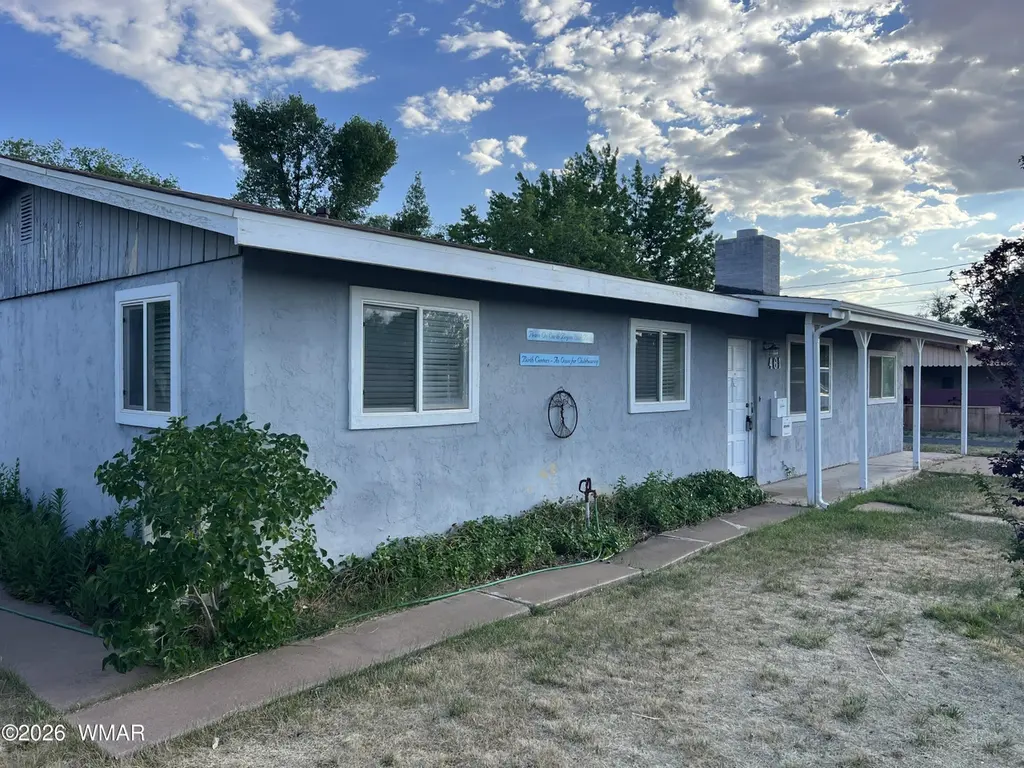
Charming home available in the coveted area of Downtown Snowflake. Walk a couple blocks to the Pioneer Parade and December Town Lighting. Just up the road is the wonderful community Library. You have to see this home to be shocked at the space. 5 bedrooms and 2 living spaces, as well as three full bathrooms. Primary suite and second en suite. The convenience of Center Street without the traffic, as it is tucked back away from main intersections. Developed fruit trees as well as a greenhouse. The cold storage under the greenhouse is a great amenity. The whole yard is on a sprinkler system. Cosmetic updates a real possibility; come with an offer and let's make it work!!!
Key facts
- 8,712 sq ft lot
- Built 1968
- Listed 122 days
Neighborhood map
What this means for you Summary
Snapshot
- This is a 5-bed/3.0-bath single-family listed at $334k.
Deal economics
- At list price, monthly cash flow is $-351 ($-4k/yr) — negative.
- To cash-flow at today's rent, offer at most $272k (18.6% below list).
- To meet the 1% rule (rent ≥ 1% of price), the offer needs to be $209k (37.5% below list).
- Recommended offer: $209k (37.5% below list) — sets the bar for 1% rule.
- Cap rate 5.0% vs local median 2.9% in Snowflake — top-decile yield for the area; either an underpriced asset or a hidden risk that comps aren't pricing in. Stress-test before assuming the spread holds.
Location & tenants
- Location reads 69/100 on livability (#46 in AZ) — a middle-class / working-renter tenant base. Strengths: cost of living A+, housing A+; Watch: employment C-, amenities F, commute F.
- Snowflake Unified District (4391) (town): math 55% / reading 53% proficiency, ranked #36 of 249 in AZ (top 14%) — acceptable for families but not a draw, mixed tenant base, ~2y average lease.
- Market conditions: 290 active listings in the ZIP; 485 units permitted in Navajo County in 2024 (11 in 5+ unit buildings).
Forward outlook
- In year one you build about $36k of equity ($2k loan paydown + $33k appreciation (10.0% local appreciation)).
- Navajo County population projected at -16% by 2050 — secular population decline; favor cash flow + early exit over multi-decade hold.
- By year 2, paydown + projected appreciation supports a ~$57k cash-out refi (75% LTV) — recoverable capital for the next deal without selling this one.
Negotiation context
- It's been on market 122 days — a 12% lower offer ($294k) is reasonable based on typical stale-listing flexibility.
- Current owner paid $190k; list at $334k implies a 76% gain — meaningful room to come down on a strong offer.
Questions for the listing agent
- What do current leases actually rent for vs. the listed asking? Can we see a recent rent roll and the last 12 months of T-12 income?
- It's been on market 122 days. Have you received any prior offers? Is the seller open to a 37% concession, seller financing, or rate buy-down credit?
- Built in 1968 — when were the roof, HVAC, electrical panel, plumbing, and water heater last replaced?
- Why hasn't it sold? Are there any deal-killer items the seller is aware of (foundation, flood, title, zoning, code violations)?
- Is there a deadline driving the sale (1031 exchange, divorce, estate, relocation)? That informs how much negotiation room exists.
- The area grade is low — what's the realistic commute time and amenity access for the typical tenant pool here? Any planned neighborhood developments (good or bad) we should know about?
- What's the average days-on-market for RENTAL listings here right now (not sales)? A rising rental-DOM trend means longer vacancies and softer asking-rent achievability than the comps imply.
- What's the recent tenant-quality profile in this submarket — average credit score on applications, eviction rate, late-payment / NSF rate, and stable-employment percentage? A property-management company in the area should have these aggregated.
- How much new for-sale + rental construction is in the pipeline within 1–3 miles? Heavy new supply typically softens prices + rents 12–24 months out; constrained supply supports both.
Investment metrics
- 1% rule
- 0.63% ✗
- Cap rate
- 5.03%
- Cash-on-cash
- -4.51%
- DSCR
- 0.80
- GRM
- 13.3
CMA / ARV
- ARV (median comp)
- $330,286
- List price
- $334,000
- Delta
- 1.12%
- Verdict
- FAIR
- Comps
- 19 within 1.0 mi
Show comp detail 2 sales within ~0.75 mi
| Address | Dist | Beds/Ba | Sqft | Sold | Price | $/sf | Match |
|---|---|---|---|---|---|---|---|
| 276 N 2nd St | 0.36mi | 5/2.0 | 1,916 (+8%) | 4mo | $330,000 | $172 | 64 |
| 15 N 1st East St | 0.55mi | 4/2.0 (-1) | 1,760 (-1%) | 11mo | $330,000 | $188 | 54 |
Match score weights: distance 35% · size 25% · config 20% · recency 20%. Top-matched comps best support the ARV.
Projected returns pro-forma
10.0% appreciation · 3.0% rent growth · sell at horizon
- IRR
- 21.1%
- Equity multiple
- 2.70×
- Total profit
- $159,373
- Equity at exit
- $300,894
- IRR
- 19.1%
- Equity multiple
- 6.20×
- Total profit
- $486,610
- Equity at exit
- $648,889
Cash invested: $93,520 (down + closing). Projections, not guarantees.
Landlord ↔ Tenant lean methodology
- Overall (STATE)
- 87 Strongly Landlord-Friendly
- State Arizona
- 87 Strongly Landlord-Friendly · R+3
- County
- — inherits STATE
- City
- — inherits STATE
ZIP-level market 85937
- Home prices YoY
- 3.3%
- Active inventory
- 290
- Price-to-rent
- 13.3×
Monthly cashflow live
- Estimated rent
- $2,088 medium interval (Pro) →
- Mortgage (P&I)
- −$1,752
- Tax from tax record
- −$110 /mo · $1,325/yr
- Insurance
- −$139
- HOA
- −$0
- Vacancy / Maint / Mgmt
- −$439
- Net cashflow
- $-351
Break-even live
UW: 25.0% down · 7.5% · 30yr · 1.5% tax · 5.0% vac · 8.0% maint · 8.0% mgmt
Financing live
Cash to close
- Down payment
- $83,500
- Closing costs
- $10,020
- Reserves months
- —
- Total cash needed
- —
Loan-product check · same deal, 3 products live
Conventional
25% down · 7.5% · 30yr
- Down + closing
- —
- Monthly P&I
- —
- Monthly cashflow
- —
- DSCR
- —
- Eligible?
- —
Personal DTI + credit; lowest rate.
DSCR
20% down · 8.5% · 30yr
- Down + closing
- —
- Monthly P&I
- —
- Monthly cashflow
- —
- DSCR
- —
- Eligible?
- —
No personal income docs; deal must DSCR.
Hard money
10% down · 12.0% · 12mo
- Down + closing
- —
- Monthly P&I
- —
- Monthly cashflow
- —
- DSCR
- —
- Eligible?
- —
Short-term bridge; refi at stabilization.
Listing history 22 events
-
2026-06-18days on market $334,000 Active 122 DOM
-
2026-06-17days on market $334,000 Active 121 DOM
-
2026-06-16days on market $334,000 Active 120 DOM
-
2026-06-15days on market $334,000 Active 119 DOM
-
2026-06-14days on market $334,000 Active 117 DOM
-
2026-06-13days on market $334,000 Active 116 DOM
-
2026-06-10days on market $334,000 Active 114 DOM
-
2026-06-09days on market $334,000 Active 113 DOM
-
2026-06-08days on market $334,000 Active 112 DOM
-
2026-06-07days on market $334,000 Active 111 DOM
-
2026-06-05days on market $334,000 Active 108 DOM
-
2026-06-03days on market $334,000 Active 107 DOM
-
2026-06-02days on market $334,000 Active 106 DOM
-
2026-06-01days on market $334,000 Active 105 DOM
-
2026-05-31days on market $334,000 Active 104 DOM
-
2026-05-30days on market $334,000 Active 103 DOM
-
2026-02-16$335,000 Active 680-char remark
Show marketing remark (680 chars)
Charming home available in the coveted area of Downtown Snowflake. Walk a couple blocks to the Pioneer Parade and December Town Lighting. Just up the road is the wonderful community Library. You have to see this home to be shocked at the space. 5 bedrooms and 2 living spaces, as well as three full bathrooms. Primary suite and second en suite. The convenience of Center Street without the traffic, as it is tucked back away from main intersections. Developed fruit trees as well as a greenhouse. The cold storage under the greenhouse is a great amenity. The whole yard is on a sprinkler system. Cosmetic updates a real possibility; come with an offer and let's make it work!!!
-
2025-10-16price $379,000
-
2025-06-04price $413,000
-
2018-04-18soldstatus $189,900
-
2018-04-18soldstatus $189,900
-
2008-12-23soldstatus $150,000
ⓘ Source: listings_history table (triggers on properties + properties_extension) + one-shot
backfill from property_details.listing_events for pre-trigger history.
Tax reassessment forecast AZ · Resets to sale price
- Current annual tax
- $1,325 · $110/mo
- Projected year-2 tax
- $2,204 · $184/mo
- Expected delta
- +$880/yr (+$73/mo · 66.4%)
ⓘ Screening estimate from a state-policy table — verify with the county assessor before closing.
Climate risk First Street
- Flood 1/10 Low FEMA zone X (shaded) · 0% chance over 30 yrs
- Wildfire 3/10 Moderate
- Heat 3/10 Moderate 5 d/yr ≥93°F today · 12 d/yr by 30 yrs out
- Wind 1/10 Low
- Air quality 2/10 Low 0 unhealthy d/yr today · 1 by 30 yrs out
Nearby sold comps map
Loading sold comps map…
Walkable amenities ~0.75 mi
Loading nearby amenities…
Taxation est. · year 1
- Rental income
- $25,060
- − Mortgage interest
- −$18,709
- − Property taxes
- −$1,325
- − Insurance
- −$1,670
- − Repairs & maintenance
- −$2,005
- − Management
- −$2,005
- − Depreciation
- −$9,716
- Taxable loss
- −$10,370
- Est. tax savings @ 24.0%
- +$2,489
- After-tax cash flow
- $-1,727/yr
For passive investors: Depreciation is non-cash, so a rental often shows a tax loss while cash-flowing — sheltering income. Rental losses are passive: they offset passive income freely, and up to $25,000/yr can offset ordinary (W-2) income if you actively participate and your MAGI is under $100k (phasing out to $0 by $150k); unused losses carry forward. On sale, claimed depreciation is recaptured at up to 25%, and gains may owe capital-gains tax (a 1031 exchange can defer both). Figures are a year-1 estimate at your 24.0% rate — not tax advice; consult a CPA.
Schools (NCES district)
- District
- Snowflake Unified District (4391)
- NCES district ID
- 0407820
- Math proficiency
- 55% ▼ -9.00%
- Reading proficiency
- 53% ▼ -2.00%
- Median HH income
- $47,767
- Composite
- 45.91/100
- National rank
- #2545
- State rank
- #36 of 249 in AZ
Livability — Snowflake
- Score
- 69/100
- State rank
- #46
- US rank
- #8817
Category grades
Schools grade is shown separately in the Schools card above.
Census & demographics
- Census place
- Snowflake, AZ
- Population (ZIP)
- 9,975
Population outlook (Navajo County) Hauer SSP2
- Today (2025)
- 105,760 people
- By 2030
- 103,301 · -2.3%
- By 2040
- 97,070 · -8.2%
- By 2050
- 88,850 · -16.0%
- By 2075
- 65,180 · -38.4%
- By 2100
- 37,281 · -64.7%
Race, ethnicity, and origin ACS 2023
- Neighborhood character
- Predominantly White (83%)
- Race & ethnicity
- White 83% Hispanic / Latino 9% Two or more races 7% Black 4%
- Hispanic origin (detail)
- Mexican 7%
- Common ancestry
- Italian 5% Slovak 3% Portuguese 2%
- Foreign-born
- 4% · Canada
- Languages at home
- 90% English-only · Spanish 7% French/Haitian/Cajun 2% German/W. Germanic 1%
Political lean MEDSL · Navajo
- 2024 margin
- R (+17.2) · D 40.9% · R 58.1%
- 2008→2024 swing
- -5.5pp toward R · 2008: -11.7pp · 2024: -17.2pp
- All cycles
- 2024: R+17.2 2020: R+8.2 2016: R+7.9 2012: R+8.4 2008: R+11.7
Not yet ingested
- Civics
- —
Market trends
- HPI YoY
- ▲ 15.31%
- Current HPI
- 480.9577
- Rent YoY
- —
- Metro
- —
- State GDP YoY
- ▲ 4.54%
- F500 in state
- 20
Industry mix (Fortune 500 HQ in AZ)
| Industry | F500 HQs | Revenue |
|---|---|---|
| Technology | 2 | $13B |
|
||
| Mining / Metals | 1 | $23B |
|
||
| Environmental Services | 1 | $16B |
|
||
| Metals / Steel | 1 | $14B |
|
||
| Technology Distribution | 1 | $9B |
|
||
| Homebuilding | 1 | $8B |
|
||
Price history
+123.3% since first listed6 events — show timeline
- 2026-02-16 Listed $335,000 WMMLS
- 2025-10-16 Price Changed $379,000 WMMLS
- 2025-06-04 Price Changed $413,000 WMMLS
- 2018-04-18 Sold (Public Records) $189,900 Public Records
- 2018-04-18 Sold (MLS) $189,900 WMMLS
- 2008-12-23 Sold (Public Records) $150,000 Public Records
Property tax history
+10.6%/yrLatest (2025): $1,325 · +0.3% YoY. Source: county tax records.
Cash-flow waterfall
monthlySold comps — $/sqft
last 12 mo · ≤1 miLoading sold comps…