16690 Cook Rd · Warsaw, KY
Flood risk 1/10 · Minimal
- FEMA flood zone
- X (unshaded)
- Chance of flooding over 30 yrs
- 0.0%
- Est. flood insurance / yr
- $507 – $1,088
Fire risk 3/10 · Minor
- Est. fire insurance / yr
- $717 – $1,331
Heat risk 4/10 · Minor
- Hot days now (above 103°F)
- 7 days/yr
- Hot days in 30 yrs
- 19 days/yr
Wind risk 2/10 · Minimal
- Chance of severe wind over 30 yrs
- 1.0%
Air-quality risk 2/10 · Minimal
- Unhealthy air days now
- 1 days/yr
- Unhealthy air days in 30 yrs
- 2 days/yr
Risk factors via First Street. Map © Google.
Why this score? — see what drove the D grade
The composite is a weighted blend of 9 inputs, each scored 0–100. Each bar is that input's sub-score; the figure is the points it added to the 100-point composite (weight × sub-score).
- ARV discount +15.0/15.0
- Appreciation +6.9/10.0
- Cash flow +6.1/30.0
- Livability +3.1/5.0
- Rent growth +2.5/5.0
- Condition / age +2.5/5.0
- Schools +2.4/10.0
- 1% rule +1.4/10.0
- DSCR +0.5/10.0
$154,900
🖨 Deal sheet (PDF) 📄 Offer letter ✓ Due diligence
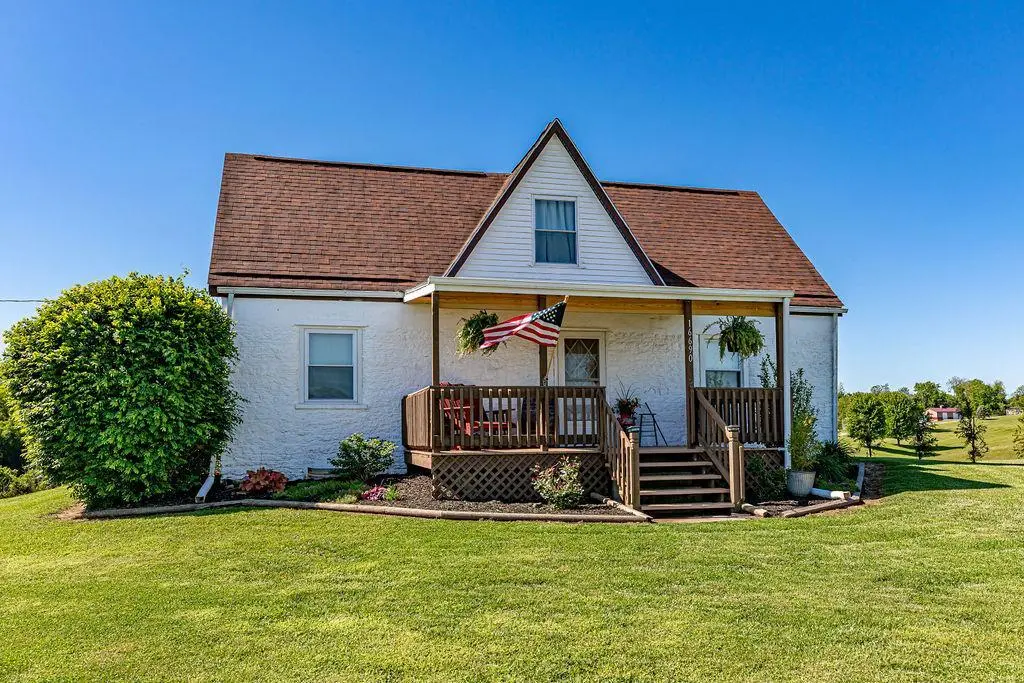
Listing remarks
Charming country home situated on a peaceful road in Switzerland County. This cozy 2-bedroom, 1-bath home features a comfortable living room, dining room, and quaint recently updated kitchen with butcher block counters. Laminate flooring and carpeting are only 3 years old. There is a versatile bonus room perfect for a home office, hobby space, or guest area. The attached 2-car garage provides convenience and additional storage. Peaceful country setting with plenty of room to relax and enjoy the outdoors.
Key facts
- Versatile bonus room
- Hobby space
- Guest area
Tags
Property features AI
Exterior
- Parking: Attached garage (2 car); Off-street parking; Shared driveway; Gravel parking surface
- Utilities: Public water; Septic tank sewer
- Home design: Single-family residence; One and one half levels; 1-story total
- Construction: Vinyl siding; Built with traditional construction materials
- Exterior features: Shingle roof; Has a view; Gravel road surface
Interior
- Kitchen: Gas cooktop, Range, Oven, Refrigerator
- Bathrooms: 1 full bathroom
- Heating & cooling: Forced air heating; Central air conditioning
- Interior features: Gas cooktop, Range, Oven, Refrigerator, Electric water heater; Full unfinished basement with walk-out access
- Laundry & utility: Electric water heater
Neighborhood map
What this means for you Summary
Snapshot
- This is a 2-bed/2.0-bath manufactured listed at $155k.
Deal economics
- At list price, monthly cash flow is $-287 ($-3k/yr) — negative.
- To cash-flow at today's rent, offer at most $113k (26.8% below list).
- To meet the 1% rule (rent ≥ 1% of price), the offer needs to be $99k (36.0% below list).
- Recommended offer: $99k (36.0% below list) — sets the bar for 1% rule.
Location & tenants
- Location reads 61/100 on livability (#376 in KY) — a middle-class / working-renter tenant base. Strengths: cost of living A+, housing A+, crime B+; Watch: employment D+, amenities F, commute F.
- Switzerland County School Corporation (rural): math 25% / reading 31% proficiency, ranked #254 of 301 in IN (top 84%) — low school quality limits family demand, transient renter base, plan for 1-2y turnover.
- Zoned schools: Switzerland Co Middle School (math 17% / reading 28%, grade F, #266 of 330 statewide, top 81%, 244 students, 54% FRL); Switzerland Co Senior High School (math 22% / reading 47%, grade F, #270 of 369 statewide, top 77%, 435 students, 50% FRL).
- Market conditions: 80 units permitted in Switzerland County in 2024 (0 in 5+ unit buildings).
Forward outlook
- In year one you build about $7k of equity ($1k loan paydown + $6k appreciation (3.8% local appreciation)).
- Switzerland County population projected at -14% by 2050 — secular population decline; favor cash flow + early exit over multi-decade hold.
- By year 5, paydown + projected appreciation supports a ~$30k cash-out refi (75% LTV) — recoverable capital for the next deal without selling this one.
Negotiation context
- It's been on market 42 days — a 3% lower offer ($150k) is reasonable based on typical stale-listing flexibility.
Risks & watch-outs
- Watch-outs: built in 1938 — expect roof / HVAC / electrical / plumbing capex.
Questions for the listing agent
- What do current leases actually rent for vs. the listed asking? Can we see a recent rent roll and the last 12 months of T-12 income?
- It's been on market 42 days. Have you received any prior offers? Is the seller open to a 36% concession, seller financing, or rate buy-down credit?
- Built in 1938 — when were the roof, HVAC, electrical panel, plumbing, and water heater last replaced?
- Is there a deadline driving the sale (1031 exchange, divorce, estate, relocation)? That informs how much negotiation room exists.
- Schools are D-rated, which usually means shorter tenancies and higher turnover. Who's the typical renter profile here, and what's been the actual vacancy rate?
- The area grade is low — what's the realistic commute time and amenity access for the typical tenant pool here? Any planned neighborhood developments (good or bad) we should know about?
- What's the average days-on-market for RENTAL listings here right now (not sales)? A rising rental-DOM trend means longer vacancies and softer asking-rent achievability than the comps imply.
- What's the recent tenant-quality profile in this submarket — average credit score on applications, eviction rate, late-payment / NSF rate, and stable-employment percentage? A property-management company in the area should have these aggregated.
- How much new for-sale + rental construction is in the pipeline within 1–3 miles? Heavy new supply typically softens prices + rents 12–24 months out; constrained supply supports both.
Investment metrics
- 1% rule
- 0.64% ✗
- Cap rate
- 4.07%
- Cash-on-cash
- -7.95%
- DSCR
- 0.65
- GRM
- 13.0
CMA / ARV
- ARV (median comp)
- $218,075
- List price
- $154,900
- Delta
- -28.97%
- Verdict
- UNDERPRICED
- Comps
- 7 within 1.0 mi
Projected returns pro-forma
3.8% appreciation · 3.0% rent growth · sell at horizon
- IRR
- 2.7%
- Equity multiple
- 1.16×
- Total profit
- $7,000
- Equity at exit
- $76,696
- IRR
- 5.9%
- Equity multiple
- 1.98×
- Total profit
- $42,688
- Equity at exit
- $123,995
Cash invested: $43,372 (down + closing). Projections, not guarantees.
Landlord ↔ Tenant lean methodology
- Overall (STATE)
- 83 Strongly Landlord-Friendly
- State Kentucky
- 83 Strongly Landlord-Friendly · R+16
- County
- — inherits STATE
- City
- — inherits STATE
ZIP-level market 47020
- Home prices YoY
- 1.8%
- Price-to-rent
- 13.0×
Monthly cashflow live
- Estimated rent
- $991 medium interval (Pro) →
- Mortgage (P&I)
- −$812
- Tax est. 1.5%
- −$194 /mo · $2,324/yr
- Insurance
- −$65
- HOA
- −$0
- Vacancy / Maint / Mgmt
- −$208
- Net cashflow
- $-287
Break-even live
Sensitivity live
| Price | -10% $-180 | -5% $-234 | +0% $-287 | +5% $-341 | +10% $-394 |
|---|---|---|---|---|---|
| Rent | -10% $-366 | -5% $-326 | +0% $-287 | +5% $-248 | +10% $-209 |
| Rate | -1.0pp $-209 | -0.5pp $-248 | base $-287 | +0.5pp $-327 | +1.0pp $-368 |
UW: 25.0% down · 7.5% · 30yr · 1.5% tax · 5.0% vac · 8.0% maint · 8.0% mgmt
Financing live
Cash to close
- Down payment
- $38,725
- Closing costs
- $4,647
- Reserves months
- —
- Total cash needed
- —
Loan-product check · same deal, 3 products live
Conventional
25% down · 7.5% · 30yr
- Down + closing
- —
- Monthly P&I
- —
- Monthly cashflow
- —
- DSCR
- —
- Eligible?
- —
Personal DTI + credit; lowest rate.
DSCR
20% down · 8.5% · 30yr
- Down + closing
- —
- Monthly P&I
- —
- Monthly cashflow
- —
- DSCR
- —
- Eligible?
- —
No personal income docs; deal must DSCR.
Hard money
10% down · 12.0% · 12mo
- Down + closing
- —
- Monthly P&I
- —
- Monthly cashflow
- —
- DSCR
- —
- Eligible?
- —
Short-term bridge; refi at stabilization.
Listing history 18 events
-
2026-06-21days on market $154,900 Active 42 DOM
-
2026-06-21days on market $154,900 Active 41 DOM
-
2026-06-18days on market $154,900 Active 39 DOM
-
2026-06-17days on market $154,900 Active 38 DOM
-
2026-06-16days on market $154,900 Active 37 DOM
-
2026-06-15days on market $154,900 Active 36 DOM
-
2026-06-13days on market $154,900 Active 34 DOM
-
2026-06-12days on market $154,900 Active 33 DOM
-
2026-06-09days on market $154,900 Active 30 DOM
-
2026-06-08days on market $154,900 Active 29 DOM
-
2026-06-07days on market $154,900 Active 28 DOM
-
2026-06-07days on market $154,900 Active 27 DOM
-
2026-06-04days on market $154,900 Active 24 DOM
-
2026-06-02pricedays on market $154,900 Active 23 DOM
-
2026-06-01days on market $165,900 Active 22 DOM
-
2026-05-31days on market $165,900 Active 21 DOM
-
2026-05-31days on market $165,900 Active 20 DOM
-
2026-05-11$165,900 Active 510-char remark
ⓘ Source: listings_history table (triggers on properties + properties_extension) + one-shot
backfill from property_details.listing_events for pre-trigger history.
Climate risk First Street
- Flood 1/10 Low FEMA zone X (unshaded) · 0% chance over 30 yrs
- Wildfire 3/10 Moderate
- Heat 4/10 Moderate 7 d/yr ≥103°F today · 19 d/yr by 30 yrs out
- Wind 2/10 Low 100% chance of damaging wind over 30 yrs
- Air quality 2/10 Low 1 unhealthy d/yr today · 2 by 30 yrs out
Nearby sold comps map
Loading sold comps map…
Walkable amenities ~0.75 mi
Loading nearby amenities…
Taxation est. · year 1
- Rental income
- $11,896
- − Mortgage interest
- −$8,677
- − Property taxes
- −$2,324
- − Insurance
- −$774
- − Repairs & maintenance
- −$952
- − Management
- −$952
- − Depreciation
- −$4,506
- Taxable loss
- −$6,288
- Est. tax savings @ 24.0%
- +$1,509
- After-tax cash flow
- $-1,938/yr
For passive investors: Depreciation is non-cash, so a rental often shows a tax loss while cash-flowing — sheltering income. Rental losses are passive: they offset passive income freely, and up to $25,000/yr can offset ordinary (W-2) income if you actively participate and your MAGI is under $100k (phasing out to $0 by $150k); unused losses carry forward. On sale, claimed depreciation is recaptured at up to 25%, and gains may owe capital-gains tax (a 1031 exchange can defer both). Figures are a year-1 estimate at your 24.0% rate — not tax advice; consult a CPA.
Schools (NCES district)
- District
- Switzerland County School Corporation
- NCES district ID
- 1811220
- Math proficiency
- 25% ▼ -10.00%
- Reading proficiency
- 31% ▼ -9.00%
- Median HH income
- $44,127
- Composite
- 23.96/100
- National rank
- #7780
- State rank
- #254 of 301 in IN
Livability — Warsaw
- Score
- 61/100
- State rank
- #376
- US rank
- #17814
Category grades
Schools grade is shown separately in the Schools card above.
Census & demographics
- Population (ZIP)
- 1,164
Population outlook (Switzerland County) Hauer SSP2
- Today (2025)
- 10,189 people
- By 2030
- 9,909 · -2.7%
- By 2040
- 9,347 · -8.3%
- By 2050
- 8,721 · -14.4%
- By 2075
- 7,542 · -26.0%
- By 2100
- 6,601 · -35.2%
Race, ethnicity, and origin ACS 2023
- Neighborhood character
- Predominantly White (96%)
- Race & ethnicity
- White 96% Two or more races 4% Hispanic / Latino 2%
- Common ancestry
- Romanian 1% Armenian 1%
- Foreign-born
- 1%
- Languages at home
- 98% English-only · Spanish 1%
Political lean MEDSL · Switzerland
- 2024 margin
- Solid R (+57.5) · D 20.5% · R 78.0% · Other 1.5%
- 2008→2024 swing
- -49.2pp toward R · 2008: -8.3pp · 2024: -57.5pp
- All cycles
- 2024: R+57.5 2020: R+52.2 2016: R+44.7 2012: R+12.8 2008: R+8.3
Not yet ingested
- Civics
- —
Market trends
- HPI YoY
- ▲ 3.80%
- Current HPI
- 210.6771
- Rent YoY
- —
- Metro
- —
- State GDP YoY
- ▲ 1.81%
- F500 in state
- 4
Industry mix (Fortune 500 HQ in KY)
| Industry | F500 HQs | Revenue |
|---|---|---|
| Healthcare | 1 | $118B |
|
||
| Food / Beverage | 1 | $7B |
|
||
Price history
-6.6% since first listed2 events — show timeline
- 2026-06-01 Price Changed $154,900 SEIBR
- 2026-05-11 Listed $165,900 SEIBR
Property tax history
-10.2%/yrLatest (2024): $52 · +2.0% YoY. Source: county tax records.
Cash-flow waterfall
monthlySold comps — $/sqft
last 12 mo · ≤1 miLoading sold comps…