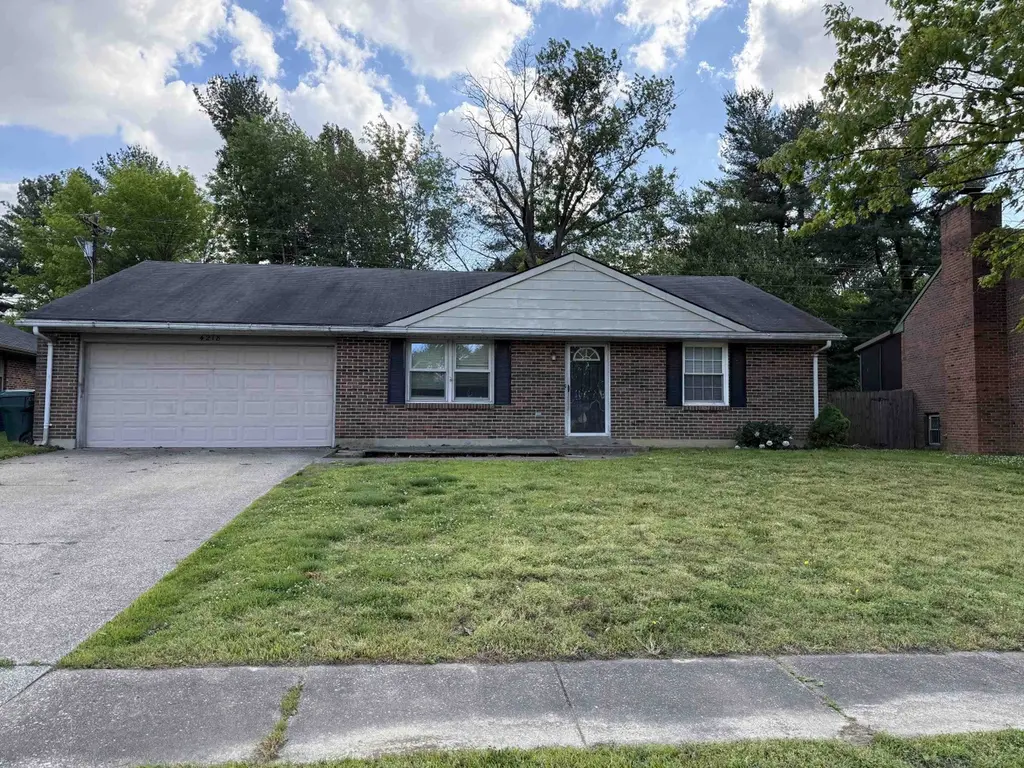
4218 Yewells Lndg W · Owensboro, KY
Flood risk 5/10 · Moderate
- FEMA flood zone
- X (unshaded)
- Chance of flooding over 30 yrs
- 0.66%
- Est. flood insurance / yr
- $507 – $1,088
Fire risk 1/10 · Minimal
- Est. fire insurance / yr
- $839 – $1,559
Heat risk 5/10 · Moderate
- Hot days now (above 108°F)
- 7 days/yr
- Hot days in 30 yrs
- 19 days/yr
Wind risk 2/10 · Minimal
- Chance of severe wind over 30 yrs
- 3.0%
Air-quality risk 2/10 · Minimal
- Unhealthy air days now
- 1 days/yr
- Unhealthy air days in 30 yrs
- 1 days/yr
Risk factors via First Street. Map © Google.
Why this score? — see what drove the D+ grade
The composite is a weighted blend of 9 inputs, each scored 0–100. Each bar is that input's sub-score; the figure is the points it added to the 100-point composite (weight × sub-score).
- ARV discount +15.0/15.0
- Cash flow +14.6/30.0
- DSCR +4.4/10.0
- Livability +3.6/5.0
- 1% rule +3.5/10.0
- Schools +3.2/10.0
- Rent growth +2.5/5.0
- Condition / age +2.5/5.0
- Appreciation +0.0/10.0
$185,000
🖨 Deal sheet (PDF) 📄 Offer letter ✓ Due diligence
Listing remarks MLS
Nice brick ranch in Landsdowne! Must see with great floor plan, new carpet, paint, newer heat & air, replacement windows, some new lighting. Fireplace. Nice backyard backs up to woods and fenced!
Key facts
- 7,656 sq ft lot
- 2 garage spots
- Built 1977
Property features AI
Exterior
- Parking: Attached concrete 2-car garage
- Utilities: Public water; Public sewer; Cable available; Natural gas available
- Home design: Single-family residence; 1 story
- Construction: Brick veneer construction; Composition roof; Slab foundation; Built in 2026
- Exterior features: Porch; Rolling slope lot
Interior
- Kitchen: Range; Refrigerator
- Flooring: Carpet; Vinyl
- Bathrooms: 2 full bathrooms
- Heating & cooling: Forced air heating; Central air conditioning
- Interior features: Walk-in closet(s)
- Laundry & utility: Gas water heater
Neighborhood map
What this means for you Summary
Snapshot
- This is a 3-bed/2.0-bath single-family listed at $185k.
Deal economics
- At list price, monthly cash flow is $44 ($523/yr) — positive.
- The deal already cash-flows at list — no discount required.
- To meet the 1% rule (rent ≥ 1% of price), the offer needs to be $157k (15.3% below list).
- Recommended offer: $157k (15.3% below list) — sets the bar for 1% rule.
- Cap rate 6.6% vs local median 3.1% in Owensboro — top-decile yield for the area; either an underpriced asset or a hidden risk that comps aren't pricing in. Stress-test before assuming the spread holds.
Location & tenants
- Location reads 71/100 on livability (#148 in KY) — a middle-class / working-renter tenant base. Strengths: cost of living A+, housing A+, health & safety B; Watch: employment D+, crime D-, amenities F.
- Daviess County (suburban): math 33% / reading 41% proficiency, ranked #43 of 165 in KY (top 26%) — families likely to look elsewhere, expect single-tenant / working-renter base with shorter leases.
- Zoned schools: Highland Elementary School (math 50% / reading 51%, grade D+, #95 of 676 statewide, top 14%, 474 students, 44% FRL); Daviess County Middle School (math 38% / reading 53%, grade D+, #32 of 217 statewide, top 15%, 813 students, 55% FRL); Daviess County High School (math 40% / reading 41%, grade F, #37 of 254 statewide, top 15%, 1,740 students, 42% FRL) — zoned schools at 47% FRL track the district average.
- Market conditions: 366 active listings in the ZIP; 226 units permitted in Daviess County in 2024 (6 in 5+ unit buildings).
Forward outlook
- Local home prices are declining (-3.0%/yr); year-one equity from $1k of loan paydown is wiped out by about $6k of value loss. Plan a longer hold.
- Daviess County population projected at +6% by 2050 — modest demand growth; plan on rents tracking national, not racing it.
Negotiation context
- Only 8 days on market — expect competitive offers; lowballing is unlikely to land.
- 2 sale attempts since 13y ago; this cycle's ask is 6% above the opening price — seller raised mid-cycle; expect resistance to lowballs.
- Current owner paid $112k; list at $185k implies a 65% gain — meaningful room to come down on a strong offer.
Risks & watch-outs
- Climate carrying-cost: moderate flood risk; extreme-heat days projected 7→19/yr by 2055 (HVAC capex compounding) — expect insurance premiums to compound above CPI over the hold.
Questions for the listing agent
- Built in 1977 — when were the roof, HVAC, electrical panel, plumbing, and water heater last replaced?
- Is there a deadline driving the sale (1031 exchange, divorce, estate, relocation)? That informs how much negotiation room exists.
- Crime grade is D in this area — have there been break-ins, vandalism, or insurance claims at this property in the last 3 years? What carrier currently insures it and at what premium?
- The area grade is low — what's the realistic commute time and amenity access for the typical tenant pool here? Any planned neighborhood developments (good or bad) we should know about?
- What's the average days-on-market for RENTAL listings here right now (not sales)? A rising rental-DOM trend means longer vacancies and softer asking-rent achievability than the comps imply.
- What's the recent tenant-quality profile in this submarket — average credit score on applications, eviction rate, late-payment / NSF rate, and stable-employment percentage? A property-management company in the area should have these aggregated.
- How much new for-sale + rental construction is in the pipeline within 1–3 miles? Heavy new supply typically softens prices + rents 12–24 months out; constrained supply supports both.
Investment metrics
- 1% rule
- 0.85% ✗
- Cap rate
- 6.58%
- Cash-on-cash
- 1.01%
- DSCR
- 1.04
- GRM
- 9.8
CMA / ARV
- ARV (on-the-fly)
- $238,716
- Comps found
- 12
Show comp detail 12 sales within ~0.75 mi
| Address | Dist | Beds/Ba | Sqft | Sold | Price | $/sf | Match |
|---|---|---|---|---|---|---|---|
| 4104 Liberty Pt | 0.14mi | 3/2.0 | 1,387 (-1%) | 1mo | $255,000 | $184 | 92 |
| 2217 Mill Run | 0.06mi | 3/2.0 | 1,452 (+4%) | 3mo | $225,000 | $155 | 88 |
| 2215 Southeastern Pkwy | 0.08mi | 3/2.0 | 1,377 (-1%) | 21mo | $235,000 | $171 | 77 |
| 2330 Southeastern Pkwy | 0.24mi | 3/2.0 | 1,365 (-2%) | 13mo | $245,000 | $179 | 74 |
| 4101 Yewells Landing West | 0.13mi | 3/2.0 | 1,300 (-7%) | 11mo | $214,000 | $165 | 73 |
| 2212 Landing Mdws | 0.09mi | 3/2.0 | 1,320 (-5%) | 18mo | $223,000 | $169 | 72 |
| 4230 Yewells Landing Lndg W | 0.02mi | 3/3.0 | 1,335 (-4%) | 19mo | $195,000 | $146 | 72 |
| 4161 Liberty Pt | 0.04mi | 3/2.0 | 1,505 (+8%) | 17mo | $236,000 | $157 | 71 |
| 2239 Landsdowne S | 0.22mi | 3/2.0 | 1,462 (+5%) | 20mo | $239,900 | $164 | 65 |
| 2328 Landsdowne S | 0.32mi | 3/2.0 | 1,308 (-6%) | 24mo | $242,900 | $186 | 55 |
| 2324 Landsdowne S | 0.30mi | 3/1.0 | 1,189 (-15%) | 23mo | $222,500 | $187 | 38 |
| 4530 Condor Pl | 0.70mi | 2/2.0 (-1) | 1,310 (-6%) | 23mo | $230,050 | $176 | 33 |
Match score weights: distance 35% · size 25% · config 20% · recency 20%. Top-matched comps best support the ARV.
Projected returns pro-forma
-3.0% appreciation · 3.0% rent growth · sell at horizon
- IRR
- -14.7%
- Equity multiple
- 0.47×
- Total profit
- $-27,228
- Equity at exit
- $27,584
- IRR
- -6.1%
- Equity multiple
- 0.61×
- Total profit
- $-20,247
- Equity at exit
- $15,995
Cash invested: $51,800 (down + closing). Projections, not guarantees.
Landlord ↔ Tenant lean methodology
- Overall (STATE)
- 83 Strongly Landlord-Friendly
- State Kentucky
- 83 Strongly Landlord-Friendly · R+16
- County
- — inherits STATE
- City
- — inherits STATE
ZIP-level market 42303
- Home prices YoY
- -29.1%
- Active inventory
- 366
- Price-to-rent
- 9.8×
Monthly cashflow live
- Estimated rent
- $1,567 medium interval (Pro) →
- Mortgage (P&I)
- −$970
- Tax from tax record
- −$147 /mo · $1,763/yr
- Insurance
- −$77
- HOA
- −$0
- Vacancy / Maint / Mgmt
- −$329
- Net cashflow
- $44
Break-even live
Sensitivity live
| Price | -10% $148 | -5% $96 | +0% $44 | +5% $-9 | +10% $-61 |
|---|---|---|---|---|---|
| Rent | -10% $-80 | -5% $-18 | +0% $44 | +5% $106 | +10% $167 |
| Rate | -1.0pp $137 | -0.5pp $91 | base $44 | +0.5pp $-4 | +1.0pp $-53 |
UW: 25.0% down · 7.5% · 30yr · 1.5% tax · 5.0% vac · 8.0% maint · 8.0% mgmt
Financing live
Cash to close
- Down payment
- $46,250
- Closing costs
- $5,550
- Reserves months
- —
- Total cash needed
- —
Loan-product check · same deal, 3 products live
Conventional
25% down · 7.5% · 30yr
- Down + closing
- —
- Monthly P&I
- —
- Monthly cashflow
- —
- DSCR
- —
- Eligible?
- —
Personal DTI + credit; lowest rate.
DSCR
20% down · 8.5% · 30yr
- Down + closing
- —
- Monthly P&I
- —
- Monthly cashflow
- —
- DSCR
- —
- Eligible?
- —
No personal income docs; deal must DSCR.
Hard money
10% down · 12.0% · 12mo
- Down + closing
- —
- Monthly P&I
- —
- Monthly cashflow
- —
- DSCR
- —
- Eligible?
- —
Short-term bridge; refi at stabilization.
Listing history 5 events
-
2026-05-14status Pending
-
2026-05-12price $185,000
-
2026-05-04$175,000 Active
-
2013-09-16soldstatus $112,000 201-char remark
Show marketing remark (201 chars)
Nice brick ranch in Landsdowne! Must see with great floor plan, new carpet, paint, newer heat & air, replacement windows, some new lighting. Fireplace. Nice backyard backs up to woods and fenced!
-
2013-08-06$119,500 201-char remark
Show marketing remark (201 chars)
Nice brick ranch in Landsdowne! Must see with great floor plan, new carpet, paint, newer heat & air, replacement windows, some new lighting. Fireplace. Nice backyard backs up to woods and fenced!
ⓘ Source: listings_history table (triggers on properties + properties_extension) + one-shot
backfill from property_details.listing_events for pre-trigger history.
Tax reassessment forecast KY · Resets to sale price
- Current annual tax
- $1,763 · $147/mo
- Projected year-2 tax
- $1,763 · $147/mo
- Expected delta
- $0/yr ($0/mo · 0.0%)
ⓘ Screening estimate from a state-policy table — verify with the county assessor before closing.
Climate risk First Street
- Flood 5/10 Major FEMA zone X (unshaded) · 66% chance over 30 yrs
- Wildfire 1/10 Low
- Heat 5/10 Major 7 d/yr ≥108°F today · 19 d/yr by 30 yrs out
- Wind 2/10 Low 3% chance of damaging wind over 30 yrs
- Air quality 2/10 Low 1 unhealthy d/yr today · 1 by 30 yrs out
Nearby sold comps map
Loading sold comps map…
Walkable amenities ~0.75 mi
Loading nearby amenities…
Taxation est. · year 1
- Rental income
- $18,801
- − Mortgage interest
- −$10,363
- − Property taxes
- −$1,763
- − Insurance
- −$925
- − Repairs & maintenance
- −$1,504
- − Management
- −$1,504
- − Depreciation
- −$5,382
- Taxable loss
- −$2,639
- Est. tax savings @ 24.0%
- +$633
- After-tax cash flow
- $1,157/yr
For passive investors: Depreciation is non-cash, so a rental often shows a tax loss while cash-flowing — sheltering income. Rental losses are passive: they offset passive income freely, and up to $25,000/yr can offset ordinary (W-2) income if you actively participate and your MAGI is under $100k (phasing out to $0 by $150k); unused losses carry forward. On sale, claimed depreciation is recaptured at up to 25%, and gains may owe capital-gains tax (a 1031 exchange can defer both). Figures are a year-1 estimate at your 24.0% rate — not tax advice; consult a CPA.
Schools (NCES district)
- District
- Daviess County
- NCES district ID
- 2101470
- Math proficiency
- 33% ▼ -17.00%
- Reading proficiency
- 41% ▼ -16.00%
- Median HH income
- $52,303
- Composite
- 32.2/100
- National rank
- #5778
- State rank
- #43 of 165 in KY
Livability — Owensboro
- Score
- 71/100
- State rank
- #148
- US rank
- #7153
Category grades
Schools grade is shown separately in the Schools card above.
Census & demographics
- Census place
- Owensboro, KY
- County
- Daviess County · 87,564 people
- Metro
- Owensboro, KY
- Population (ZIP)
- 42,119
- Household income
- $64,773
- Rent vs Own
- Severe rent burden
- 983.0
Population outlook (Daviess County) Hauer SSP2
- Today (2025)
- 103,810 people
- By 2030
- 105,722 · +1.8%
- By 2040
- 108,731 · +4.7%
- By 2050
- 110,295 · +6.2%
- By 2075
- 113,056 · +8.9%
- By 2100
- 106,257 · +2.4%
Race, ethnicity, and origin ACS 2023
- Neighborhood character
- Predominantly White (85%)
- Race & ethnicity
- White 85% Hispanic / Latino 5% Two or more races 5% Black 3% Asian 2%
- Common ancestry
- Italian 2% Slovak 1% Lithuanian 1%
- Foreign-born
- 4% · Canada, Philippines
- Languages at home
- 94% English-only · Spanish 3% Other Indo-European 1% Other Asian/Pacific 1%
Political lean MEDSL · Daviess
- 2024 margin
- Solid R (+31.9) · D 33.3% · R 65.2% · Other 1.5%
- 2008→2024 swing
- -21.8pp toward R · 2008: -10.1pp · 2024: -31.9pp
- All cycles
- 2024: R+31.9 2020: R+27.9 2016: R+32.2 2012: R+21.1 2008: R+10.1
Not yet ingested
- Civics
- —
Market trends
- HPI YoY
- ▼ -89.55%
- Current HPI
- 217.7128
- Rent YoY
- —
- Metro
- Owensboro, KY
- State GDP YoY
- ▲ 1.81%
- F500 in state
- 4
Industry mix (Fortune 500 HQ in KY)
| Industry | F500 HQs | Revenue |
|---|---|---|
| Healthcare | 1 | $118B |
|
||
| Food / Beverage | 1 | $7B |
|
||
Price history
+54.8% since first listed5 events — show timeline
- 2026-05-14 Pending — GORAMLS
- 2026-05-12 Price Changed $185,000 GORAMLS
- 2026-05-04 Listed $175,000 GORAMLS
- 2013-09-16 Sold (MLS) $112,000 GORAMLS
- 2013-08-06 Listed $119,500 GORAMLS
Property tax history
+4.2%/yrLatest (2025): $1,763 · +21.5% YoY. Source: county tax records.
Cash-flow waterfall
monthlySold comps — $/sqft
last 12 mo · ≤1 miLoading sold comps…