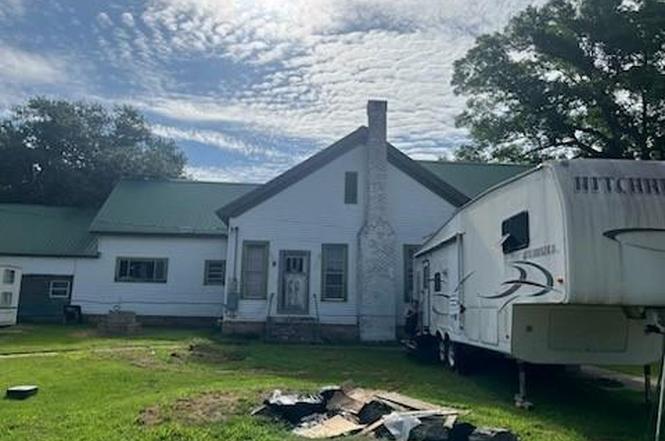
208 Cedar St · Bernice, LA
Flood risk No data
- FEMA flood zone
- —
- Chance of flooding over 30 yrs
- —
- Est. flood insurance / yr
- —
Fire risk No data
- Est. fire insurance / yr
- —
Heat risk No data
- Hot days now (above threshold)
- —
- Hot days in 30 yrs
- —
Wind risk No data
- Chance of severe wind over 30 yrs
- —
Air-quality risk No data
- Unhealthy air days now
- —
- Unhealthy air days in 30 yrs
- —
Risk factors via First Street. Map © Google.
Why this score? — see what drove the B grade
The composite is a weighted blend of 9 inputs, each scored 0–100. Each bar is that input's sub-score; the figure is the points it added to the 100-point composite (weight × sub-score).
- Cash flow +30.0/30.0
- 1% rule +10.0/10.0
- DSCR +10.0/10.0
- ARV discount +7.5/15.0
- Appreciation +5.0/10.0
- Livability +3.4/5.0
- Rent growth +2.5/5.0
- Condition / age +2.5/5.0
- Schools +1.3/10.0
$50,000
🖨 Deal sheet 📄 Offer letter ✓ Due diligence
Listing remarks
Welcome to 208 Cedar Street in Bernice, Louisiana! Situated on a generous 0.52-acre lot, this well-maintained 3-bedroom, 2-bath home offers 1,916 square feet of comfortable living space in an established neighborhood. Built in 1965, this home combines classic charm with practical features, including a durable metal roof and covered carport for added convenience. Inside, you'll find spacious living areas with plenty of room for family gatherings, entertaining, or simply relaxing at home. The functional floor plan provides comfortable bedrooms, ample storage, and the flexibility to make the space your own. The large lot offers endless possibilities for outdoor enjoyment, gardening, recreation
Key facts
- Metal roof
- 0.52 acre lot
- Covered carport
Tags
Property features AI
Finance
- Other: Possession at closing/funding; Listing status: Active; Listing agreement: Exclusive right to sell; Photos available (9)
- Financial info: Treat as clear loan type; No second mortgage
- HOA & community: No HOA (no association)
Exterior
- Parking: Attached 1-car garage; Covered parking for 1 vehicle; Additional parking and driveway space
- Security: No specific security features listed
- Utilities: City water; City sewer; Electricity available and connected; Not in a municipal utility district
- Home design: Single family residence; Residential property; One level; Built in 1965; Not attached to another property
- Construction: Year built 1965; No construction material, roof, or foundation details provided
- Exterior features: Lot is approximately 0.52 acres; Directions: From I-20, take US-167 N to Bernice, turn onto LA-2 E, then right on Cedar St. Home on right at 208 Cedar St.; Subdivision: Bernice Original Plat 1; County: Union; Country: United States
Interior
- Kitchen: Electric oven; Electric range; Refrigerator; Gas water heater
- Bedrooms: Primary bedroom on main level; Two additional bedrooms on main level (total 3 bedrooms)
- Flooring: No flooring details provided
- Bathrooms: Two full bathrooms
- Heating & cooling: No specific heating or cooling systems listed
- Interior features: Flat screen wiring; Other
- Laundry & utility: No specific laundry details provided
Neighborhood map
What this means for you Summary
Snapshot
- This is a 4-bed/2.0-bath single-family listed at $50k.
Deal economics
- At list price, monthly cash flow is $617 ($7k/yr) — positive.
- The deal already cash-flows at list — no discount required.
- Meets the 1% rule at list price ($1k rent vs $50k).
Location & tenants
- Location reads 67/100 on livability (#113 in LA) — a middle-class / working-renter tenant base. Strengths: cost of living A+, housing A+, health & safety A+; Watch: schools F, amenities F, commute F.
- Union Parish (rural): math 12% / reading 20% proficiency, ranked #74 of 98 in LA (top 76%) — low school quality limits family demand, transient renter base, plan for 1-2y turnover; 76% free/reduced lunch — lower-income household profile, screen leases tightly.
- Market conditions: 18 active listings in the ZIP; 2 units permitted in Union Parish in 2024 (0 in 5+ unit buildings).
Forward outlook
- In year one you build about $320 of equity ($346 loan paydown + $-26 appreciation (-0.1% local appreciation)).
- Union County population projected at -14% by 2050 — secular population decline; favor cash flow + early exit over multi-decade hold.
- At projected returns (-0.1% appreciation + 3.0% rent growth), your $14k cash investment doubles in ~2 years — after that, you're playing with house money.
Negotiation context
- Only 8 days on market — expect competitive offers; lowballing is unlikely to land.
- 2 sale attempts since 6y ago; this cycle's ask has dropped $20k (29%) from the opening price — seller is motivated, your offer sets the floor, not the list.
Questions for the listing agent
- Built in 1965 — when were the roof, HVAC, electrical panel, plumbing, and water heater last replaced?
- Is there a deadline driving the sale (1031 exchange, divorce, estate, relocation)? That informs how much negotiation room exists.
- Schools are F-rated, which usually means shorter tenancies and higher turnover. Who's the typical renter profile here, and what's been the actual vacancy rate?
- What's the average days-on-market for RENTAL listings here right now (not sales)? A rising rental-DOM trend means longer vacancies and softer asking-rent achievability than the comps imply.
- What's the recent tenant-quality profile in this submarket — average credit score on applications, eviction rate, late-payment / NSF rate, and stable-employment percentage? A property-management company in the area should have these aggregated.
- How much new for-sale + rental construction is in the pipeline within 1–3 miles? Heavy new supply typically softens prices + rents 12–24 months out; constrained supply supports both.
Investment metrics
- 1% rule
- 2.38% ✓
- Cap rate
- 21.11%
- Cash-on-cash
- 52.91%
- DSCR
- 3.35
- GRM
- 3.5
CMA / ARV
No comps found within radius.
Projected returns pro-forma
-0.05% appreciation · 3.0% rent growth · sell at horizon
- IRR
- 54.4%
- Equity multiple
- 3.70×
- Total profit
- $37,734
- Equity at exit
- $14,390
- IRR
- 56.9%
- Equity multiple
- 7.42×
- Total profit
- $89,919
- Equity at exit
- $17,195
Cash invested: $14,000 (down + closing). Projections, not guarantees.
Landlord ↔ Tenant lean methodology
- Overall (STATE)
- 90 Strongly Landlord-Friendly
- State Louisiana
- 90 Strongly Landlord-Friendly · R+12
- County
- — inherits STATE
- City
- — inherits STATE
ZIP-level market 71222
- Home prices YoY
- -0.1%
- Active inventory
- 18
- Price-to-rent
- 3.5×
Monthly cashflow live
- Estimated rent
- $1,190 medium interval (Pro) →
- Mortgage (P&I)
- −$262
- Tax from tax record
- −$40 /mo · $479/yr
- Insurance
- −$21
- HOA
- −$0
- Vacancy / Maint / Mgmt
- −$250
- Net cashflow
- $617
Break-even live
UW: 25.0% down · 7.5% · 30yr · 1.5% tax · 5.0% vac · 8.0% maint · 8.0% mgmt
Financing live
Cash to close
- Down payment
- $12,500
- Closing costs
- $1,500
- Reserves months
- —
- Total cash needed
- —
Loan-product check · same deal, 3 products live
Conventional
25% down · 7.5% · 30yr
- Down + closing
- —
- Monthly P&I
- —
- Monthly cashflow
- —
- DSCR
- —
- Eligible?
- —
Personal DTI + credit; lowest rate.
DSCR
20% down · 8.5% · 30yr
- Down + closing
- —
- Monthly P&I
- —
- Monthly cashflow
- —
- DSCR
- —
- Eligible?
- —
No personal income docs; deal must DSCR.
Hard money
10% down · 12.0% · 12mo
- Down + closing
- —
- Monthly P&I
- —
- Monthly cashflow
- —
- DSCR
- —
- Eligible?
- —
Short-term bridge; refi at stabilization.
Listing history 8 events
-
2026-06-19days on market $50,000 Active 8 DOM
-
2026-06-18days on market $50,000 Active 7 DOM
-
2026-06-17days on market $50,000 Active 6 DOM
-
2026-06-16days on market $50,000 Active 5 DOM
-
2026-06-15pricedays on market $50,000 Active 4 DOM
-
2026-06-14days on market $70,000 Active 2 DOM
-
2026-06-13remarks 699-char remark
-
2026-06-13$70,000 Active 1 DOM
ⓘ Source: listings_history table (triggers on properties + properties_extension) + one-shot
backfill from property_details.listing_events for pre-trigger history.
Tax reassessment forecast LA · Resets to sale price
- Current annual tax
- $479 · $40/mo
- Projected year-2 tax
- $479 · $40/mo
- Expected delta
- $0/yr ($0/mo · 0.0%)
ⓘ Screening estimate from a state-policy table — verify with the county assessor before closing.
Nearby sold comps map
Loading sold comps map…
Walkable amenities ~0.75 mi
Loading nearby amenities…
Taxation est. · year 1
- Rental income
- $14,281
- − Mortgage interest
- −$2,801
- − Property taxes
- −$479
- − Insurance
- −$250
- − Repairs & maintenance
- −$1,142
- − Management
- −$1,142
- − Depreciation
- −$1,455
- Taxable income
- $7,012
- Est. tax owed @ 24.0%
- −$1,683
- After-tax cash flow
- $5,724/yr
For passive investors: Depreciation is non-cash, so a rental often shows a tax loss while cash-flowing — sheltering income. Rental losses are passive: they offset passive income freely, and up to $25,000/yr can offset ordinary (W-2) income if you actively participate and your MAGI is under $100k (phasing out to $0 by $150k); unused losses carry forward. On sale, claimed depreciation is recaptured at up to 25%, and gains may owe capital-gains tax (a 1031 exchange can defer both). Figures are a year-1 estimate at your 24.0% rate — not tax advice; consult a CPA.
Schools (NCES district)
- District
- Union Parish
- NCES district ID
- 2201770
- Math proficiency
- 12% ▼ -37.00%
- Reading proficiency
- 20% ▼ -34.00%
- Median HH income
- $37,279
- Composite
- 13.35/100
- National rank
- #9537
- State rank
- #74 of 98 in LA
Livability — Bernice
- Score
- 67/100
- State rank
- #113
- US rank
- #11136
Category grades
Schools grade is shown separately in the Schools card above.
Census & demographics
- Census place
- Bernice, LA
- City population
- 2,621
- Population (ZIP)
- 2,621
Population outlook (Union County) Hauer SSP2
- Today (2025)
- 21,722 people
- By 2030
- 21,226 · -2.3%
- By 2040
- 20,026 · -7.8%
- By 2050
- 18,682 · -14.0%
- By 2075
- 15,725 · -27.6%
- By 2100
- 12,509 · -42.4%
Race, ethnicity, and origin ACS 2023
- Neighborhood character
- Diverse neighborhood (Simpson 0.57)
- Race & ethnicity
- White 56% Black 33% Hispanic / Latino 9% Two or more races 5%
- Hispanic origin (detail)
- Mexican 8%
- Common ancestry
- Slovak 1% Lithuanian 1% Italian 1%
- Foreign-born
- 5% · Canada
- Languages at home
- 94% English-only · Spanish 6%
Political lean MEDSL · Union
- 2024 margin
- Solid R (+57.0) · D 21.1% · R 78.0%
- 2008→2024 swing
- -15.4pp toward R · 2008: -41.5pp · 2024: -57.0pp
- All cycles
- 2024: R+57.0 2020: R+51.4 2016: R+48.5 2012: R+41.7 2008: R+41.5
Not yet ingested
- Civics
- —
Market trends
- HPI YoY
- ▼ -0.05%
- Current HPI
- 77.4222
- Rent YoY
- —
- Metro
- —
- State GDP YoY
- ▲ 3.29%
- F500 in state
- 10
Industry mix (Fortune 500 HQ in LA)
| Industry | F500 HQs | Revenue |
|---|---|---|
| Telecommunications | 2 | $23B |
|
||
| Utilities | 1 | $12B |
|
||
| Wholesale / Distribution | 1 | $5B |
|
||
| Advertising | 1 | $2B |
|
||
Price history
+12.9% since first listed2 events — show timeline
- 2026-06-10 Listed $70,000 NTREIS
- 2020-01-22 Listed $62,000 NELABOR
Property tax history
-0.7%/yrLatest (2025): $479 · +0.0% YoY. Source: county tax records.
Cash-flow waterfall
monthlySold comps — $/sqft
last 12 mo · ≤1 miLoading sold comps…