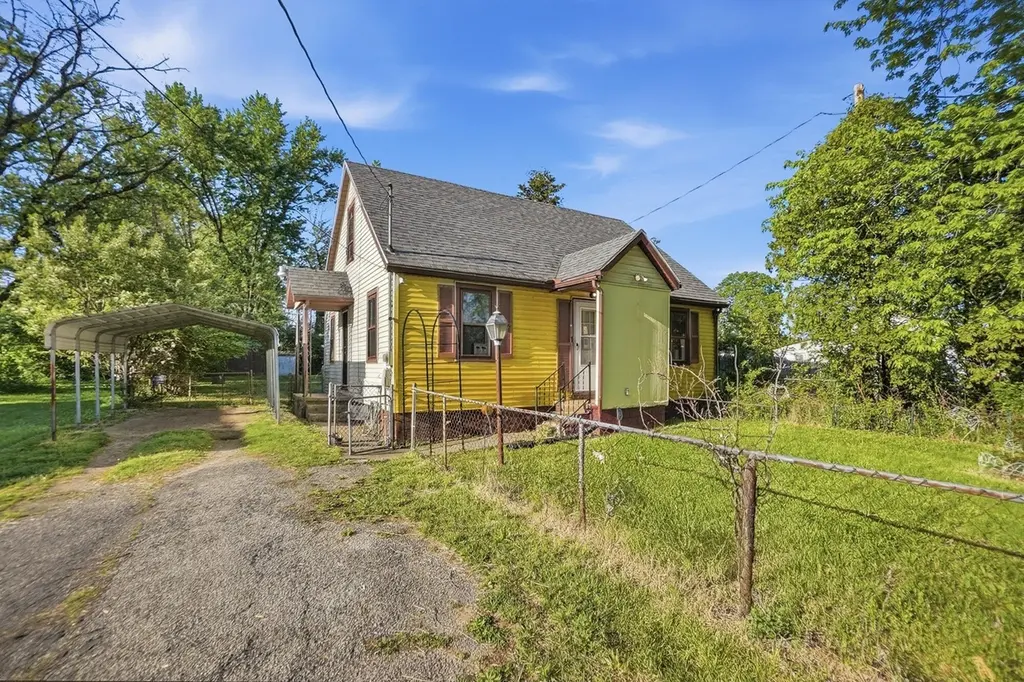
505 Highview Ave · Springfield, OH
Flood risk 1/10 · Minimal
- FEMA flood zone
- X (unshaded)
- Chance of flooding over 30 yrs
- 0.0%
- Est. flood insurance / yr
- $473 – $860
Fire risk 1/10 · Minimal
- Est. fire insurance / yr
- $713 – $1,323
Heat risk 3/10 · Minor
- Hot days now (above 99°F)
- 7 days/yr
- Hot days in 30 yrs
- 17 days/yr
Wind risk 2/10 · Minimal
- Chance of severe wind over 30 yrs
- 0.0%
Air-quality risk 3/10 · Minor
- Unhealthy air days now
- 2 days/yr
- Unhealthy air days in 30 yrs
- 3 days/yr
Risk factors via First Street. Map © Google.
Why this score? — see what drove the D grade
The composite is a weighted blend of 9 inputs, each scored 0–100. Each bar is that input's sub-score; the figure is the points it added to the 100-point composite (weight × sub-score).
- Cash flow +13.4/30.0
- ARV discount +8.7/15.0
- 1% rule +5.4/10.0
- Schools +5.0/10.0
- DSCR +4.0/10.0
- Livability +2.8/5.0
- Rent growth +2.5/5.0
- Condition / age +2.5/5.0
- Appreciation +0.0/10.0
$134,000
🖨 Deal sheet (PDF) 📄 Offer letter ✓ Due diligence
Listing remarks MLS
Welcome home to this Cape Cod style home with a full unfinished basement. The roof has recently been replaced with dimensional shingles. This home has a ton of potential, just needs some TLC. The home is being sold as-is.
Key facts
- New furnace
- New water softener
- Generous lot
Tags
Property features AI
Exterior
- Parking: Carport
- Utilities: Well water; Public sewer
- Home design: Single-family residence; Residential property; Built in 1940
- Construction: Vinyl siding; Block foundation
- Exterior features: Porch; Residential lot
Interior
- Kitchen: Range; Microwave
- Bedrooms: Three bedrooms
- Flooring: Carpet; Vinyl; Wood
- Bathrooms: One full bathroom
- Heating & cooling: Forced air heating; Natural gas
- Interior features: Six total rooms; Full, unfinished basement with block foundation
Neighborhood map
What this means for you Summary
Snapshot
- This is a 3-bed/1.0-bath single-family listed at $134k.
Deal economics
- At list price, monthly cash flow is $3 ($37/yr) — positive.
- The deal already cash-flows at list — no discount required.
- Meets the 1% rule at list price ($1k rent vs $134k).
- Recommended offer: $130k (3.0% below list) — sets the bar for market timing.
- Cap rate 6.3% vs local median 4.7% in Springfield — top-decile yield for the area; either an underpriced asset or a hidden risk that comps aren't pricing in. Stress-test before assuming the spread holds.
Location & tenants
- Location reads 56/100 on livability (#1,108 in OH) — a working-class tenant base; expect higher turnover. Strengths: cost of living A+, housing A+; Watch: crime F, amenities F, commute F.
- Clark-Shawnee Local (rural): math 54% / reading 62% proficiency, ranked #301 of 656 in OH (top 46%) — acceptable for families but not a draw, mixed tenant base, ~2y average lease.
- Zoned schools: Shawnee Elementary School (math 47% / reading 52%, grade D, #906 of 1,584 statewide, top 59%, 1,010 students, 46% FRL); Shawnee Middle School/High School (math 47% / reading 67%, grade C, #275 of 781 statewide, top 37%, 687 students, 46% FRL).
- Market conditions: 158 active listings in the ZIP; 3 comparable units currently listed for rent nearby; rentals at typical pace (median 26d on market — plan ~3-4 weeks tenant-placement turnaround); lower-income renter base — watch delinquency; 232 units permitted in Clark County in 2024 (116 in 5+ unit buildings).
- This rent runs 38% of the median local income ($44k/yr) — at the standard rent-burdened threshold; future hikes will face affordability resistance.
Forward outlook
- Local home prices are declining (-3.0%/yr); year-one equity from $926 of loan paydown is wiped out by about $4k of value loss. Plan a longer hold.
- Clark County population projected at -16% by 2050 — secular population decline; favor cash flow + early exit over multi-decade hold.
Negotiation context
- It's been on market 59 days — a 3% lower offer ($130k) is reasonable based on typical stale-listing flexibility.
- 3 sale attempts since 4y ago with the ask held roughly flat each time — persistent listings suggest the price (not the market) is what's stuck; bring a comps-based counter.
- Current owner paid $70k; list at $134k implies a 91% gain — meaningful room to come down on a strong offer.
Risks & watch-outs
- Watch-outs: property tax is 3.1% of price; built in 1940 — expect roof / HVAC / electrical / plumbing capex.
Questions for the listing agent
- It's been on market 59 days. Have you received any prior offers? Is the seller open to a 3% concession, seller financing, or rate buy-down credit?
- Built in 1940 — when were the roof, HVAC, electrical panel, plumbing, and water heater last replaced?
- Property tax is high relative to price — has the assessment been appealed recently, and will the sale trigger a re-assessment?
- Is there a deadline driving the sale (1031 exchange, divorce, estate, relocation)? That informs how much negotiation room exists.
- Crime grade is F in this area — have there been break-ins, vandalism, or insurance claims at this property in the last 3 years? What carrier currently insures it and at what premium?
- The area grade is low — what's the realistic commute time and amenity access for the typical tenant pool here? Any planned neighborhood developments (good or bad) we should know about?
- What's the average days-on-market for RENTAL listings here right now (not sales)? A rising rental-DOM trend means longer vacancies and softer asking-rent achievability than the comps imply.
- What's the recent tenant-quality profile in this submarket — average credit score on applications, eviction rate, late-payment / NSF rate, and stable-employment percentage? A property-management company in the area should have these aggregated.
- How much new for-sale + rental construction is in the pipeline within 1–3 miles? Heavy new supply typically softens prices + rents 12–24 months out; constrained supply supports both.
Investment metrics
- 1% rule
- 1.04% ✓
- Cap rate
- 6.32%
- Cash-on-cash
- 0.10%
- DSCR
- 1.00
- GRM
- 8.0
CMA / ARV
- ARV (median comp)
- $137,757
- List price
- $134,000
- Delta
- -2.73%
- Verdict
- FAIR
- Comps
- 20 within 1.0 mi
Show comp detail 6 sales within ~0.75 mi
| Address | Dist | Beds/Ba | Sqft | Sold | Price | $/sf | Match |
|---|---|---|---|---|---|---|---|
| 533 Lyle Ave | 0.15mi | 3/1.0 | 1,064 (-3%) | 2mo | $147,000 | $138 | 87 |
| 533 Highview Ave | 0.03mi | 2/1.0 (-1) | 972 (-11%) | 2mo | $70,000 | $72 | 73 |
| 2825 Linden Ave | 0.18mi | 3/1.0 | 1,064 (-3%) | 23mo | $165,000 | $155 | 68 |
| 157 Kinnane Ave | 0.28mi | 3/1.0 | 1,173 (+7%) | 23mo | $35,100 | $30 | 56 |
| 227 Kinnane Ave | 0.22mi | 3/1.0 | 972 (-11%) | 19mo | $129,900 | $134 | 55 |
| 348 Lyle Ave | 0.22mi | 3/1.0 | 956 (-12%) | 23mo | $150,000 | $157 | 50 |
Match score weights: distance 35% · size 25% · config 20% · recency 20%. Top-matched comps best support the ARV.
Projected returns pro-forma
-3.0% appreciation · 3.0% rent growth · sell at horizon
- IRR
- -16.0%
- Equity multiple
- 0.43×
- Total profit
- $-21,388
- Equity at exit
- $19,980
- IRR
- -7.5%
- Equity multiple
- 0.52×
- Total profit
- $-17,845
- Equity at exit
- $11,586
Cash invested: $37,520 (down + closing). Projections, not guarantees.
Landlord ↔ Tenant lean methodology
- Overall (STATE)
- 73 Landlord-Friendly
- State Ohio
- 73 Landlord-Friendly · R+6
- County
- — inherits STATE
- City
- — inherits STATE
ZIP-level market 45505
- Home prices YoY
- -34.3%
- Active inventory
- 158
- Price-to-rent
- 8.0×
Monthly cashflow live
- Estimated rent
- $1,399 medium interval (Pro) →
- Mortgage (P&I)
- −$703
- Tax from tax record
- −$344 /mo · $4,125/yr
- Insurance
- −$56
- HOA
- −$0
- Vacancy / Maint / Mgmt
- −$294
- Net cashflow
- $3
Break-even live
Sensitivity live
| Price | -10% $79 | -5% $41 | +0% $3 | +5% $-35 | +10% $-73 |
|---|---|---|---|---|---|
| Rent | -10% $-107 | -5% $-52 | +0% $3 | +5% $58 | +10% $114 |
| Rate | -1.0pp $71 | -0.5pp $37 | base $3 | +0.5pp $-32 | +1.0pp $-67 |
UW: 25.0% down · 7.5% · 30yr · 1.5% tax · 5.0% vac · 8.0% maint · 8.0% mgmt
Financing live
Cash to close
- Down payment
- $33,500
- Closing costs
- $4,020
- Reserves months
- —
- Total cash needed
- —
Loan-product check · same deal, 3 products live
Conventional
25% down · 7.5% · 30yr
- Down + closing
- —
- Monthly P&I
- —
- Monthly cashflow
- —
- DSCR
- —
- Eligible?
- —
Personal DTI + credit; lowest rate.
DSCR
20% down · 8.5% · 30yr
- Down + closing
- —
- Monthly P&I
- —
- Monthly cashflow
- —
- DSCR
- —
- Eligible?
- —
No personal income docs; deal must DSCR.
Hard money
10% down · 12.0% · 12mo
- Down + closing
- —
- Monthly P&I
- —
- Monthly cashflow
- —
- DSCR
- —
- Eligible?
- —
Short-term bridge; refi at stabilization.
Rent comps 3 comps
| Address | Beds | Baths | Sqft | Rent | $/sqft | DOM | Units | Dist |
|---|---|---|---|---|---|---|---|---|
| 421 Catherine St Springfield, OH | 3.0 | 2.0 | 1498 | $1,500 | $1.00 | 45d | 1 | 1.39mi |
| 313 E Rose St Springfield, OH | 3.0 | 1.0 | 828 | $1,200 | $1.45 | 25d | 1 | 1.47mi |
| 2406 Springfield Xenia Rd Springfield, OH | 3.0 | 2.0 | 1300 | $1,650 | $1.27 | 4d | 1 | 1.49mi |
Listing history 27 events
-
2026-06-22days on market $134,000 Active 59 DOM
-
2026-06-19days on market $134,000 Active 56 DOM
-
2026-06-18days on market $134,000 Active 55 DOM
-
2026-06-17days on market $134,000 Active 54 DOM
-
2026-06-16pricedays on market $134,000 Active 53 DOM
-
2026-06-15days on market $140,000 Active 52 DOM
-
2026-06-14days on market $140,000 Active 50 DOM
-
2026-06-12days on market $140,000 Active 49 DOM
-
2026-06-09days on market $140,000 Active 46 DOM
-
2026-06-08days on market $140,000 Active 45 DOM
-
2026-06-07days on market $140,000 Active 44 DOM
-
2026-06-05days on market $140,000 Active 41 DOM
-
2026-06-03days on market $140,000 Active 40 DOM
-
2026-06-02days on market $140,000 Active 39 DOM
-
2026-06-01days on market $140,000 Active 38 DOM
-
2026-05-31days on market $140,000 Active 37 DOM
-
2026-05-30days on market $140,000 Active 36 DOM
-
2026-04-24$140,000 Active 644-char remark
-
2026-04-03historical
-
2026-02-26price $129,000
-
2026-01-31$134,000 Active
-
2022-12-13soldstatus $70,000
-
2022-12-09soldstatus $70,000 Closed
Show marketing remark (221 chars)
Welcome home to this Cape Cod style home with a full unfinished basement. The roof has recently been replaced with dimensional shingles. This home has a ton of potential, just needs some TLC. The home is being sold as-is.
-
2022-12-09soldstatus $70,000 Sold
Show marketing remark (221 chars)
Welcome home to this Cape Cod style home with a full unfinished basement. The roof has recently been replaced with dimensional shingles. This home has a ton of potential, just needs some TLC. The home is being sold as-is.
-
2022-11-28historical Active/Pending
Show marketing remark (221 chars)
Welcome home to this Cape Cod style home with a full unfinished basement. The roof has recently been replaced with dimensional shingles. This home has a ton of potential, just needs some TLC. The home is being sold as-is.
-
2022-11-21price $79,900
Show marketing remark (221 chars)
Welcome home to this Cape Cod style home with a full unfinished basement. The roof has recently been replaced with dimensional shingles. This home has a ton of potential, just needs some TLC. The home is being sold as-is.
-
2022-11-18$89,900 Active
Show marketing remark (221 chars)
Welcome home to this Cape Cod style home with a full unfinished basement. The roof has recently been replaced with dimensional shingles. This home has a ton of potential, just needs some TLC. The home is being sold as-is.
ⓘ Source: listings_history table (triggers on properties + properties_extension) + one-shot
backfill from property_details.listing_events for pre-trigger history.
Tax reassessment forecast OH · Partial reset (capped growth)
- Current annual tax
- $4,125 · $344/mo
- Projected year-2 tax
- $4,125 · $344/mo
- Expected delta
- $0/yr ($0/mo · 0.0%)
ⓘ Screening estimate from a state-policy table — verify with the county assessor before closing.
Climate risk First Street
- Flood 1/10 Low FEMA zone X (unshaded) · 0% chance over 30 yrs
- Wildfire 1/10 Low
- Heat 3/10 Moderate 7 d/yr ≥99°F today · 17 d/yr by 30 yrs out
- Wind 2/10 Low 0% chance of damaging wind over 30 yrs
- Air quality 3/10 Moderate 2 unhealthy d/yr today · 3 by 30 yrs out
Nearby sold comps map
Loading sold comps map…
Walkable amenities ~0.75 mi
Loading nearby amenities…
Taxation est. · year 1
- Rental income
- $16,790
- − Mortgage interest
- −$7,506
- − Property taxes
- −$4,125
- − Insurance
- −$670
- − Repairs & maintenance
- −$1,343
- − Management
- −$1,343
- − Depreciation
- −$3,898
- Taxable loss
- −$2,095
- Est. tax savings @ 24.0%
- +$503
- After-tax cash flow
- $540/yr
For passive investors: Depreciation is non-cash, so a rental often shows a tax loss while cash-flowing — sheltering income. Rental losses are passive: they offset passive income freely, and up to $25,000/yr can offset ordinary (W-2) income if you actively participate and your MAGI is under $100k (phasing out to $0 by $150k); unused losses carry forward. On sale, claimed depreciation is recaptured at up to 25%, and gains may owe capital-gains tax (a 1031 exchange can defer both). Figures are a year-1 estimate at your 24.0% rate — not tax advice; consult a CPA.
Schools (NCES district)
- District
- Clark-Shawnee Local
- NCES district ID
- 3904628
- Math proficiency
- 54% ▼ -13.00%
- Reading proficiency
- 62% ▼ -4.00%
- Median HH income
- $59,411
- Composite
- 50.29/100
- National rank
- #1884
- State rank
- #301 of 656 in OH
Livability — Springfield
- Score
- 56/100
- State rank
- #1108
- US rank
- #22551
Category grades
Schools grade is shown separately in the Schools card above.
Census & demographics
- County
- Clark County · 33,261 people
- City population
- 33,261
- Metro
- Springfield, OH
- Population (ZIP)
- 19,826
- Household income
- $43,819
- Rent vs Own
- Severe rent burden
- 950.0
Population outlook (Clark County) Hauer SSP2
- Today (2025)
- 130,703 people
- By 2030
- 126,952 · -2.9%
- By 2040
- 118,344 · -9.5%
- By 2050
- 109,590 · -16.2%
- By 2075
- 89,464 · -31.6%
- By 2100
- 68,810 · -47.4%
Race, ethnicity, and origin ACS 2023
- Neighborhood character
- Predominantly White (75%)
- Race & ethnicity
- White 75% Black 14% Two or more races 7% Hispanic / Latino 4%
- Common ancestry
- Slovak 1% German 1% Iranian 1%
- Foreign-born
- 2% · Canada
- Languages at home
- 96% English-only · Spanish 2% French/Haitian/Cajun 1% German/W. Germanic 1%
Political lean MEDSL · Clark
- 2024 margin
- Strong R (+29.5) · D 34.8% · R 64.3%
- 2008→2024 swing
- -27.0pp toward R · 2008: -2.5pp · 2024: -29.5pp
- All cycles
- 2024: R+29.5 2020: R+23.3 2016: R+19.5 2012: R+1.8 2008: R+2.5
Not yet ingested
- Civics
- —
Market trends
- HPI YoY
- ▼ -135.16%
- Current HPI
- 258.9037
- Rent YoY
- —
- Metro
- Springfield, OH
- State GDP YoY
- ▲ 1.98%
- F500 in state
- 48
Industry mix (Fortune 500 HQ in OH)
| Industry | F500 HQs | Revenue |
|---|---|---|
| Insurance | 3 | $145B |
|
||
| Industrial Machinery | 3 | $49B |
|
||
| Financial Services | 3 | $24B |
|
||
| Consumer Goods | 2 | $93B |
|
||
| Aerospace / Defense | 2 | $47B |
|
||
| Utilities | 2 | $33B |
|
||
Price history
+49.1% since first listed11 events — show timeline
- 2026-06-16 Price Changed $134,000 WRIST
- 2026-04-24 Listed $140,000 WRIST
- 2026-04-03 Listing Removed — WRIST
- 2026-02-26 Price Changed $129,000 WRIST
- 2026-01-31 Listed $134,000 WRIST
- 2022-12-13 Sold (Public Records) $70,000 Public Records
- 2022-12-09 Sold (MLS) $70,000 Dayton MLS
- 2022-12-09 Sold (MLS) $70,000 Dayton MLS
- 2022-11-28 Contingent — Dayton MLS
- 2022-11-21 Price Changed $79,900 Dayton MLS
- 2022-11-18 Listed $89,900 Dayton MLS
Property tax history
+21.1%/yrLatest (2025): $4,125 · +41.7% YoY. Source: county tax records.
Cash-flow waterfall
monthlySold comps — $/sqft
last 12 mo · ≤1 miLoading sold comps…