 Multi-family
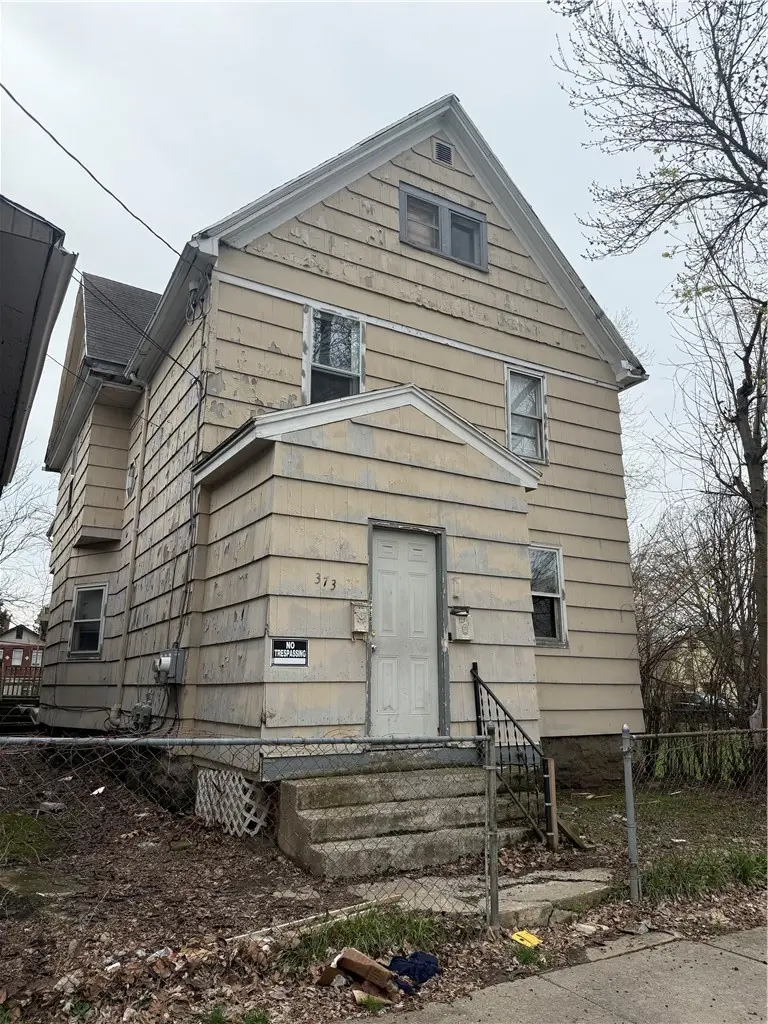
373 Verona St · Rochester, NY
Flood risk 1/10 · Minimal
- FEMA flood zone
- X (unshaded)
- Chance of flooding over 30 yrs
- 0.0%
- Est. flood insurance / yr
- $473 – $860
Fire risk 1/10 · Minimal
- Est. fire insurance / yr
- $691 – $1,283
Heat risk 2/10 · Minimal
- Hot days now (above 95°F)
- 7 days/yr
- Hot days in 30 yrs
- 15 days/yr
Wind risk 1/10 · Minimal
- Chance of severe wind over 30 yrs
- —
Air-quality risk 2/10 · Minimal
- Unhealthy air days now
- 1 days/yr
- Unhealthy air days in 30 yrs
- 2 days/yr
Risk factors via First Street. Map © Google.
Why this score? — see what drove the C- grade
The composite is a weighted blend of 9 inputs, each scored 0–100. Each bar is that input's sub-score; the figure is the points it added to the 100-point composite (weight × sub-score).
- Cash flow +15.0/30.0
- ARV discount +7.5/15.0
- Appreciation +6.8/10.0
- 1% rule +5.0/10.0
- DSCR +5.0/10.0
- Rent growth +4.2/5.0
- Livability +3.8/5.0
- Condition / age +2.5/5.0
- Schools +1.9/10.0
$50,000
🖨 Deal sheet (PDF) 📄 Offer letter ✓ Due diligence
Multi-family units
County records classify this as Multi-Family (2-4 Unit). Listing-text estimate: 1 unit. estimate disagrees with records
Listing remarks MLS
Investment property located on quiet one way street, walk to Paetec Park and Frontier Field, 1 two bedroom and 1 three bedroom apartment, complete tear off rear 1/2 of roof, separate utilities, gross annual rents of $10,200, subject to bank approved short sale.
Key facts
- 3,300 sq ft lot
- Built 1913
- Listed 60 days
Property features AI
Finance
- Other: Two-unit property with separate gas and electric meters for each unit
- Financial info: Owner pays water; Water included in rent; Operating expenses include water/sewer
Exterior
- Parking: On-street parking
- Utilities: Public water connected; Sewer connected
- Home design: Two-story building; Resale property; Wood siding construction
- Construction: Wood siding; Existing (previously built)
- Exterior features: Enclosed porch; Porch; Rectangular residential lot; City street frontage
Interior
- Kitchen: Eat-in kitchens in both units
- Bedrooms: One unit with 2 bedrooms; One unit with 3 bedrooms
- Flooring: Hardwood; Varies
- Bathrooms: Two full bathrooms (one in each unit)
- Heating & cooling: Gas forced-air heating
- Interior features: Hardwood and varied flooring; Enclosed porch; Porch
- Laundry & utility: Gas water heater
Neighborhood map
What this means for you Summary
Snapshot
- This is a 5-bed/2.0-bath multifamily listed at $50k.
Deal economics
- At list price, monthly cash flow is $1k ($16k/yr) — positive.
- The deal already cash-flows at list — no discount required.
- Meets the 1% rule at list price ($2k rent vs $50k).
- Recommended offer: $48k (3.0% below list) — sets the bar for market timing.
- Cap rate 37.7% vs local median 9.3% in Rochester — top-decile yield for the area; either an underpriced asset or a hidden risk that comps aren't pricing in. Stress-test before assuming the spread holds.
Location & tenants
- Location reads 76/100 on livability (#222 in NY, #3,482 nationally) — a middle-class / working-renter tenant base. Strengths: commute A+, cost of living A+, housing A+; Watch: crime F, employment F.
- Rochester City School District (urban): math 21% / reading 26% proficiency, ranked #589 of 590 in NY (top 100%) — low school quality limits family demand, transient renter base, plan for 1-2y turnover; 82% free/reduced lunch — lower-income household profile, screen leases tightly.
- Zoned schools: School 5-John Williams (math 2% / reading 8%, grade F, #2,098 of 2,108 statewide, top 100%, 596 students, 93% FRL); East Lower School (math 2% / reading 22%, grade F, #715 of 729 statewide, top 98%, 304 students, 86% FRL); Edison Career And Technology High School (math 44% / reading 50%, grade D-, #1,007 of 1,100 statewide, top 93%, 1,233 students, 91% FRL).
- Market conditions: Rents rising fast (+6.6%/yr); 51 active listings in the ZIP; 2 comparable units currently listed for rent nearby; lower-income renter base — watch delinquency; 1,169 units permitted in Monroe County in 2024 (591 in 5+ unit buildings).
- At $2,090/mo this rent would consume 62% of the median local household income ($41k/yr) (locally 1300% of renters already pay >50% of income on rent) — very limited rent-growth headroom before tenants either downsize or default.
Forward outlook
- In year one you build about $2k of equity ($346 loan paydown + $2k appreciation (3.7% local appreciation)).
- Monroe County population projected to shrink 6% by 2050 — rents likely to lag national; underwrite the cash flow, not the appreciation.
- At projected returns (3.7% appreciation + 6.6% rent growth), your $14k cash investment doubles in ~1 year — after that, you're playing with house money.
Negotiation context
- It's been on market 60 days — a 3% lower offer ($48k) is reasonable based on typical stale-listing flexibility.
- 2 sale attempts since 17y ago; this cycle's ask has dropped $12k (20%) from the opening price — seller is motivated, your offer sets the floor, not the list.
- Current owner paid $15k; list at $50k implies a 233% gain — meaningful room to come down on a strong offer.
Risks & watch-outs
- Watch-outs: built in 1913 — expect roof / HVAC / electrical / plumbing capex.
Questions for the listing agent
- It's been on market 60 days. Have you received any prior offers? Is the seller open to a 3% concession, seller financing, or rate buy-down credit?
- Built in 1913 — when were the roof, HVAC, electrical panel, plumbing, and water heater last replaced?
- Is there a deadline driving the sale (1031 exchange, divorce, estate, relocation)? That informs how much negotiation room exists.
- Schools are D-rated, which usually means shorter tenancies and higher turnover. Who's the typical renter profile here, and what's been the actual vacancy rate?
- Crime grade is F in this area — have there been break-ins, vandalism, or insurance claims at this property in the last 3 years? What carrier currently insures it and at what premium?
- What's the average days-on-market for RENTAL listings here right now (not sales)? A rising rental-DOM trend means longer vacancies and softer asking-rent achievability than the comps imply.
- What's the recent tenant-quality profile in this submarket — average credit score on applications, eviction rate, late-payment / NSF rate, and stable-employment percentage? A property-management company in the area should have these aggregated.
- How much new apartment / multifamily construction is in the pipeline within 1–3 miles? Heavy new supply (>2% of stock underway) typically softens rents 12–24 months out; light construction supports rent growth.
Investment metrics
- 1% rule
- 4.18% ✓
- Cap rate
- 37.71%
- Cash-on-cash
- 112.21%
- DSCR
- 5.99
- GRM
- 2.0
CMA / ARV
- ARV (median comp)
- $158,465
- List price
- $50,000
- Delta
- -68.45%
- Verdict
- UNDERPRICED
- Comps
- 20 within 1.0 mi
Show comp detail 12 sales within ~0.75 mi
| Address | Dist | Beds/Ba | Sqft | Sold | Price | $/sf | Match |
|---|---|---|---|---|---|---|---|
| 808 Smith St | 0.54mi | 5/2.0 | 2,320 (+1%) | 7mo | $49,000 | $21 | 68 |
| 929 Plymouth Ave N | 0.44mi | 6/2.0 (+1) | 2,380 (+3%) | 4mo | $125,000 | $53 | 66 |
| 52 Madison St | 0.56mi | 4/2.0 (-1) | 2,311 (+0%) | 11mo | $140,000 | $61 | 59 |
| 104 Parkway | 0.39mi | 6/2.0 (+1) | 2,070 (-10%) | 10mo | $170,000 | $82 | 52 |
| 28 Walnut St | 0.43mi | 6/3.0 (+1) | 2,240 (-3%) | 20mo | $70,000 | $31 | 50 |
| 101 Jefferson Ave | 0.71mi | 5/2.0 | 2,258 (-2%) | 18mo | $85,000 | $38 | 48 |
| 2 Costar St | 0.53mi | 4/2.0 (-1) | 2,122 (-8%) | 12mo | $125,000 | $59 | 47 |
| 85 Cameron St | 0.73mi | 5/2.0 | 2,276 (-1%) | 20mo | $136,000 | $60 | 47 |
| 227 Saratoga Ave | 0.54mi | 6/3.0 (+1) | 2,000 (-13%) | 2mo | $85,000 | $43 | 42 |
| 641 Jay St | 0.65mi | 6/2.0 (+1) | 2,190 (-5%) | 19mo | $164,000 | $75 | 41 |
| 74 Bloss St | 0.56mi | 6/2.0 (+1) | 2,080 (-10%) | 16mo | $150,000 | $72 | 39 |
| 98 Lime St | 0.64mi | 4/2.0 (-1) | 1,978 (-14%) | 10mo | $125,000 | $63 | 34 |
Match score weights: distance 35% · size 25% · config 20% · recency 20%. Top-matched comps best support the ARV.
Projected returns pro-forma
3.69% appreciation · 6.61% rent growth · sell at horizon
- IRR
- —
- Equity multiple
- 8.08×
- Total profit
- $99,152
- Equity at exit
- $24,453
- IRR
- —
- Equity multiple
- 18.68×
- Total profit
- $247,552
- Equity at exit
- $39,294
Cash invested: $14,000 (down + closing). Projections, not guarantees.
Landlord ↔ Tenant lean methodology
- Overall (STATE)
- 15 Strongly Tenant-Friendly
- State New York
- 15 Strongly Tenant-Friendly · D+10
- County
- — inherits STATE
- City
- — inherits STATE
ZIP-level market 14608
- Home prices YoY
- 1.3%
- Rents YoY
- 6.6%
- Active inventory
- 51
- Price-to-rent
- 2.0×
Monthly cashflow live
- Estimated rent
- $2,090 medium interval (Pro) →
- Mortgage (P&I)
- −$262
- Tax from tax record
- −$59 /mo · $704/yr
- Insurance
- −$21
- HOA
- −$0
- Vacancy / Maint / Mgmt
- −$439
- Net cashflow
- $1,309
Break-even live
Sensitivity live
| Price | -10% $1,337 | -5% $1,323 | +0% $1,309 | +5% $1,295 | +10% $1,281 |
|---|---|---|---|---|---|
| Rent | -10% $1,144 | -5% $1,227 | +0% $1,309 | +5% $1,392 | +10% $1,474 |
| Rate | -1.0pp $1,334 | -0.5pp $1,322 | base $1,309 | +0.5pp $1,296 | +1.0pp $1,283 |
UW: 25.0% down · 7.5% · 30yr · 1.5% tax · 5.0% vac · 8.0% maint · 8.0% mgmt
Financing live
Cash to close
- Down payment
- $12,500
- Closing costs
- $1,500
- Reserves months
- —
- Total cash needed
- —
Loan-product check · same deal, 3 products live
Conventional
25% down · 7.5% · 30yr
- Down + closing
- —
- Monthly P&I
- —
- Monthly cashflow
- —
- DSCR
- —
- Eligible?
- —
Personal DTI + credit; lowest rate.
DSCR
20% down · 8.5% · 30yr
- Down + closing
- —
- Monthly P&I
- —
- Monthly cashflow
- —
- DSCR
- —
- Eligible?
- —
No personal income docs; deal must DSCR.
Hard money
10% down · 12.0% · 12mo
- Down + closing
- —
- Monthly P&I
- —
- Monthly cashflow
- —
- DSCR
- —
- Eligible?
- —
Short-term bridge; refi at stabilization.
Rent comps 2 comps
| Address | Beds | Baths | Sqft | Rent | $/sqft | DOM | Units | Dist |
|---|---|---|---|---|---|---|---|---|
| 649 Jay St Rochester, NY | 5.0 | 2.0 | 2144 | $2,000 | $0.93 | 4d | 1 | 0.65mi |
| 48 Thorndale Ter Rochester, NY | 4.0 | 1.5 | 1700 | $1,400 | $0.82 | 16d | 1 | 1.41mi |
Listing history 21 events
-
2026-06-21days on market $50,000 Active 60 DOM
-
2026-06-18days on market $50,000 Active 57 DOM
-
2026-06-17days on market $50,000 Active 56 DOM
-
2026-06-16days on market $50,000 Active 55 DOM
-
2026-06-15days on market $50,000 Active 54 DOM
-
2026-06-13days on market $50,000 Active 52 DOM
-
2026-06-13pricedays on market $50,000 Active 51 DOM
-
2026-06-10days on market $62,200 Active 49 DOM
-
2026-06-09days on market $62,200 Active 48 DOM
-
2026-06-09days on market $62,200 Active 47 DOM
-
2026-06-07days on market $62,200 Active 46 DOM
-
2026-06-05days on market $62,200 Active 43 DOM
-
2026-06-03days on market $62,200 Active 42 DOM
-
2026-06-03days on market $62,200 Active 41 DOM
-
2026-06-01days on market $62,200 Active 40 DOM
-
2026-05-31days on market $62,200 Active 39 DOM
-
2026-04-22$62,200 Active 461-char remark
-
2010-09-27soldstatus $15,000
-
2010-09-19soldstatus $15,000 261-char remark
Show marketing remark (261 chars)
Investment property located on quiet one way street, walk to Paetec Park and Frontier Field, 1 two bedroom and 1 three bedroom apartment, complete tear off rear 1/2 of roof, separate utilities, gross annual rents of $10,200, subject to bank approved short sale.
-
2009-11-23$19,900 261-char remark
Show marketing remark (261 chars)
Investment property located on quiet one way street, walk to Paetec Park and Frontier Field, 1 two bedroom and 1 three bedroom apartment, complete tear off rear 1/2 of roof, separate utilities, gross annual rents of $10,200, subject to bank approved short sale.
-
2005-07-18soldstatus $30,000
ⓘ Source: listings_history table (triggers on properties + properties_extension) + one-shot
backfill from property_details.listing_events for pre-trigger history.
Tax reassessment forecast NY · Partial reset (capped growth)
- Current annual tax
- $704 · $59/mo
- Projected year-2 tax
- $775 · $65/mo
- Expected delta
- +$70/yr (+$6/mo · 10.0%)
ⓘ Screening estimate from a state-policy table — verify with the county assessor before closing.
Climate risk First Street
- Flood 1/10 Low FEMA zone X (unshaded) · 0% chance over 30 yrs
- Wildfire 1/10 Low
- Heat 2/10 Low 7 d/yr ≥95°F today · 15 d/yr by 30 yrs out
- Wind 1/10 Low
- Air quality 2/10 Low 1 unhealthy d/yr today · 2 by 30 yrs out
Nearby sold comps map
Loading sold comps map…
Walkable amenities ~0.75 mi
Loading nearby amenities…
Taxation est. · year 1
- Rental income
- $25,077
- − Mortgage interest
- −$2,801
- − Property taxes
- −$704
- − Insurance
- −$250
- − Repairs & maintenance
- −$2,006
- − Management
- −$2,006
- − Depreciation
- −$1,455
- Taxable income
- $15,855
- Est. tax owed @ 24.0%
- −$3,805
- After-tax cash flow
- $11,905/yr
For passive investors: Depreciation is non-cash, so a rental often shows a tax loss while cash-flowing — sheltering income. Rental losses are passive: they offset passive income freely, and up to $25,000/yr can offset ordinary (W-2) income if you actively participate and your MAGI is under $100k (phasing out to $0 by $150k); unused losses carry forward. On sale, claimed depreciation is recaptured at up to 25%, and gains may owe capital-gains tax (a 1031 exchange can defer both). Figures are a year-1 estimate at your 24.0% rate — not tax advice; consult a CPA.
Schools (NCES district)
- District
- Rochester City School District
- NCES district ID
- 3624750
- Math proficiency
- 21% ▬ 0.00%
- Reading proficiency
- 26% ▲ 4.00%
- Median HH income
- $30,923
- Composite
- 18.98/100
- National rank
- #8850
- State rank
- #589 of 590 in NY
Livability — Rochester
- Score
- 76/100
- State rank
- #222
- US rank
- #3482
Category grades
Schools grade is shown separately in the Schools card above.
Census & demographics
- Census place
- Rochester, NY
- County
- Monroe County · 674,131 people
- City population
- 432,803
- Metro
- Rochester, NY
- Population (ZIP)
- 12,792
- Household income
- $40,646
- Rent vs Own
- Severe rent burden
- 1300.0
Population outlook (Monroe County) Hauer SSP2
- Today (2025)
- 759,460 people
- By 2030
- 757,154 · -0.3%
- By 2040
- 740,644 · -2.5%
- By 2050
- 714,443 · -5.9%
- By 2075
- 645,883 · -15.0%
- By 2100
- 547,084 · -28.0%
Race, ethnicity, and origin ACS 2023
- Neighborhood character
- Diverse neighborhood (Simpson 0.67)
- Race & ethnicity
- Black 50% White 25% Two or more races 13% Hispanic / Latino 12% Asian 4%
- Hispanic origin (detail)
- Puerto Rican 10%
- Common ancestry
- Lithuanian 1% Romanian 1% Iranian 1%
- Foreign-born
- 8% · Canada, India
- Languages at home
- 85% English-only · Spanish 8% Other Indo-European 3% French/Haitian/Cajun 1%
Political lean MEDSL · Monroe
- 2024 margin
- D (+19.1) · D 59.5% · R 40.5%
- 2008→2024 swing
- +1.4pp toward D · 2008: 17.7pp · 2024: 19.1pp
- All cycles
- 2024: D+19.1 2020: D+21.0 2016: D+14.1 2012: D+17.4 2008: D+17.7
Not yet ingested
- Civics
- —
Market trends
- HPI YoY
- ▲ 3.69%
- Current HPI
- 280.2411
- Rent YoY
- ▲ 6.61%
- Metro
- Rochester, NY
- State GDP YoY
- ▲ 2.60%
- F500 in state
- 92
Industry mix (Fortune 500 HQ in NY)
| Industry | F500 HQs | Revenue |
|---|---|---|
| Financial Services | 10 | $950B |
|
||
| Consumer Goods | 9 | $162B |
|
||
| Insurance | 4 | $225B |
|
||
| Telecommunications | 2 | $144B |
|
||
| Pharmaceuticals | 2 | $112B |
|
||
| Media / Entertainment | 2 | $69B |
|
||
Price history
+66.7% since first listed6 events — show timeline
- 2026-06-11 Price Changed $50,000 UNYREIS
- 2026-04-22 Listed $62,200 UNYREIS
- 2010-09-27 Sold (Public Records) $15,000 Public Records
- 2010-09-19 Sold (MLS) $15,000 UNYREIS
- 2009-11-23 Listed $19,900 UNYREIS
- 2005-07-18 Sold (Public Records) $30,000 Public Records
Property tax history
+5.2%/yrLatest (2025): $704 · +51.9% YoY. Source: county tax records.
Cash-flow waterfall
monthlySold comps — $/sqft
last 12 mo · ≤1 miLoading sold comps…