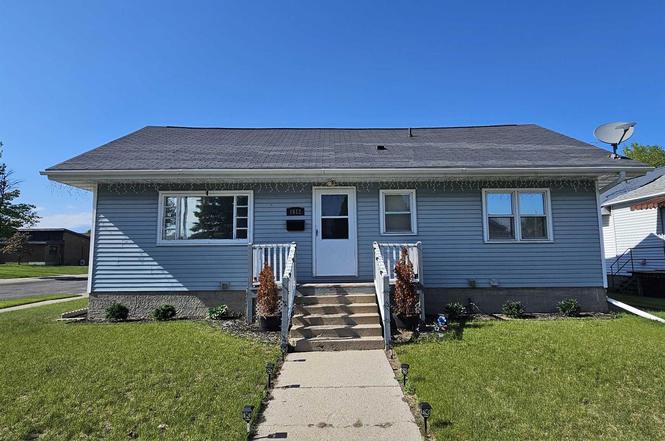
1612 26th Ave · Menominee, MI
Flood risk No data
- FEMA flood zone
- —
- Chance of flooding over 30 yrs
- —
- Est. flood insurance / yr
- —
Fire risk No data
- Est. fire insurance / yr
- —
Heat risk No data
- Hot days now (above threshold)
- —
- Hot days in 30 yrs
- —
Wind risk No data
- Chance of severe wind over 30 yrs
- —
Air-quality risk No data
- Unhealthy air days now
- —
- Unhealthy air days in 30 yrs
- —
Risk factors via First Street. Map © Google.
Why this score? — see what drove the D+ grade
The composite is a weighted blend of 9 inputs, each scored 0–100. Each bar is that input's sub-score; the figure is the points it added to the 100-point composite (weight × sub-score).
- Cash flow +14.8/30.0
- ARV discount +13.2/15.0
- DSCR +4.5/10.0
- 1% rule +4.1/10.0
- Livability +3.6/5.0
- Schools +2.9/10.0
- Rent growth +2.5/5.0
- Condition / age +2.5/5.0
- Appreciation +0.0/10.0
$147,500
🖨 Deal sheet (PDF) 📄 Offer letter ✓ Due diligence
Listing remarks MLS
VERY NICE FAMILY HOME NEAR LINCOLN SCHOOL! 4 BEDROOMS PLUS A DEN, FULL BASEMENT & A 1 CAR DET. GARAGE, SPACIOUS LIVING ROOM, SECOND LEVEL BEDROOMS COULD BE USED AS A HUGE BEDROOM AND A FAMILY ROOM IF DESIRED. SITUATED ON A CORNER LOT. MUST SEE TO APPRECIATE.
Key facts
- Full basement
- Large back yard
- Fire pit
Tags
Property features AI
Finance
- Other: Inclusions: Stove and refrigerator; Exclusions: Seller's and tenant's personal belongings
Exterior
- Parking: Detached 1-car garage
- Utilities: Municipal water; Municipal sewer; Natural gas
- Home design: 1.5-story single-family home; Construction completed
- Construction: Built (year source: assessor/public record)
- Exterior features: Vinyl exterior; Lot approximately 0.17 acres; Less than 1/2 acre
Interior
- Kitchen: Range/Oven; Refrigerator; Kitchen on main level approximately 12 x 12
- Bedrooms: Master bedroom (main level) approximately 11 x 12; Second bedroom (main level) approximately 10 x 12; Third bedroom (main level) approximately 9 x 12
- Bathrooms: One full bathroom
- Heating & cooling: Forced air heating; Natural gas heat
- Interior features: Full block basement; Bonus room above garage
- Laundry & utility: Utilities: Municipal water and municipal sewer
Neighborhood map
What this means for you Summary
Snapshot
- This is a 3-bed/1.0-bath single-family listed at $148k.
Deal economics
- At list price, monthly cash flow is $42 ($502/yr) — positive.
- The deal already cash-flows at list — no discount required.
- To meet the 1% rule (rent ≥ 1% of price), the offer needs to be $134k (8.9% below list).
- Recommended offer: $134k (8.9% below list) — sets the bar for 1% rule.
- Cap rate 6.6% vs local median 4.0% in Menominee — top-decile yield for the area; either an underpriced asset or a hidden risk that comps aren't pricing in. Stress-test before assuming the spread holds.
Location & tenants
- Location reads 71/100 on livability (#282 in MI) — a middle-class / working-renter tenant base. Strengths: cost of living A+, housing A+, health & safety A+; Watch: amenities F, commute F, employment F.
- Menominee Area Public Schools (town): math 26% / reading 42% proficiency, ranked #312 of 540 in MI (top 58%) — families likely to look elsewhere, expect single-tenant / working-renter base with shorter leases.
- Zoned schools: Blesch Intermediate School (math 29% / reading 38%, grade F, #802 of 1,397 statewide, top 58%, 357 students, 57% FRL); Menominee Jr High School (math 22% / reading 47%, grade F, #289 of 493 statewide, top 60%, 176 students, 52% FRL); Menominee High School (math 22% / reading 47%, grade F, #372 of 713 statewide, top 56%, 350 students, 42% FRL).
- Market conditions: 64 active listings in the ZIP; 26 units permitted in Menominee County in 2024 (0 in 5+ unit buildings).
Forward outlook
- Local home prices are declining (-3.0%/yr); year-one equity from $1k of loan paydown is wiped out by about $4k of value loss. Plan a longer hold.
- Menominee County population projected at -19% by 2050 — secular population decline; favor cash flow + early exit over multi-decade hold.
Negotiation context
- Only 3 days on market — expect competitive offers; lowballing is unlikely to land.
- 2 sale attempts since 15y ago with the ask held roughly flat each time — persistent listings suggest the price (not the market) is what's stuck; bring a comps-based counter.
- Current owner paid $54k; list at $148k implies a 173% gain — meaningful room to come down on a strong offer.
Risks & watch-outs
- Watch-outs: built in 1954 — expect roof / HVAC / electrical / plumbing capex.
Questions for the listing agent
- Built in 1954 — when were the roof, HVAC, electrical panel, plumbing, and water heater last replaced?
- Is there a deadline driving the sale (1031 exchange, divorce, estate, relocation)? That informs how much negotiation room exists.
- The area grade is low — what's the realistic commute time and amenity access for the typical tenant pool here? Any planned neighborhood developments (good or bad) we should know about?
- What's the average days-on-market for RENTAL listings here right now (not sales)? A rising rental-DOM trend means longer vacancies and softer asking-rent achievability than the comps imply.
- What's the recent tenant-quality profile in this submarket — average credit score on applications, eviction rate, late-payment / NSF rate, and stable-employment percentage? A property-management company in the area should have these aggregated.
- How much new for-sale + rental construction is in the pipeline within 1–3 miles? Heavy new supply typically softens prices + rents 12–24 months out; constrained supply supports both.
Investment metrics
- 1% rule
- 0.91% ✗
- Cap rate
- 6.63%
- Cash-on-cash
- 1.22%
- DSCR
- 1.05
- GRM
- 9.2
CMA / ARV
- ARV (on-the-fly)
- $168,831
- Comps found
- 12
Show comp detail 12 sales within ~0.75 mi
| Address | Dist | Beds/Ba | Sqft | Sold | Price | $/sf | Match |
|---|---|---|---|---|---|---|---|
| 1809 28th Ave | 0.13mi | 3/1.5 | 1,600 (+5%) | 7mo | $270,000 | $169 | 77 |
| 3101 16th St | 0.31mi | 3/2.0 | 1,601 (+5%) | 1mo | $220,400 | $138 | 72 |
| 1905 16th St | 0.45mi | 3/1.5 | 1,512 (-1%) | 9mo | $151,000 | $100 | 68 |
| 2113 17th Ave | 0.69mi | 2/1.0 (-1) | 1,548 (+2%) | 1mo | $145,000 | $94 | 59 |
| 1813 14th St | 0.50mi | 2/1.0 (-1) | 1,625 (+7%) | 9mo | $127,000 | $78 | 53 |
| 1201 18th Ave | 0.60mi | 3/2.0 | 1,608 (+6%) | 11mo | $178,000 | $111 | 49 |
| 3308 13th St | 0.52mi | 3/2.5 | 1,358 (-11%) | 4mo | $152,000 | $112 | 48 |
| 1609 15th Ave | 0.72mi | 3/1.0 | 1,428 (-6%) | 10mo | $135,000 | $95 | 48 |
| 3117 14th St | 0.39mi | 2/1.0 (-1) | 1,307 (-14%) | 9mo | $216,000 | $165 | 46 |
| 1616 15th Ave | 0.70mi | 2/2.0 (-1) | 1,470 (-3%) | 9mo | $172,900 | $118 | 45 |
| 1109 17th Ave | 0.68mi | 3/1.5 | 1,336 (-12%) | 5mo | $80,000 | $60 | 42 |
| 1212 17th Ave | 0.62mi | 4/2.0 (+1) | 1,696 (+12%) | 6mo | $169,000 | $100 | 38 |
Match score weights: distance 35% · size 25% · config 20% · recency 20%. Top-matched comps best support the ARV.
Projected returns pro-forma
-3.0% appreciation · 3.0% rent growth · sell at horizon
- IRR
- -14.3%
- Equity multiple
- 0.49×
- Total profit
- $-21,218
- Equity at exit
- $21,993
- IRR
- -5.6%
- Equity multiple
- 0.64×
- Total profit
- $-14,964
- Equity at exit
- $12,753
Cash invested: $41,300 (down + closing). Projections, not guarantees.
Landlord ↔ Tenant lean methodology
- Overall (STATE)
- 62 Landlord-Friendly
- State Michigan
- 62 Landlord-Friendly · EVEN
- County
- — inherits STATE
- City
- — inherits STATE
ZIP-level market 49858
- Home prices YoY
- -31.4%
- Active inventory
- 64
- Price-to-rent
- 9.2×
Monthly cashflow live
- Estimated rent
- $1,343 medium interval (Pro) →
- Mortgage (P&I)
- −$774
- Tax est. 1.5%
- −$184 /mo · $2,212/yr
- Insurance
- −$61
- HOA
- −$0
- Vacancy / Maint / Mgmt
- −$282
- Net cashflow
- $42
Break-even live
Sensitivity live
| Price | -10% $144 | -5% $93 | +0% $42 | +5% $-9 | +10% $-60 |
|---|---|---|---|---|---|
| Rent | -10% $-64 | -5% $-11 | +0% $42 | +5% $95 | +10% $148 |
| Rate | -1.0pp $116 | -0.5pp $79 | base $42 | +0.5pp $4 | +1.0pp $-35 |
UW: 25.0% down · 7.5% · 30yr · 1.5% tax · 5.0% vac · 8.0% maint · 8.0% mgmt
Financing live
Cash to close
- Down payment
- $36,875
- Closing costs
- $4,425
- Reserves months
- —
- Total cash needed
- —
Loan-product check · same deal, 3 products live
Conventional
25% down · 7.5% · 30yr
- Down + closing
- —
- Monthly P&I
- —
- Monthly cashflow
- —
- DSCR
- —
- Eligible?
- —
Personal DTI + credit; lowest rate.
DSCR
20% down · 8.5% · 30yr
- Down + closing
- —
- Monthly P&I
- —
- Monthly cashflow
- —
- DSCR
- —
- Eligible?
- —
No personal income docs; deal must DSCR.
Hard money
10% down · 12.0% · 12mo
- Down + closing
- —
- Monthly P&I
- —
- Monthly cashflow
- —
- DSCR
- —
- Eligible?
- —
Short-term bridge; refi at stabilization.
Listing history 3 events
-
2026-06-21days on market $147,500 Active 3 DOM
-
2026-06-18remarks 217-char remark
-
2026-06-18$147,500 Active 1 DOM
ⓘ Source: listings_history table (triggers on properties + properties_extension) + one-shot
backfill from property_details.listing_events for pre-trigger history.
Nearby sold comps map
Loading sold comps map…
Walkable amenities ~0.75 mi
Loading nearby amenities…
Taxation est. · year 1
- Rental income
- $16,119
- − Mortgage interest
- −$8,262
- − Property taxes
- −$2,212
- − Insurance
- −$738
- − Repairs & maintenance
- −$1,290
- − Management
- −$1,290
- − Depreciation
- −$4,291
- Taxable loss
- −$1,963
- Est. tax savings @ 24.0%
- +$471
- After-tax cash flow
- $973/yr
For passive investors: Depreciation is non-cash, so a rental often shows a tax loss while cash-flowing — sheltering income. Rental losses are passive: they offset passive income freely, and up to $25,000/yr can offset ordinary (W-2) income if you actively participate and your MAGI is under $100k (phasing out to $0 by $150k); unused losses carry forward. On sale, claimed depreciation is recaptured at up to 25%, and gains may owe capital-gains tax (a 1031 exchange can defer both). Figures are a year-1 estimate at your 24.0% rate — not tax advice; consult a CPA.
Schools (NCES district)
- District
- Menominee Area Public Schools
- NCES district ID
- 2623550
- Math proficiency
- 26% ▼ -6.00%
- Reading proficiency
- 42% ▼ -3.00%
- Median HH income
- $41,809
- Composite
- 28.68/100
- National rank
- #6694
- State rank
- #312 of 540 in MI
Livability — Menominee
- Score
- 71/100
- State rank
- #282
- US rank
- #6909
Category grades
Schools grade is shown separately in the Schools card above.
Census & demographics
- Census place
- Menominee, MI
- Population (ZIP)
- 11,870
Population outlook (Menominee County) Hauer SSP2
- Today (2025)
- 22,668 people
- By 2030
- 21,986 · -3.0%
- By 2040
- 20,196 · -10.9%
- By 2050
- 18,335 · -19.1%
- By 2075
- 14,771 · -34.8%
- By 2100
- 10,999 · -51.5%
Race, ethnicity, and origin ACS 2023
- Neighborhood character
- Predominantly White (95%)
- Race & ethnicity
- White 95% Two or more races 4% Hispanic / Latino 2%
- Common ancestry
- Lithuanian 8% Romanian 7% Portuguese 4%
- Foreign-born
- 2% · Canada
- Languages at home
- 99% English-only · French/Haitian/Cajun 1%
Political lean MEDSL · Menominee
- 2024 margin
- Solid R (+33.6) · D 32.6% · R 66.2% · Other 1.2%
- 2008→2024 swing
- -43.8pp toward R · 2008: 10.2pp · 2024: -33.6pp
- All cycles
- 2024: R+33.6 2020: R+30.1 2016: R+29.4 2012: R+2.9 2008: D+10.2
Not yet ingested
- Civics
- —
Market trends
- HPI YoY
- ▼ -94.34%
- Current HPI
- 206.2461
- Rent YoY
- —
- Metro
- —
- State GDP YoY
- ▲ 1.37%
- F500 in state
- 28
Industry mix (Fortune 500 HQ in MI)
| Industry | F500 HQs | Revenue |
|---|---|---|
| Automotive Parts | 3 | $48B |
|
||
| Automotive | 2 | $372B |
|
||
| Chemicals | 1 | $45B |
|
||
| Automotive Retail | 1 | $29B |
|
||
| Healthcare / Medical Devices | 1 | $23B |
|
||
| Automotive Technology | 1 | $20B |
|
||
Price history
+686.7% since first listed5 events — show timeline
- 2026-06-17 Listed $147,500 RANW
- 2012-07-20 Sold (MLS) $54,000 METROMLS
- 2012-07-19 Sold (Public Records) $54,000 Public Records
- 2011-08-27 Listed $59,900 METROMLS
- 1995-06-14 Sold (Public Records) $18,750 Public Records
Cash-flow waterfall
monthlySold comps — $/sqft
last 12 mo · ≤1 miLoading sold comps…