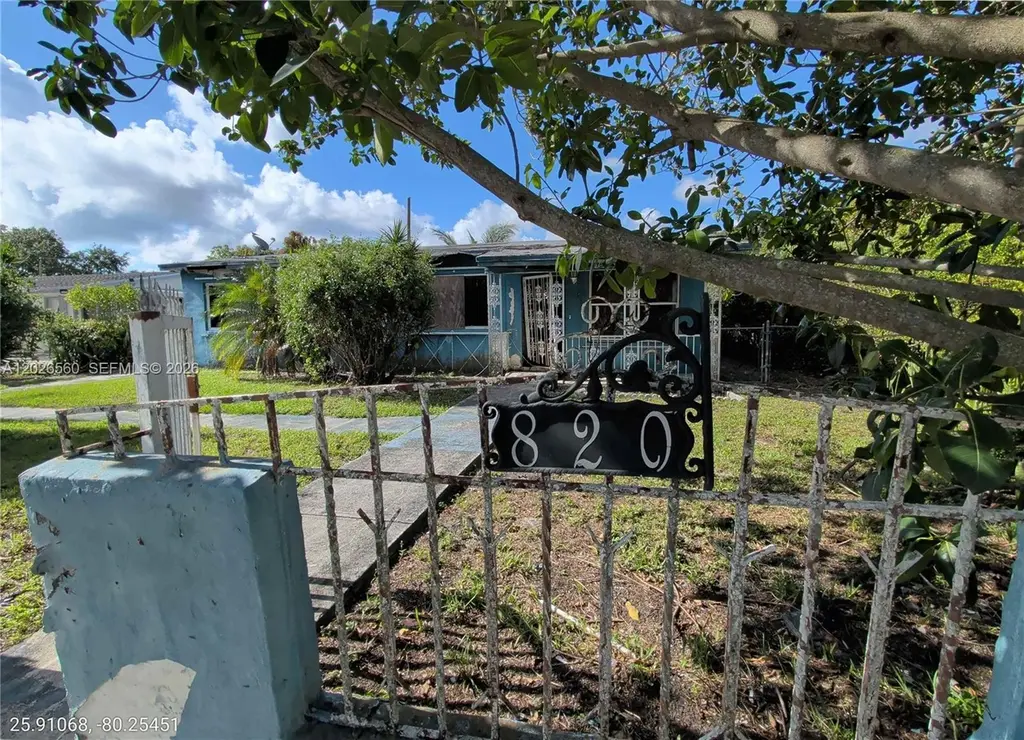
820 Curtiss Dr · Opa-locka, FL
Flood risk 8/10 · Major
- FEMA flood zone
- X (shaded)
- Chance of flooding over 30 yrs
- 0.99%
- Est. flood insurance / yr
- $507 – $1,088
Fire risk 1/10 · Minimal
- Est. fire insurance / yr
- $947 – $1,759
Heat risk 10/10 · Severe
- Hot days now (above 105°F)
- 7 days/yr
- Hot days in 30 yrs
- 30 days/yr
Wind risk 10/10 · Severe
- Chance of severe wind over 30 yrs
- 99.0%
Air-quality risk 2/10 · Minimal
- Unhealthy air days now
- 1 days/yr
- Unhealthy air days in 30 yrs
- 2 days/yr
Risk factors via First Street. Map © Google.
Why this score? — see what drove the C- grade
The composite is a weighted blend of 9 inputs, each scored 0–100. Each bar is that input's sub-score; the figure is the points it added to the 100-point composite (weight × sub-score).
- Cash flow +19.1/30.0
- ARV discount +7.5/15.0
- 1% rule +6.5/10.0
- DSCR +6.0/10.0
- Schools +4.2/10.0
- Rent growth +3.7/5.0
- Livability +2.5/5.0
- Condition / age +2.5/5.0
- Appreciation +0.0/10.0
$224,900
🖨 Deal sheet (PDF) 📄 Offer letter ✓ Due diligence
Listing remarks
3-bedroom, 2-bath home situated on a 6,500-square-foot lot in Opa-Locka. Property requires extensive repairs and is being sold as-is. Excellent opportunity for renovation, redevelopment, or a custom rebuild. Convenient location with easy access to schools, shopping, and major highways.
Key facts
- Custom rebuild
- Convenient location
- 6,500 sq ft lot
Tags
Property features AI
Exterior
- Parking: Driveway
- Utilities: Public water; Public sewer
- Home design: Single-story home; Faces north; Resale property
- Construction: Block construction
- Exterior features: No notable exterior features listed; Less than quarter-acre lot
Interior
- Flooring: Ceramic tile flooring
- Bathrooms: 2 full bathrooms
- Interior features: First-floor entry; Bedroom on main level
Neighborhood map
What this means for you Summary
Snapshot
- This is a 3-bed/2.0-bath single-family listed at $225k.
Deal economics
- At list price, monthly cash flow is $173 ($2k/yr) — positive.
- The deal already cash-flows at list — no discount required.
- Meets the 1% rule at list price ($3k rent vs $225k).
- Recommended offer: $222k (1.5% below list) — sets the bar for market timing.
Location & tenants
- Location reads: area grade C — affects rentability + tenant quality, not the cash-flow math above.
- Miami-Dade (suburban): math 45% / reading 54% proficiency, ranked #40 of 73 in FL (top 55%) — families likely to look elsewhere, expect single-tenant / working-renter base with shorter leases; 64% free/reduced lunch — lower-income household profile, screen leases tightly.
- Zoned schools: Rainbow Park Elementary School (math 37% / reading 42%, grade F, #1,513 of 2,144 statewide, top 73%, 224 students, 79% FRL); North Dade Middle School (math 18% / reading 23%, grade F, #556 of 571 statewide, top 98%, 434 students, 79% FRL); Hialeah-Miami Lakes Senior High (math 21% / reading 33%, grade F, #478 of 667 statewide, top 73%, 1,344 students, 68% FRL).
- Zoned-school proficiency averages 29% at this address vs 50% district-wide (-20 pts) — the specific schools serving this property underperform the Miami-Dade average; the district grade overstates school quality for this exact location.
- Market conditions: Rents rising fast (+4.9%/yr); 141 active listings in the ZIP; 10,051 units permitted in Miami-Dade County in 2024 (7,758 in 5+ unit buildings).
- At $2,576/mo this rent would consume 68% of the median local household income ($46k/yr) (locally 1811% of renters already pay >50% of income on rent) — very limited rent-growth headroom before tenants either downsize or default.
Forward outlook
- Local home prices are declining (-3.0%/yr); year-one equity from $2k of loan paydown is wiped out by about $7k of value loss. Plan a longer hold.
- Miami-Dade County population projected at +28% by 2050 — long-run rental-demand tailwind backs the buy-and-hold thesis.
Negotiation context
- It's been on market 23 days — a 2% lower offer ($222k) is reasonable based on typical stale-listing flexibility.
- Current owner paid $54k; list at $225k implies a 316% gain — meaningful room to come down on a strong offer.
Risks & watch-outs
- Watch-outs: property tax is 2.8% of price; flood insurance adds $66/mo; built in 1957 — expect roof / HVAC / electrical / plumbing capex.
- Climate carrying-cost: severe flood risk; severe wind risk, 99% chance of damaging wind over 30y; extreme-heat days projected 7→30/yr by 2055 (HVAC capex compounding) — expect insurance premiums to compound above CPI over the hold.
Questions for the listing agent
- Built in 1957 — when were the roof, HVAC, electrical panel, plumbing, and water heater last replaced?
- Property tax is high relative to price — has the assessment been appealed recently, and will the sale trigger a re-assessment?
- What's the actual annual flood-insurance premium (NFIP or private), and is the property in a SFHA with mandatory coverage?
- Is there a deadline driving the sale (1031 exchange, divorce, estate, relocation)? That informs how much negotiation room exists.
- What's the average days-on-market for RENTAL listings here right now (not sales)? A rising rental-DOM trend means longer vacancies and softer asking-rent achievability than the comps imply.
- What's the recent tenant-quality profile in this submarket — average credit score on applications, eviction rate, late-payment / NSF rate, and stable-employment percentage? A property-management company in the area should have these aggregated.
- How much new for-sale + rental construction is in the pipeline within 1–3 miles? Heavy new supply typically softens prices + rents 12–24 months out; constrained supply supports both.
Investment metrics
- 1% rule
- 1.15% ✓
- Cap rate
- 7.57%
- Cash-on-cash
- 4.56%
- DSCR
- 1.20
- GRM
- 7.3
CMA / ARV
- ARV (on-the-fly)
- $476,784
- Comps found
- 1
Show comp detail 1 sale within ~0.75 mi
| Address | Dist | Beds/Ba | Sqft | Sold | Price | $/sf | Match |
|---|---|---|---|---|---|---|---|
| 921 Curtiss Dr | 0.08mi | 3/2.0 | 1,056 (+5%) | 20mo | $499,999 | $473 | 71 |
Match score weights: distance 35% · size 25% · config 20% · recency 20%. Top-matched comps best support the ARV.
Projected returns pro-forma
-3.0% appreciation · 4.86% rent growth · sell at horizon
- IRR
- -8.6%
- Equity multiple
- 0.68×
- Total profit
- $-20,300
- Equity at exit
- $33,533
- IRR
- 3.6%
- Equity multiple
- 1.29×
- Total profit
- $18,349
- Equity at exit
- $19,445
Cash invested: $62,972 (down + closing). Projections, not guarantees.
Landlord ↔ Tenant lean methodology
- Overall (STATE)
- 87 Strongly Landlord-Friendly
- State Florida
- 87 Strongly Landlord-Friendly · R+3
- County
- — inherits STATE
- City
- — inherits STATE
ZIP-level market 33054
- Home prices YoY
- -15.9%
- Rents YoY
- 4.9%
- Active inventory
- 141
- Price-to-rent
- 7.3×
Monthly cashflow live
- Estimated rent
- $2,576 medium interval (Pro) →
- Mortgage (P&I)
- −$1,179
- Tax from tax record
- −$523 /mo · $6,271/yr
- Insurance
- −$94
- Flood insurance flood zone
- −$66 /mo · $798/yr
- HOA
- −$0
- Vacancy / Maint / Mgmt
- −$541
- Net cashflow
- $173
Break-even live
Sensitivity live
| Price | -10% $300 | -5% $236 | +0% $173 | +5% $109 | +10% $45 |
|---|---|---|---|---|---|
| Rent | -10% $-31 | -5% $71 | +0% $173 | +5% $275 | +10% $376 |
| Rate | -1.0pp $286 | -0.5pp $230 | base $173 | +0.5pp $115 | +1.0pp $55 |
UW: 25.0% down · 7.5% · 30yr · 1.5% tax · 5.0% vac · 8.0% maint · 8.0% mgmt
Financing live
Cash to close
- Down payment
- $56,225
- Closing costs
- $6,747
- Reserves months
- —
- Total cash needed
- —
Loan-product check · same deal, 3 products live
Conventional
25% down · 7.5% · 30yr
- Down + closing
- —
- Monthly P&I
- —
- Monthly cashflow
- —
- DSCR
- —
- Eligible?
- —
Personal DTI + credit; lowest rate.
DSCR
20% down · 8.5% · 30yr
- Down + closing
- —
- Monthly P&I
- —
- Monthly cashflow
- —
- DSCR
- —
- Eligible?
- —
No personal income docs; deal must DSCR.
Hard money
10% down · 12.0% · 12mo
- Down + closing
- —
- Monthly P&I
- —
- Monthly cashflow
- —
- DSCR
- —
- Eligible?
- —
Short-term bridge; refi at stabilization.
Listing history 14 events
-
2026-06-21days on market $224,900 Active 23 DOM
-
2026-06-18days on market $224,900 Active 20 DOM
-
2026-06-17days on market $224,900 Active 19 DOM
-
2026-06-16days on market $224,900 Active 18 DOM
-
2026-06-15days on market $224,900 Active 17 DOM
-
2026-06-13days on market $224,900 Active 15 DOM
-
2026-06-09days on market $224,900 Active 11 DOM
-
2026-06-08days on market $224,900 Active 10 DOM
-
2026-06-07days on market $224,900 Active 9 DOM
-
2026-06-04days on market $224,900 Active 6 DOM
-
2026-06-03days on market $224,900 Active 5 DOM
-
2026-06-02days on market $224,900 Active 4 DOM
-
2026-06-01days on market $224,900 Active 3 DOM
-
2026-05-31days on market $224,900 Active 2 DOM
ⓘ Source: listings_history table (triggers on properties + properties_extension) + one-shot
backfill from property_details.listing_events for pre-trigger history.
Tax reassessment forecast FL · Resets to sale price
- Current annual tax
- $6,271 · $523/mo
- Projected year-2 tax
- $6,271 · $523/mo
- Expected delta
- $0/yr ($0/mo · 0.0%)
ⓘ Screening estimate from a state-policy table — verify with the county assessor before closing.
Climate risk First Street
- Flood 8/10 Severe FEMA zone X (shaded) · 99% chance over 30 yrs
- Wildfire 1/10 Low
- Heat 10/10 Extreme 7 d/yr ≥105°F today · 30 d/yr by 30 yrs out
- Wind 10/10 Extreme 99% chance of damaging wind over 30 yrs
- Air quality 2/10 Low 1 unhealthy d/yr today · 2 by 30 yrs out
Nearby sold comps map
Loading sold comps map…
Walkable amenities ~0.75 mi
Loading nearby amenities…
Taxation est. · year 1
- Rental income
- $30,911
- − Mortgage interest
- −$12,598
- − Property taxes
- −$6,271
- − Insurance
- −$1,922
- − Repairs & maintenance
- −$2,473
- − Management
- −$2,473
- − Depreciation
- −$6,543
- Taxable loss
- −$1,369
- Est. tax savings @ 24.0%
- +$328
- After-tax cash flow
- $2,402/yr
For passive investors: Depreciation is non-cash, so a rental often shows a tax loss while cash-flowing — sheltering income. Rental losses are passive: they offset passive income freely, and up to $25,000/yr can offset ordinary (W-2) income if you actively participate and your MAGI is under $100k (phasing out to $0 by $150k); unused losses carry forward. On sale, claimed depreciation is recaptured at up to 25%, and gains may owe capital-gains tax (a 1031 exchange can defer both). Figures are a year-1 estimate at your 24.0% rate — not tax advice; consult a CPA.
Schools (NCES district)
- District
- Miami-Dade
- NCES district ID
- 1200390
- Math proficiency
- 45% ▼ -16.00%
- Reading proficiency
- 54% ▼ -5.00%
- Median HH income
- $43,928
- Composite
- 41.76/100
- National rank
- #3397
- State rank
- #40 of 73 in FL
Livability — Opa-locka
No livability data for this city. (Only ~50 U.S. cities are tracked.)
Census & demographics
- Census place
- Opa-locka, FL
- County
- Miami-Dade County · 2,697,751 people
- City population
- 68,714
- Metro
- Miami-Fort Lauderdale-Pompano Beach, FL
- Population (ZIP)
- 31,055
- Household income
- $45,710
- Rent vs Own
- Severe rent burden
- 1811.0
Population outlook (Miami-Dade County) Hauer SSP2
- Today (2025)
- 3,126,439 people
- By 2030
- 3,325,765 · +6.4%
- By 2040
- 3,697,561 · +18.3%
- By 2050
- 4,012,134 · +28.3%
- By 2075
- 4,605,612 · +47.3%
- By 2100
- 4,866,598 · +55.7%
Race, ethnicity, and origin ACS 2023
- Neighborhood character
- Majority Black (51%)
- Race & ethnicity
- Black 51% Hispanic / Latino 44% Two or more races 29% White 3%
- Hispanic origin (detail)
- Puerto Rican 2% Cuban 27% Dominican 3%
- Common ancestry
- Hispanic 5%
- Foreign-born
- 36% · Canada, Jamaica, Vietnam
- Languages at home
- 52% English-only · Spanish 42% French/Haitian/Cajun 5% Chinese 1%
Political lean MEDSL · Miami-Dade
- 2024 margin
- R (+11.4) · D 43.9% · R 55.4%
- 2008→2024 swing
- -27.6pp toward R · 2008: 16.1pp · 2024: -11.4pp
- All cycles
- 2024: R+11.4 2020: D+7.3 2016: D+29.6 2012: D+23.7 2008: D+16.1
Not yet ingested
- Civics
- —
Market trends
- HPI YoY
- ▼ -129.05%
- Current HPI
- 681.4827
- Rent YoY
- ▲ 4.86%
- Metro
- Miami-Fort Lauderdale-Pompano Beach, FL
- State GDP YoY
- ▲ 3.28%
- F500 in state
- 36
Industry mix (Fortune 500 HQ in FL)
| Industry | F500 HQs | Revenue |
|---|---|---|
| Industrial Technology | 2 | $29B |
|
||
| Insurance | 2 | $17B |
|
||
| Retail | 1 | $60B |
|
||
| Technology Distribution | 1 | $58B |
|
||
| Homebuilding | 1 | $35B |
|
||
| Technology Manufacturing | 1 | $35B |
|
||
Price history
+561.5% since first listed4 events — show timeline
- 2026-05-27 Listed $224,900 MARMLS
- 1985-11-01 Sold (Public Records) $54,000 Public Records
- 1981-09-01 Sold (Public Records) $8,000 Public Records
- 1979-12-01 Sold (Public Records) $34,000 Public Records
Property tax history
+14.6%/yrLatest (2025): $6,271 · +6.7% YoY. Source: county tax records.
Cash-flow waterfall
monthlySold comps — $/sqft
last 12 mo · ≤1 miLoading sold comps…