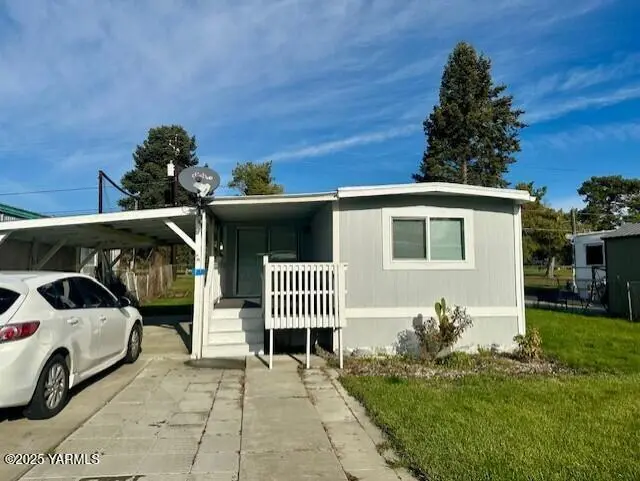
451 Pence Rd #20 · Gleed, WA
Flood risk 8/10 · Major
- FEMA flood zone
- AE
- Chance of flooding over 30 yrs
- 0.78%
- Est. flood insurance / yr
- $1,737 – $8,500
Fire risk 5/10 · Moderate
- Est. fire insurance / yr
- $604 – $1,122
Heat risk 4/10 · Minor
- Hot days now (above 97°F)
- 7 days/yr
- Hot days in 30 yrs
- 14 days/yr
Wind risk 1/10 · Minimal
- Chance of severe wind over 30 yrs
- —
Air-quality risk 9/10 · Severe
- Unhealthy air days now
- 14 days/yr
- Unhealthy air days in 30 yrs
- 16 days/yr
Risk factors via First Street. Map © Google.
Why this score? — see what drove the B grade
The composite is a weighted blend of 9 inputs, each scored 0–100. Each bar is that input's sub-score; the figure is the points it added to the 100-point composite (weight × sub-score).
- Cash flow +30.0/30.0
- 1% rule +10.0/10.0
- DSCR +10.0/10.0
- ARV discount +7.5/15.0
- Schools +4.8/10.0
- Rent growth +4.1/5.0
- Livability +3.2/5.0
- Condition / age +2.5/5.0
- Appreciation +0.0/10.0
$42,500
🖨 Deal sheet (PDF) 📄 Offer letter ✓ Due diligence
Listing remarks
Welcome to Suntides Mobile Court! This all-ages community offers a fantastic location--just steps from the beautiful Suntides Golf Course and only minutes from shopping, dining, and recreation. This affordable home is perfect for those looking to downsize, just starting out, or seeking a convenient lock-and-leave lifestyle for travel or work on the road. Enjoy hassle-free living on a low-maintenance lot with a covered front porch--ideal for relaxing or hosting a BBQ--and an attached carport for added convenience. Come take a look and see if this home is the right fit for you!
Key facts
- Covered front porch
- Low-maintenance lot
- Attached carport
Tags
Property features AI
Finance
- Other: Zoned RT - Rural Trans
Exterior
- Utilities: Shared well water; Sewer connected
- Home design: Manufactured home on leased land; Residential property
- Construction: Wood siding construction; 732 above-grade finished area
- Exterior features: Metal roof; Shed on property
Interior
- Kitchen: Dishwasher, Range, Refrigerator
- Bedrooms: 1 bedroom
- Flooring: Vinyl flooring
- Bathrooms: 1 full bathroom
- Heating & cooling: Electric heating
- Interior features: Dishwasher, Range, Refrigerator
- Laundry & utility: Washer, Dryer
Neighborhood map
What this means for you Summary
Snapshot
- This is a 2-bed/2.0-bath single-family listed at $42k.
Deal economics
- At list price, monthly cash flow is $478 ($6k/yr) — positive.
- The deal already cash-flows at list — no discount required.
- Meets the 1% rule at list price ($2k rent vs $42k).
Location & tenants
- Location reads 64/100 on livability (#359 in WA) — a middle-class / working-renter tenant base. Strengths: housing A+, crime A-; Watch: amenities F, commute F, health & safety F.
- Naches Valley School District (rural): math 48% / reading 59% proficiency, ranked #112 of 291 in WA (top 38%) — acceptable for families but not a draw, mixed tenant base, ~2y average lease.
- Zoned schools: Naches Valley Elementary School (502 students, 56% FRL); Naches Valley Middle School (395 students, 58% FRL); Naches Valley High School (396 students, 55% FRL) — zoned schools average 56% FRL vs 37% district-wide (20 pts higher); higher-poverty schools than district average — tighter screening recommended.
- Market conditions: Rents rising fast (+6.5%/yr); 331 active listings in the ZIP; solid renter incomes; 468 units permitted in Yakima County in 2024 (23 in 5+ unit buildings).
Forward outlook
- Local home prices are declining (-3.0%/yr); year-one equity from $294 of loan paydown is wiped out by about $1k of value loss. Plan a longer hold.
- Yakima County population projected at +6% by 2050 — modest demand growth; plan on rents tracking national, not racing it.
- At projected returns (-3.0% appreciation + 6.5% rent growth), your $12k cash investment doubles in ~3 years — after that, you're playing with house money.
Negotiation context
- Only 12 days on market — expect competitive offers; lowballing is unlikely to land.
- 6 sale attempts since 4y ago with the ask held roughly flat each time — persistent listings suggest the price (not the market) is what's stuck; bring a comps-based counter.
Risks & watch-outs
- Watch-outs: flood insurance adds $427/mo.
- Climate carrying-cost: in FEMA flood zone AE (mandatory federal flood insurance); moderate wildfire risk — expect insurance premiums to compound above CPI over the hold.
Questions for the listing agent
- Built in 1969 — when were the roof, HVAC, electrical panel, plumbing, and water heater last replaced?
- What's the actual annual flood-insurance premium (NFIP or private), and is the property in a SFHA with mandatory coverage?
- Is there a deadline driving the sale (1031 exchange, divorce, estate, relocation)? That informs how much negotiation room exists.
- Schools are F-rated, which usually means shorter tenancies and higher turnover. Who's the typical renter profile here, and what's been the actual vacancy rate?
- What's the average days-on-market for RENTAL listings here right now (not sales)? A rising rental-DOM trend means longer vacancies and softer asking-rent achievability than the comps imply.
- What's the recent tenant-quality profile in this submarket — average credit score on applications, eviction rate, late-payment / NSF rate, and stable-employment percentage? A property-management company in the area should have these aggregated.
- How much new for-sale + rental construction is in the pipeline within 1–3 miles? Heavy new supply typically softens prices + rents 12–24 months out; constrained supply supports both.
Investment metrics
- 1% rule
- 3.57% ✓
- Cap rate
- 31.83%
- Cash-on-cash
- 91.19%
- DSCR
- 5.06
- GRM
- 2.3
CMA / ARV
- ARV (median comp)
- $217,014
- List price
- $42,500
- Delta
- -79.08%
- Verdict
- UNDERPRICED
- Comps
- 5 within 2.0 mi
Projected returns pro-forma
-3.0% appreciation · 6.45% rent growth · sell at horizon
- IRR
- 51.9%
- Equity multiple
- 3.46×
- Total profit
- $29,275
- Equity at exit
- $6,337
- IRR
- 59.3%
- Equity multiple
- 8.55×
- Total profit
- $89,828
- Equity at exit
- $3,675
Cash invested: $11,900 (down + closing). Projections, not guarantees.
Landlord ↔ Tenant lean methodology
- Overall (STATE)
- 28 Tenant-Leaning
- State Washington
- 28 Tenant-Leaning · D+8
- County
- — inherits STATE
- City
- — inherits STATE
ZIP-level market 98908
- Rents YoY
- 6.5%
- Active inventory
- 331
- Price-to-rent
- 2.3×
Monthly cashflow live
- Estimated rent
- $1,517 medium interval (Pro) →
- Mortgage (P&I)
- −$223
- Tax est. 1.5%
- −$53 /mo · $638/yr
- Insurance
- −$18
- Flood insurance flood zone
- −$427 /mo · $5,118/yr
- HOA
- −$0
- Vacancy / Maint / Mgmt
- −$318
- Net cashflow
- $478
Break-even live
Sensitivity live
| Price | -10% $507 | -5% $492 | +0% $478 | +5% $463 | +10% $448 |
|---|---|---|---|---|---|
| Rent | -10% $358 | -5% $418 | +0% $478 | +5% $538 | +10% $598 |
| Rate | -1.0pp $499 | -0.5pp $489 | base $478 | +0.5pp $467 | +1.0pp $456 |
UW: 25.0% down · 7.5% · 30yr · 1.5% tax · 5.0% vac · 8.0% maint · 8.0% mgmt
Financing live
Cash to close
- Down payment
- $10,625
- Closing costs
- $1,275
- Reserves months
- —
- Total cash needed
- —
Loan-product check · same deal, 3 products live
Conventional
25% down · 7.5% · 30yr
- Down + closing
- —
- Monthly P&I
- —
- Monthly cashflow
- —
- DSCR
- —
- Eligible?
- —
Personal DTI + credit; lowest rate.
DSCR
20% down · 8.5% · 30yr
- Down + closing
- —
- Monthly P&I
- —
- Monthly cashflow
- —
- DSCR
- —
- Eligible?
- —
No personal income docs; deal must DSCR.
Hard money
10% down · 12.0% · 12mo
- Down + closing
- —
- Monthly P&I
- —
- Monthly cashflow
- —
- DSCR
- —
- Eligible?
- —
Short-term bridge; refi at stabilization.
Listing history 23 events
-
2026-06-21days on market $42,500 Active 12 DOM
-
2026-06-19days on market $42,500 Active 10 DOM
-
2026-06-18days on market $42,500 Active 9 DOM
-
2026-06-17days on market $42,500 Active 8 DOM
-
2026-06-16days on market $42,500 Active 7 DOM
-
2026-06-15days on market $42,500 Active 6 DOM
-
2026-06-14days on market $42,500 Active 4 DOM
-
2026-06-13days on market $42,500 Active 3 DOM
-
2026-06-10remarks 582-char remark
-
2026-06-10pricedays on market $42,500 Active 1 DOM
-
2026-05-30days on market $45,400 Active 200 DOM
-
2026-03-20price $45,400 582-char remark
-
2025-11-11$48,900 Active 582-char remark
-
2025-11-10status Active
-
2025-02-17$69,900 Active
-
2024-06-27soldstatus $41,000 Closed
-
2024-05-26status Pending
-
2024-04-26price $54,900
-
2024-01-25price $59,900
-
2023-11-06$64,900 Active
-
2023-01-13soldstatus $59,000 Closed
-
2022-12-15status Pending
-
2022-09-15$65,500 Active
ⓘ Source: listings_history table (triggers on properties + properties_extension) + one-shot
backfill from property_details.listing_events for pre-trigger history.
Climate risk First Street
- Flood 8/10 Severe FEMA zone AE · 78% chance over 30 yrs
- Wildfire 5/10 Major
- Heat 4/10 Moderate 7 d/yr ≥97°F today · 14 d/yr by 30 yrs out
- Wind 1/10 Low
- Air quality 9/10 Extreme 14 unhealthy d/yr today · 16 by 30 yrs out
Nearby sold comps map
Loading sold comps map…
Walkable amenities ~0.75 mi
Loading nearby amenities…
Taxation est. · year 1
- Rental income
- $18,198
- − Mortgage interest
- −$2,381
- − Property taxes
- −$638
- − Insurance
- −$5,331
- − Repairs & maintenance
- −$1,456
- − Management
- −$1,456
- − Depreciation
- −$1,236
- Taxable income
- $5,701
- Est. tax owed @ 24.0%
- −$1,368
- After-tax cash flow
- $4,365/yr
For passive investors: Depreciation is non-cash, so a rental often shows a tax loss while cash-flowing — sheltering income. Rental losses are passive: they offset passive income freely, and up to $25,000/yr can offset ordinary (W-2) income if you actively participate and your MAGI is under $100k (phasing out to $0 by $150k); unused losses carry forward. On sale, claimed depreciation is recaptured at up to 25%, and gains may owe capital-gains tax (a 1031 exchange can defer both). Figures are a year-1 estimate at your 24.0% rate — not tax advice; consult a CPA.
Schools (NCES district)
- District
- Naches Valley School District
- NCES district ID
- 5305460
- Math proficiency
- 48% ▼ -2.00%
- Reading proficiency
- 59% ▲ 1.00%
- Median HH income
- $55,781
- Composite
- 48.09/100
- National rank
- #4761
- State rank
- #112 of 291 in WA
Livability — Gleed
- Score
- 64/100
- State rank
- #359
- US rank
- #13669
Category grades
Schools grade is shown separately in the Schools card above.
Census & demographics
- Census place
- Gleed, WA
- County
- Yakima County · 134,789 people
- Metro
- Yakima, WA
- Population (ZIP)
- 38,060
- Household income
- $84,197
- Rent vs Own
- Severe rent burden
- 1265.0
Population outlook (Yakima County) Hauer SSP2
- Today (2025)
- 256,514 people
- By 2030
- 259,403 · +1.1%
- By 2040
- 265,677 · +3.6%
- By 2050
- 273,061 · +6.5%
- By 2075
- 296,991 · +15.8%
- By 2100
- 315,291 · +22.9%
Race, ethnicity, and origin ACS 2023
- Neighborhood character
- Predominantly White (68%)
- Race & ethnicity
- White 68% Hispanic / Latino 24% Two or more races 12% Asian 2%
- Hispanic origin (detail)
- Mexican 22%
- Common ancestry
- Portuguese 4% Italian 3% Lithuanian 2%
- Foreign-born
- 7% · Canada, China, South Korea
- Languages at home
- 82% English-only · Spanish 16% German/W. Germanic 1%
Political lean MEDSL · Yakima
- 2024 margin
- R (+14.3) · D 41.6% · R 55.9% · Other 2.5%
- 2008→2024 swing
- -3.8pp toward R · 2008: -10.6pp · 2024: -14.3pp
- All cycles
- 2024: R+14.3 2020: R+7.7 2016: R+15.4 2012: R+15.1 2008: R+10.6
Not yet ingested
- Civics
- —
Market trends
- HPI YoY
- ▼ -337.28%
- Current HPI
- 258.8688
- Rent YoY
- ▲ 6.45%
- Metro
- Yakima, WA
- State GDP YoY
- ▲ 4.65%
- F500 in state
- 22
Industry mix (Fortune 500 HQ in WA)
| Industry | F500 HQs | Revenue |
|---|---|---|
| Retail | 2 | $269B |
|
||
| Technology / Retail | 1 | $638B |
|
||
| Technology | 1 | $245B |
|
||
| Telecommunications | 1 | $38B |
|
||
| Food / Beverage | 1 | $36B |
|
||
| Automotive / Trucks | 1 | $34B |
|
||
Price history
-35.1% since first listed13 events — show timeline
- 2026-06-09 Listed $42,500 YAMLS
- 2026-03-20 Price Changed $45,400 YAMLS
- 2025-11-11 Listed $48,900 YAMLS
- 2025-11-10 Relisted — YAMLS
- 2025-02-17 Listed $69,900 YAMLS
- 2024-06-27 Sold (MLS) $41,000 YAMLS
- 2024-05-26 Pending — YAMLS
- 2024-04-26 Price Changed $54,900 YAMLS
- 2024-01-25 Price Changed $59,900 YAMLS
- 2023-11-06 Listed $64,900 YAMLS
- 2023-01-13 Sold (MLS) $59,000 YAMLS
- 2022-12-15 Pending — YAMLS
- 2022-09-15 Listed $65,500 YAMLS
Property tax history
-0.7%/yrLatest (2017): $68 · -1.4% YoY. Source: county tax records.
Cash-flow waterfall
monthlySold comps — $/sqft
last 12 mo · ≤1 miLoading sold comps…