 Duplex
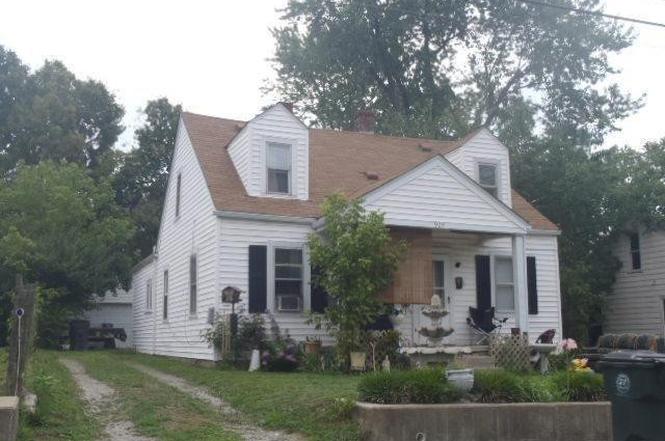
905 Byars Ave · Lexington-Fayette, KY
Flood risk 1/10 · Minimal
- FEMA flood zone
- X (unshaded)
- Chance of flooding over 30 yrs
- 0.0%
- Est. flood insurance / yr
- $507 – $1,088
Fire risk 1/10 · Minimal
- Est. fire insurance / yr
- $839 – $1,559
Heat risk 4/10 · Minor
- Hot days now (above 101°F)
- 7 days/yr
- Hot days in 30 yrs
- 19 days/yr
Wind risk 2/10 · Minimal
- Chance of severe wind over 30 yrs
- 2.0%
Air-quality risk 1/10 · Minimal
- Unhealthy air days now
- 0 days/yr
- Unhealthy air days in 30 yrs
- 0 days/yr
Risk factors via First Street. Map © Google.
Why this score? — see what drove the B- grade
The composite is a weighted blend of 9 inputs, each scored 0–100. Each bar is that input's sub-score; the figure is the points it added to the 100-point composite (weight × sub-score).
- Cash flow +30.0/30.0
- 1% rule +10.0/10.0
- DSCR +10.0/10.0
- ARV discount +7.5/15.0
- Rent growth +3.6/5.0
- Schools +3.4/10.0
- Livability +2.5/5.0
- Condition / age +2.5/5.0
- Appreciation +0.0/10.0
$168,500
🖨 Deal sheet (PDF) 📄 Offer letter ✓ Due diligence
Multi-family units
County records classify this as Multi-Family (2-4 Unit). Listing-text estimate: 2 units. confirmed
Listing remarks MLS
One side is vacant.
Key facts
- 6,229 sq ft lot
- Built 1948
- Listed 149 days
Property features AI
Exterior
- Utilities: Electricity connected; Sewer connected; Water connected
- Home design: Duplex; 1,527 total building area
- Construction: R-1 zoning
- Exterior features: Shingle roof
Interior
- Bathrooms: 2 full bathrooms
- Interior features: Baseboard heating; Wall unit cooling
Neighborhood map
What this means for you Summary
Snapshot
- This is a 2 × 2-bed/1.0-bath units multifamily listed at $168k.
Deal economics
- At list price, monthly cash flow is $995 ($12k/yr) — positive. Per door: $497/mo.
- The deal already cash-flows at list — no discount required.
- Meets the 1% rule at list price ($3k rent vs $168k).
- Recommended offer: $148k (12.0% below list) — sets the bar for market timing.
- Cap rate 13.4% vs local median 3.8% in Lexington-Fayette — top-decile yield for the area; either an underpriced asset or a hidden risk that comps aren't pricing in. Stress-test before assuming the spread holds.
Location & tenants
- Location reads: area grade B — affects rentability + tenant quality, not the cash-flow math above.
- Fayette County (urban): math 35% / reading 45% proficiency, ranked #27 of 165 in KY (top 16%) — families likely to look elsewhere, expect single-tenant / working-renter base with shorter leases.
- Zoned schools: Crawford Middle School (math 15% / reading 31%, grade F, #197 of 217 statewide, top 92%, 751 students, 68% FRL); Frederick Douglass High School (math 36% / reading 42%, grade F, #51 of 254 statewide, top 21%, 1,667 students, 43% FRL).
- Market conditions: Rents rising fast (+4.3%/yr); 68 active listings in the ZIP; 18 comparable units currently listed for rent nearby; rentals at typical pace (median 25d on market — plan ~3-4 weeks tenant-placement turnaround); 1,036 units permitted in Fayette County in 2024 (542 in 5+ unit buildings).
- At $2,539/mo this rent would consume 52% of the median local household income ($58k/yr) (locally 1232% of renters already pay >50% of income on rent) — very limited rent-growth headroom before tenants either downsize or default.
Forward outlook
- Local home prices are declining (-3.0%/yr); year-one equity from $1k of loan paydown is wiped out by about $5k of value loss. Plan a longer hold.
- Fayette County population projected at +35% by 2050 — long-run rental-demand tailwind backs the buy-and-hold thesis.
- At projected returns (-3.0% appreciation + 4.3% rent growth), your $47k cash investment doubles in ~5 years — after that, you're playing with house money.
Negotiation context
- It's been on market 150 days — a 12% lower offer ($148k) is reasonable based on typical stale-listing flexibility.
- 2 sale attempts since 12y ago; this cycle's ask has dropped $21k (11%) from the opening price — seller is motivated, your offer sets the floor, not the list.
Risks & watch-outs
- Watch-outs: built in 1948 — expect roof / HVAC / electrical / plumbing capex.
Questions for the listing agent
- It's been on market 150 days. Have you received any prior offers? Is the seller open to a 12% concession, seller financing, or rate buy-down credit?
- Can we see the unit-by-unit rent roll, current vacancy, and any below-market leases? What's the average tenancy length?
- What capital expenditures (roof, boiler, parking lot, exteriors) have been made in the last 5 years, and what's planned in the next 2?
- Built in 1948 — when were the roof, HVAC, electrical panel, plumbing, and water heater last replaced?
- Why hasn't it sold? Are there any deal-killer items the seller is aware of (foundation, flood, title, zoning, code violations)?
- Is there a deadline driving the sale (1031 exchange, divorce, estate, relocation)? That informs how much negotiation room exists.
- What's the average days-on-market for RENTAL listings here right now (not sales)? A rising rental-DOM trend means longer vacancies and softer asking-rent achievability than the comps imply.
- What's the recent tenant-quality profile in this submarket — average credit score on applications, eviction rate, late-payment / NSF rate, and stable-employment percentage? A property-management company in the area should have these aggregated.
- How much new apartment / multifamily construction is in the pipeline within 1–3 miles? Heavy new supply (>2% of stock underway) typically softens rents 12–24 months out; light construction supports rent growth.
Investment metrics
- 1% rule
- 1.51% ✓
- Cap rate
- 13.38%
- Cash-on-cash
- 25.30%
- DSCR
- 2.13
- GRM
- 5.5
CMA / ARV
No comps found within radius.
Projected returns pro-forma
-3.0% appreciation · 4.31% rent growth · sell at horizon
- IRR
- 20.2%
- Equity multiple
- 1.83×
- Total profit
- $39,377
- Equity at exit
- $25,124
- IRR
- 29.2%
- Equity multiple
- 3.75×
- Total profit
- $129,920
- Equity at exit
- $14,569
Cash invested: $47,180 (down + closing). Projections, not guarantees.
Landlord ↔ Tenant lean methodology
- Overall (STATE)
- 83 Strongly Landlord-Friendly
- State Kentucky
- 83 Strongly Landlord-Friendly · R+16
- County
- — inherits STATE
- City
- — inherits STATE
ZIP-level market 40505
- Rents YoY
- 4.3%
- Active inventory
- 68
- Price-to-rent
- 11.1×
Monthly cashflow live
- Estimated rent
- $2,539 high interval (Pro) →
- Mortgage (P&I)
- −$884
- Tax from tax record
- −$57 /mo · $688/yr
- Insurance
- −$70
- HOA
- −$0
- Vacancy / Maint / Mgmt
- −$533
- Net cashflow
- $995
Break-even live
Sensitivity live
| Price | -10% $1,090 | -5% $1,042 | +0% $995 | +5% $947 | +10% $899 |
|---|---|---|---|---|---|
| Rent | -10% $794 | -5% $894 | +0% $995 | +5% $1,095 | +10% $1,195 |
| Rate | -1.0pp $1,079 | -0.5pp $1,037 | base $995 | +0.5pp $951 | +1.0pp $907 |
2-unit breakdown (identical units grouped — click to expand)
| Units | Beds | Baths | Est. rent |
|---|---|---|---|
| 2× units | 2 | 1 | $2,540 |
| #1 | 2 | 1 | $1,270 |
| #2 | 2 | 1 | $1,270 |
| Total (2 units) | $2,539 | ||
UW: 25.0% down · 7.5% · 30yr · 1.5% tax · 5.0% vac · 8.0% maint · 8.0% mgmt
Financing live
Cash to close
- Down payment
- $42,125
- Closing costs
- $5,055
- Reserves months
- —
- Total cash needed
- —
Loan-product check · same deal, 3 products live
Conventional
25% down · 7.5% · 30yr
- Down + closing
- —
- Monthly P&I
- —
- Monthly cashflow
- —
- DSCR
- —
- Eligible?
- —
Personal DTI + credit; lowest rate.
DSCR
20% down · 8.5% · 30yr
- Down + closing
- —
- Monthly P&I
- —
- Monthly cashflow
- —
- DSCR
- —
- Eligible?
- —
No personal income docs; deal must DSCR.
Hard money
10% down · 12.0% · 12mo
- Down + closing
- —
- Monthly P&I
- —
- Monthly cashflow
- —
- DSCR
- —
- Eligible?
- —
Short-term bridge; refi at stabilization.
Rent comps 18 comps
| Address | Beds | Baths | Sqft | Rent | $/sqft | DOM | Units | Dist |
|---|---|---|---|---|---|---|---|---|
| 324 Hillcrest Ave Unit Z1 Lexington, KY | 3.0 | 2.0 | 1550 | $1,499 | $0.97 | 22d | 1 | 0.14mi |
| 1105 Sparks Rd Lexington, KY | 3.0 | 1.0 | 1302 | $1,575 | $1.21 | 24d | 1 | 0.40mi |
| 1120 Sparks Rd Lexington, KY | 3.0 | 1.0 | 1200 | $1,600 | $1.33 | 22d | 1 | 0.48mi |
| 303 Owsley Ave Lexington, KY | 3.0 | 2.0 | 1188 | $2,100 | $1.77 | 15d | 1 | 0.65mi |
| 425 Hawkins Ave Lexington, KY | 3.0 | 1.5 | 1124 | $1,570 | $1.40 | 15d | 1 | 0.81mi |
| 658 Elm Tree Ln Lexington, KY | 3.0 | 2.0 | 1350 | $1,800 | $1.33 | 24d | 1 | 0.81mi |
| 706 Lancaster Ave Lexington, KY | 3.0 | 3.0 | 1050 | $1,495 | $1.42 | 15d | 1 | 0.81mi |
| 458 Morgan Ave Lexington, KY | 3.0 | 1.0 | 1275 | $1,325 | $1.04 | 24d | 1 | 0.85mi |
| 443 Shawnee Ave Lexington, KY | 4.0 | 1.0 | 1435 | $1,600 | $1.11 | 24d | 1 | 0.93mi |
| 211 E Sixth St Lexington, KY | 3.0 | 1.0 | 1400 | $1,500 | $1.07 | 24d | 1 | 0.93mi |
| 411 Morgan Ave Lexington, KY | 3.0 | 2.0 | 1160 | $1,600 | $1.38 | 22d | 1 | 0.97mi |
| 170 E Loudon Ave Unit 2 Lexington, KY | 3.0 | 1.0 | 1500 | $1,350 | $0.90 | 24d | 1 | 0.97mi |
| 627 N Martin Luther King Blvd Lexington, KY | 4.0 | 2.0 | 1440 | $1,400 | $0.97 | 24d | 1 | 0.98mi |
| 132 Bassett Ave Lexington, KY | 3.0 | 2.0 | 1850 | $2,900 | $1.57 | 22d | 1 | 1.01mi |
| 222 W Sixth St Lexington, KY | 3.0 | 1.5 | 1050 | $1,150 | $1.10 | 24d | 1 | 1.24mi |
| 1211 N Limestone Lexington, KY | 3.0 | 1.0 | 1300 | $1,050 | $0.81 | 24d | 1 | 1.26mi |
| 444 N Broadway Lexington, KY | 3.0 | 1.0 | 1160 | $1,595 | $1.38 | 24d | 1 | 1.39mi |
| 374 Park Ave Lexington, KY | 4.0 | 2.0 | 1513 | $3,500 | $2.31 | 15d | 1 | 1.49mi |
Listing history 12 events
-
2026-05-04price $168,500
-
2026-04-22price $169,900
-
2026-03-06price $174,900
-
2026-02-12price $179,900
-
2026-02-04price $184,900
-
2025-12-30$189,900 Active
-
2025-09-22soldstatus $155,000
-
2017-05-03soldstatus $75,000
-
2014-10-13soldstatus $57,000
-
2014-10-08soldstatus $57,000 19-char remark
Show marketing remark (19 chars)
One side is vacant.
-
2014-09-21historical 19-char remark
Show marketing remark (19 chars)
One side is vacant.
-
2014-09-05$70,000 19-char remark
Show marketing remark (19 chars)
One side is vacant.
ⓘ Source: listings_history table (triggers on properties + properties_extension) + one-shot
backfill from property_details.listing_events for pre-trigger history.
Tax reassessment forecast KY · Resets to sale price
- Current annual tax
- $688 · $57/mo
- Projected year-2 tax
- $1,449 · $121/mo
- Expected delta
- +$761/yr (+$63/mo · 110.5%)
ⓘ Screening estimate from a state-policy table — verify with the county assessor before closing.
Climate risk First Street
- Flood 1/10 Low FEMA zone X (unshaded) · 0% chance over 30 yrs
- Wildfire 1/10 Low
- Heat 4/10 Moderate 7 d/yr ≥101°F today · 19 d/yr by 30 yrs out
- Wind 2/10 Low 2% chance of damaging wind over 30 yrs
- Air quality 1/10 Low 0 unhealthy d/yr today · 0 by 30 yrs out
Nearby sold comps map
Loading sold comps map…
Walkable amenities ~0.75 mi
Loading nearby amenities…
Taxation est. · year 1
- Rental income
- $30,468
- − Mortgage interest
- −$9,439
- − Property taxes
- −$688
- − Insurance
- −$842
- − Repairs & maintenance
- −$2,437
- − Management
- −$2,437
- − Depreciation
- −$4,902
- Taxable income
- $9,722
- Est. tax owed @ 24.0%
- −$2,333
- After-tax cash flow
- $9,602/yr
For passive investors: Depreciation is non-cash, so a rental often shows a tax loss while cash-flowing — sheltering income. Rental losses are passive: they offset passive income freely, and up to $25,000/yr can offset ordinary (W-2) income if you actively participate and your MAGI is under $100k (phasing out to $0 by $150k); unused losses carry forward. On sale, claimed depreciation is recaptured at up to 25%, and gains may owe capital-gains tax (a 1031 exchange can defer both). Figures are a year-1 estimate at your 24.0% rate — not tax advice; consult a CPA.
Schools (NCES district)
- District
- Fayette County
- NCES district ID
- 2101860
- Math proficiency
- 35% ▼ -16.00%
- Reading proficiency
- 45% ▼ -13.00%
- Median HH income
- $49,245
- Composite
- 34.38/100
- National rank
- #5211
- State rank
- #27 of 165 in KY
Livability — Lexington-Fayette
No livability data for this city. (Only ~50 U.S. cities are tracked.)
Census & demographics
- Census place
- Lexington-Fayette, KY
- County
- Fayette County · 317,143 people
- City population
- 321,882
- Metro
- Lexington-Fayette, KY
- Population (ZIP)
- 25,594
- Household income
- $58,206
- Rent vs Own
- Severe rent burden
- 1232.0
Population outlook (Fayette County) Hauer SSP2
- Today (2025)
- 363,454 people
- By 2030
- 388,270 · +6.8%
- By 2040
- 438,688 · +20.7%
- By 2050
- 490,667 · +35.0%
- By 2075
- 625,394 · +72.1%
- By 2100
- 721,354 · +98.5%
Race, ethnicity, and origin ACS 2023
- Neighborhood character
- Predominantly White (65%)
- Race & ethnicity
- White 65% Black 17% Hispanic / Latino 13% Two or more races 10%
- Hispanic origin (detail)
- Mexican 9% Cuban 2%
- Common ancestry
- Italian 3% Serbian 2% Slovak 1%
- Foreign-born
- 7% · Canada
- Languages at home
- 89% English-only · Spanish 10%
Political lean MEDSL · Fayette
- 2024 margin
- D (+18.1) · D 58.0% · R 39.9% · Other 2.1%
- 2008→2024 swing
- +13.3pp toward D · 2008: 4.8pp · 2024: 18.1pp
- All cycles
- 2024: D+18.1 2020: D+20.8 2016: D+9.5 2012: D+1.0 2008: D+4.8
Not yet ingested
- Civics
- —
Market trends
- HPI YoY
- ▼ -191.31%
- Current HPI
- 249.2066
- Rent YoY
- ▲ 4.31%
- Metro
- Lexington-Fayette, KY
- State GDP YoY
- ▲ 1.81%
- F500 in state
- 4
Industry mix (Fortune 500 HQ in KY)
| Industry | F500 HQs | Revenue |
|---|---|---|
| Healthcare | 1 | $118B |
|
||
| Food / Beverage | 1 | $7B |
|
||
Price history
+140.7% since first listed12 events — show timeline
- 2026-05-04 Price Changed $168,500 ImagineMLS
- 2026-04-22 Price Changed $169,900 ImagineMLS
- 2026-03-06 Price Changed $174,900 ImagineMLS
- 2026-02-12 Price Changed $179,900 ImagineMLS
- 2026-02-04 Price Changed $184,900 ImagineMLS
- 2025-12-30 Listed $189,900 ImagineMLS
- 2025-09-22 Sold (Public Records) $155,000 Public Records
- 2017-05-03 Sold (Public Records) $75,000 Public Records
- 2014-10-13 Sold (Public Records) $57,000 Public Records
- 2014-10-08 Sold (MLS) $57,000 ImagineMLS
- 2014-09-21 Listing Removed — ImagineMLS
- 2014-09-05 Listed $70,000 ImagineMLS
Property tax history
-22.7%/yrLatest (2015): $688 · -22.7% YoY. Source: county tax records.
Cash-flow waterfall
monthlySold comps — $/sqft
last 12 mo · ≤1 miLoading sold comps…