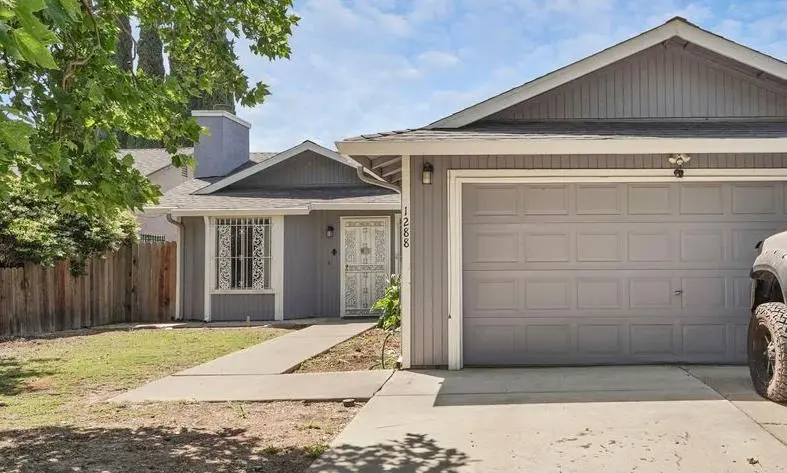
1288 Derrick Dr · Stockton, CA
Flood risk 5/10 · Moderate
- FEMA flood zone
- X
- Chance of flooding over 30 yrs
- 0.27%
- Est. flood insurance / yr
- $507 – $1,088
Fire risk 1/10 · Minimal
- Est. fire insurance / yr
- $659 – $1,223
Heat risk 7/10 · Major
- Hot days now (above 103°F)
- 7 days/yr
- Hot days in 30 yrs
- 15 days/yr
Wind risk 1/10 · Minimal
- Chance of severe wind over 30 yrs
- —
Air-quality risk 10/10 · Severe
- Unhealthy air days now
- 25 days/yr
- Unhealthy air days in 30 yrs
- 26 days/yr
Risk factors via First Street. Map © Google.
Why this score? — see what drove the D grade
The composite is a weighted blend of 9 inputs, each scored 0–100. Each bar is that input's sub-score; the figure is the points it added to the 100-point composite (weight × sub-score).
- ARV discount +14.8/15.0
- Cash flow +11.6/30.0
- DSCR +3.4/10.0
- Schools +2.9/10.0
- Livability +2.9/5.0
- Condition / age +2.5/5.0
- Rent growth +2.4/5.0
- 1% rule +2.2/10.0
- Appreciation +0.0/10.0
$360,000
🖨 Deal sheet (PDF) 📄 Offer letter ✓ Due diligence
Listing remarks
Charming 3-bedroom, 2-bathroom home offers 1,134 square feet of comfortable living space and is full of opportunity. Conveniently located near major freeways, shopping centers and schools. Enjoy a covered patio perfect for relaxing or entertaining. The front and back yards provide a blank canvas ready for your personal touch.
Key facts
- Front and back yards
- Covered patio
- 5,301 sq ft lot
Tags
Property features AI
Finance
- HOA & community: No homeowners association
Exterior
- Parking: Attached garage facing front with 2 parking spaces
- Utilities: Public water; Electric: Other; Sewer: Other; Irrigation: Other; Utilities: Other
- Home design: Detached single-family residence; One story; Built in 1989
- Construction: Composition roof
- Exterior features: Full metal and wood fencing; Pergola; Curb and gutter
Interior
- Kitchen: Free-standing gas range; Range hood; Disposal; Wine refrigerator; Ceramic countertops
- Bedrooms: 3 bedrooms (all on the main level)
- Flooring: Carpet; Tile
- Bathrooms: 2 full bathrooms; Master bath with shower stall and window; Secondary bath with tub/shower over and window
- Heating & cooling: Central heating; Fireplace heating; Central cooling; Ceiling fans
- Interior features: Cathedral/vaulted living room ceiling; Family room fireplace
- Laundry & utility: Laundry located in garage
Neighborhood map
What this means for you Summary
Snapshot
- This is a 3-bed/2.0-bath single-family listed at $360k.
Deal economics
- At list price, monthly cash flow is $-114 ($-1k/yr) — negative.
- To cash-flow at today's rent, offer at most $340k (5.6% below list).
- To meet the 1% rule (rent ≥ 1% of price), the offer needs to be $260k (27.9% below list).
- Recommended offer: $260k (27.9% below list) — sets the bar for 1% rule.
- Cap rate 5.9% vs local median 3.6% in Stockton — top-decile yield for the area; either an underpriced asset or a hidden risk that comps aren't pricing in. Stress-test before assuming the spread holds.
Location & tenants
- Location reads 57/100 on livability (#734 in CA) — a working-class tenant base; expect higher turnover. Strengths: housing A+, health & safety A, amenities A-; Watch: employment C-, crime F, commute F.
- Stockton Unified (urban): math 23% / reading 46% proficiency, ranked #295 of 517 in CA (top 57%) — families likely to look elsewhere, expect single-tenant / working-renter base with shorter leases; 78% free/reduced lunch — lower-income household profile, screen leases tightly.
- Zoned schools: San Joaquin Elementary (746 students, 70% FRL); Edison High (math 20% / reading 41%, grade F, #710 of 1,170 statewide, top 61%, 2,558 students, 74% FRL).
- Market conditions: Rents soft (-0.6%/yr); 139 active listings in the ZIP; 6 comparable units currently listed for rent nearby; rentals at typical pace (median 16d on market — plan ~3-4 weeks tenant-placement turnaround); solid renter incomes; 3,779 units permitted in San Joaquin County in 2024 (0 in 5+ unit buildings).
- This rent runs 37% of the median local income ($83k/yr) — at the standard rent-burdened threshold; future hikes will face affordability resistance.
Forward outlook
- Local home prices are declining (-3.0%/yr); year-one equity from $2k of loan paydown is wiped out by about $11k of value loss. Plan a longer hold.
- San Joaquin County population projected at +17% by 2050 — long-run rental-demand tailwind backs the buy-and-hold thesis.
Negotiation context
- Only 3 days on market — expect competitive offers; lowballing is unlikely to land.
- Current owner paid $87k; list at $360k implies a 314% gain — meaningful room to come down on a strong offer.
Risks & watch-outs
- Climate carrying-cost: moderate flood risk; extreme-heat days projected 7→15/yr by 2055 (HVAC capex compounding) — expect insurance premiums to compound above CPI over the hold.
Questions for the listing agent
- What do current leases actually rent for vs. the listed asking? Can we see a recent rent roll and the last 12 months of T-12 income?
- Is there a deadline driving the sale (1031 exchange, divorce, estate, relocation)? That informs how much negotiation room exists.
- Schools are D-rated, which usually means shorter tenancies and higher turnover. Who's the typical renter profile here, and what's been the actual vacancy rate?
- Crime grade is F in this area — have there been break-ins, vandalism, or insurance claims at this property in the last 3 years? What carrier currently insures it and at what premium?
- The area grade is low — what's the realistic commute time and amenity access for the typical tenant pool here? Any planned neighborhood developments (good or bad) we should know about?
- What's the average days-on-market for RENTAL listings here right now (not sales)? A rising rental-DOM trend means longer vacancies and softer asking-rent achievability than the comps imply.
- What's the recent tenant-quality profile in this submarket — average credit score on applications, eviction rate, late-payment / NSF rate, and stable-employment percentage? A property-management company in the area should have these aggregated.
- How much new for-sale + rental construction is in the pipeline within 1–3 miles? Heavy new supply typically softens prices + rents 12–24 months out; constrained supply supports both.
Investment metrics
- 1% rule
- 0.72% ✗
- Cap rate
- 5.91%
- Cash-on-cash
- -1.36%
- DSCR
- 0.94
- GRM
- 11.6
CMA / ARV
- ARV (median comp)
- $429,993
- List price
- $360,000
- Delta
- -16.28%
- Verdict
- UNDERPRICED
- Comps
- 20 within 1.0 mi
Show comp detail 12 sales within ~0.75 mi
| Address | Dist | Beds/Ba | Sqft | Sold | Price | $/sf | Match |
|---|---|---|---|---|---|---|---|
| 1288 Derrick Dr | 0.00mi | 3/2.0 | 1,134 (0%) | 0mo | $360,000 | $317 | 100 |
| 1328 Luna Ln | 0.09mi | 3/2.0 | 1,122 (-1%) | 3mo | $420,000 | $374 | 92 |
| 2353 Georgia Ave | 0.37mi | 3/2.0 | 1,134 (0%) | 5mo | $330,000 | $291 | 79 |
| 2453 Lever Blvd | 0.43mi | 3/1.0 | 1,134 (0%) | 0mo | $330,000 | $291 | 76 |
| 1013 Irene St | 0.23mi | 3/2.0 | 1,218 (+7%) | 4mo | $315,000 | $259 | 73 |
| 769 Colorado Ave | 0.49mi | 3/1.0 | 1,134 (0%) | 4mo | $265,000 | $234 | 70 |
| 1232 Denver A Ct | 0.43mi | 3/2.0 | 1,180 (+4%) | 4mo | $210,000 | $178 | 70 |
| 1662 Lever Blvd | 0.46mi | 3/2.0 | 1,085 (-4%) | 2mo | $347,500 | $320 | 70 |
| 2128 Green River Ln | 0.43mi | 3/2.0 | 1,234 (+9%) | 5mo | $347,000 | $281 | 61 |
| 539 Buena Vida Ct | 0.73mi | 3/2.0 | 1,176 (+4%) | 7mo | $310,000 | $264 | 54 |
| 421 Howard St | 0.69mi | 3/1.0 | 1,030 (-9%) | 5mo | $350,000 | $340 | 44 |
| 2022 Beau Pre St | 0.73mi | 3/2.0 | 1,023 (-10%) | 6mo | $430,000 | $420 | 44 |
Match score weights: distance 35% · size 25% · config 20% · recency 20%. Top-matched comps best support the ARV.
Projected returns pro-forma
-3.0% appreciation · 0.0% rent growth · sell at horizon
- IRR
- -21.5%
- Equity multiple
- 0.27×
- Total profit
- $-73,382
- Equity at exit
- $53,677
- IRR
- -23.0%
- Equity multiple
- -0.03×
- Total profit
- $-103,329
- Equity at exit
- $31,126
Cash invested: $100,800 (down + closing). Projections, not guarantees.
Landlord ↔ Tenant lean methodology
- Overall (STATE)
- 18 Strongly Tenant-Friendly
- State California
- 18 Strongly Tenant-Friendly · D+13
- County
- — inherits STATE
- City
- — inherits STATE
ZIP-level market 95206
- Rents YoY
- -0.6%
- Active inventory
- 139
- Price-to-rent
- 11.6×
Monthly cashflow live
- Estimated rent
- $2,597 high interval (Pro) →
- Mortgage (P&I)
- −$1,888
- Tax from tax record
- −$128 /mo · $1,537/yr
- Insurance
- −$150
- HOA
- −$0
- Vacancy / Maint / Mgmt
- −$545
- Net cashflow
- $-114
Break-even live
Sensitivity live
| Price | -10% $90 | -5% $-12 | +0% $-114 | +5% $-216 | +10% $-318 |
|---|---|---|---|---|---|
| Rent | -10% $-319 | -5% $-217 | +0% $-114 | +5% $-12 | +10% $91 |
| Rate | -1.0pp $67 | -0.5pp $-23 | base $-114 | +0.5pp $-208 | +1.0pp $-302 |
UW: 25.0% down · 7.5% · 30yr · 1.5% tax · 5.0% vac · 8.0% maint · 8.0% mgmt
Financing live
Cash to close
- Down payment
- $90,000
- Closing costs
- $10,800
- Reserves months
- —
- Total cash needed
- —
Loan-product check · same deal, 3 products live
Conventional
25% down · 7.5% · 30yr
- Down + closing
- —
- Monthly P&I
- —
- Monthly cashflow
- —
- DSCR
- —
- Eligible?
- —
Personal DTI + credit; lowest rate.
DSCR
20% down · 8.5% · 30yr
- Down + closing
- —
- Monthly P&I
- —
- Monthly cashflow
- —
- DSCR
- —
- Eligible?
- —
No personal income docs; deal must DSCR.
Hard money
10% down · 12.0% · 12mo
- Down + closing
- —
- Monthly P&I
- —
- Monthly cashflow
- —
- DSCR
- —
- Eligible?
- —
Short-term bridge; refi at stabilization.
Rent comps 6 comps
| Address | Beds | Baths | Sqft | Rent | $/sqft | DOM | Units | Dist |
|---|---|---|---|---|---|---|---|---|
| 2234 Wall St Stockton, CA | 4.0 | 2.0 | 1452 | $2,800 | $1.93 | 16d | 1 | 0.70mi |
| 2234 Wall St Stockton, CA | 4.0 | 2.0 | 1452 | $2,800 | $1.93 | 13d | 1 | 0.70mi |
| 137 W 3rd St Stockton, CA | 2.0 | 1.0 | 833 | $1,795 | $2.15 | 25d | 1 | 1.04mi |
| 17 W 6th St Stockton, CA | 2.0 | 1.0 | 720 | $1,850 | $2.57 | 5d | 1 | 1.14mi |
| 114 E 4th St Stockton, CA | 2.0 | 1.0 | 950 | $1,750 | $1.84 | 25d | 1 | 1.20mi |
| 1107 Le Corbusier Ct Stockton, CA | 4.0 | 2.0 | 1200 | $2,500 | $2.08 | 12d | 1 | 1.38mi |
Listing history 2 events
-
2009-03-31soldstatus $87,000
-
2005-01-07soldstatus $285,000
ⓘ Source: listings_history table (triggers on properties + properties_extension) + one-shot
backfill from property_details.listing_events for pre-trigger history.
Tax reassessment forecast CA · Resets to sale price
- Current annual tax
- $1,537 · $128/mo
- Projected year-2 tax
- $2,736 · $228/mo
- Expected delta
- +$1,199/yr (+$100/mo · 78.0%)
ⓘ Screening estimate from a state-policy table — verify with the county assessor before closing.
Climate risk First Street
- Flood 5/10 Major FEMA zone X · 27% chance over 30 yrs
- Wildfire 1/10 Low
- Heat 7/10 Severe 7 d/yr ≥103°F today · 15 d/yr by 30 yrs out
- Wind 1/10 Low
- Air quality 10/10 Extreme 25 unhealthy d/yr today · 26 by 30 yrs out
Nearby sold comps map
Loading sold comps map…
Walkable amenities ~0.75 mi
Loading nearby amenities…
Taxation est. · year 1
- Rental income
- $31,165
- − Mortgage interest
- −$20,166
- − Property taxes
- −$1,537
- − Insurance
- −$1,800
- − Repairs & maintenance
- −$2,493
- − Management
- −$2,493
- − Depreciation
- −$10,473
- Taxable loss
- −$7,797
- Est. tax savings @ 24.0%
- +$1,871
- After-tax cash flow
- $500/yr
For passive investors: Depreciation is non-cash, so a rental often shows a tax loss while cash-flowing — sheltering income. Rental losses are passive: they offset passive income freely, and up to $25,000/yr can offset ordinary (W-2) income if you actively participate and your MAGI is under $100k (phasing out to $0 by $150k); unused losses carry forward. On sale, claimed depreciation is recaptured at up to 25%, and gains may owe capital-gains tax (a 1031 exchange can defer both). Figures are a year-1 estimate at your 24.0% rate — not tax advice; consult a CPA.
Schools (NCES district)
- District
- Stockton Unified
- NCES district ID
- 0638010
- Math proficiency
- 23% ▲ 2.00%
- Reading proficiency
- 46% ▲ 16.00%
- Median HH income
- $37,563
- Composite
- 28.65/100
- National rank
- #6701
- State rank
- #295 of 517 in CA
Livability — Stockton
- Score
- 57/100
- State rank
- #734
- US rank
- #21638
Category grades
Schools grade is shown separately in the Schools card above.
Census & demographics
- Census place
- Stockton, CA
- County
- San Joaquin County · 729,570 people
- City population
- 332,006
- Metro
- Stockton, CA
- Population (ZIP)
- 68,558
- Household income
- $83,432
- Rent vs Own
- Severe rent burden
- 1459.0
Population outlook (San Joaquin County) Hauer SSP2
- Today (2025)
- 796,965 people
- By 2030
- 828,849 · +4.0%
- By 2040
- 885,611 · +11.1%
- By 2050
- 929,798 · +16.7%
- By 2075
- 994,578 · +24.8%
- By 2100
- 971,291 · +21.9%
Race, ethnicity, and origin ACS 2023
- Neighborhood character
- Diverse neighborhood (Simpson 0.59)
- Race & ethnicity
- Hispanic / Latino 60% Two or more races 20% Asian 18% Black 11% White 7% Native American 1%
- Hispanic origin (detail)
- Mexican 55%
- Common ancestry
- Swiss 1% Russian 1% Lithuanian 1%
- Foreign-born
- 35% · Canada, China, Vietnam
- Languages at home
- 39% English-only · Spanish 46% Tagalog/Filipino 6% Other Asian/Pacific 4%
Political lean MEDSL · San Joaquin
- 2024 margin
- Toss-up / Even · D 48.0% · R 48.9% · Other 3.0%
- 2008→2024 swing
- -11.6pp toward R · 2008: 10.7pp · 2024: -0.9pp
- All cycles
- 2024: R+0.9 2020: D+13.9 2016: D+12.9 2012: D+8.9 2008: D+10.7
Not yet ingested
- Civics
- —
Market trends
- HPI YoY
- ▼ -228.27%
- Current HPI
- 357.6069
- Rent YoY
- ▼ -0.55%
- Metro
- Stockton, CA
- State GDP YoY
- ▲ 3.21%
- F500 in state
- 116
Industry mix (Fortune 500 HQ in CA)
| Industry | F500 HQs | Revenue |
|---|---|---|
| Technology | 27 | $1,492B |
|
||
| Financial Services | 3 | $174B |
|
||
| Retail | 3 | $44B |
|
||
| Insurance | 3 | $26B |
|
||
| Media / Entertainment | 2 | $115B |
|
||
| Pharmaceuticals / Biotech | 2 | $62B |
|
||
Price history
-69.5% since first listed2 events — show timeline
- 2009-03-31 Sold (Public Records) $87,000 Public Records
- 2005-01-07 Sold (Public Records) $285,000 Public Records
Property tax history
-3.4%/yrLatest (2025): $1,537 · +1.7% YoY. Source: county tax records.
Cash-flow waterfall
monthlySold comps — $/sqft
last 12 mo · ≤1 miLoading sold comps…