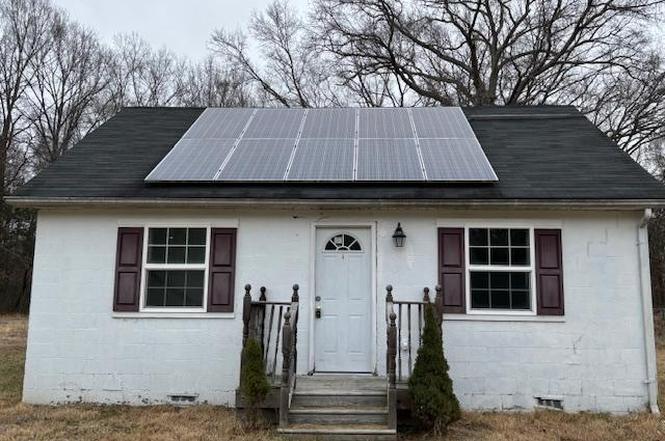
26445 Rapidan · Orange, VA
Flood risk 1/10 · Minimal
- FEMA flood zone
- X (unshaded)
- Chance of flooding over 30 yrs
- 0.0%
- Est. flood insurance / yr
- $507 – $1,088
Fire risk 4/10 · Minor
- Est. fire insurance / yr
- $666 – $1,236
Heat risk 7/10 · Major
- Hot days now (above 105°F)
- 7 days/yr
- Hot days in 30 yrs
- 17 days/yr
Wind risk 3/10 · Minor
- Chance of severe wind over 30 yrs
- 5.0%
Air-quality risk 2/10 · Minimal
- Unhealthy air days now
- 0 days/yr
- Unhealthy air days in 30 yrs
- 1 days/yr
Risk factors via First Street. Map © Google.
Why this score? — see what drove the D grade
The composite is a weighted blend of 9 inputs, each scored 0–100. Each bar is that input's sub-score; the figure is the points it added to the 100-point composite (weight × sub-score).
- Appreciation +10.0/10.0
- ARV discount +7.5/15.0
- Cash flow +7.1/30.0
- Schools +4.9/10.0
- Livability +3.7/5.0
- Rent growth +2.5/5.0
- Condition / age +2.5/5.0
- DSCR +1.3/10.0
- 1% rule +1.0/10.0
$209,000
🖨 Deal sheet (PDF) 📄 Offer letter ✓ Due diligence
Listing remarks
Take this Fredericksburg EXIT to. .. Over 1500 sq ft. , 2 bedroom, 1 bathroom cape cod on 1 acre. Country living feel yet only 15 minutes to Culpeper. Good opportunity for an investor or home buyer. Open Floor plan, eat-in kitchen, hard floors, carpeting, and solar panels. Viewable on HUDHomestore. gov as well. Real Estate agent needs to be HUD registered to place an offer. Property is owned by the Department of Housing and Urban Development (HUD), case # 544-349919 IE (insurable with escrow), Subject to Appraisal. Seller makes no representations or warranties as to property condition. De-winterization and re-winterization for inspections at buyer's expense. HUD homes are sold entirely &quo
Key facts
- 1 acre lot
- Built 1954
- Listed 56 days
Neighborhood map
What this means for you Summary
Snapshot
- This is a 2-bed/1.0-bath single-family listed at $209k.
Deal economics
- At list price, monthly cash flow is $-294 ($-4k/yr) — negative.
- To cash-flow at today's rent, offer at most $157k (24.8% below list).
- To meet the 1% rule (rent ≥ 1% of price), the offer needs to be $125k (40.1% below list).
- Recommended offer: $125k (40.1% below list) — sets the bar for 1% rule.
Location & tenants
- Location reads 74/100 on livability (#151 in VA, #4,842 nationally) — a middle-class / working-renter tenant base. Strengths: health & safety A+, housing A, cost of living A-; Watch: crime C-, employment D+, amenities D.
- Culpeper County Public School District (town): math 49% / reading 63% proficiency, ranked #69 of 131 in VA (top 53%) — acceptable for families but not a draw, mixed tenant base, ~2y average lease.
- Zoned schools: Pearl Sample Elementary (math 36% / reading 52%, grade F, #851 of 1,108 statewide, top 77%, 632 students, 71% FRL); Floyd T. Binns Middle (math 41% / reading 63%, grade C+, #218 of 342 statewide, top 65%, 779 students, 53% FRL); Eastern View High (math 58% / reading 80%, grade B, #170 of 319 statewide, top 55%, 1,558 students, 45% FRL) — zoned schools average 56% FRL vs 37% district-wide (19 pts higher); higher-poverty schools than district average — tighter screening recommended.
- Market conditions: 24 active listings in the ZIP; 425 units permitted in Culpeper County in 2024 (60 in 5+ unit buildings).
Forward outlook
- In year one you build about $22k of equity ($1k loan paydown + $21k appreciation (10.0% local appreciation)).
- Culpeper County population projected at +16% by 2050 — long-run rental-demand tailwind backs the buy-and-hold thesis.
- By year 2, paydown + projected appreciation supports a ~$36k cash-out refi (75% LTV) — recoverable capital for the next deal without selling this one.
Negotiation context
- It's been on market 56 days — a 3% lower offer ($203k) is reasonable based on typical stale-listing flexibility.
- 19 sale attempts since 11y ago with the ask held roughly flat each time — persistent listings suggest the price (not the market) is what's stuck; bring a comps-based counter.
Risks & watch-outs
- Watch-outs: built in 1954 — expect roof / HVAC / electrical / plumbing capex.
- Climate carrying-cost: extreme-heat days projected 7→17/yr by 2055 (HVAC capex compounding) — expect insurance premiums to compound above CPI over the hold.
Questions for the listing agent
- What do current leases actually rent for vs. the listed asking? Can we see a recent rent roll and the last 12 months of T-12 income?
- It's been on market 56 days. Have you received any prior offers? Is the seller open to a 40% concession, seller financing, or rate buy-down credit?
- Built in 1954 — when were the roof, HVAC, electrical panel, plumbing, and water heater last replaced?
- Is there a deadline driving the sale (1031 exchange, divorce, estate, relocation)? That informs how much negotiation room exists.
- Schools are B-rated — typically a magnet for longer-tenancy family renters. What's the average tenant stay here, and is there a school-zone premium baked into asking?
- The area grade is low — what's the realistic commute time and amenity access for the typical tenant pool here? Any planned neighborhood developments (good or bad) we should know about?
- What's the average days-on-market for RENTAL listings here right now (not sales)? A rising rental-DOM trend means longer vacancies and softer asking-rent achievability than the comps imply.
- What's the recent tenant-quality profile in this submarket — average credit score on applications, eviction rate, late-payment / NSF rate, and stable-employment percentage? A property-management company in the area should have these aggregated.
- How much new for-sale + rental construction is in the pipeline within 1–3 miles? Heavy new supply typically softens prices + rents 12–24 months out; constrained supply supports both.
Investment metrics
- 1% rule
- 0.60% ✗
- Cap rate
- 4.61%
- Cash-on-cash
- -6.02%
- DSCR
- 0.73
- GRM
- 13.9
CMA / ARV
- ARV (on-the-fly)
- $127,322
- Comps found
- 1
Show comp detail 1 sale within ~0.75 mi
| Address | Dist | Beds/Ba | Sqft | Sold | Price | $/sf | Match |
|---|---|---|---|---|---|---|---|
| 26445 Rapidan | 0.00mi | 2/1.0 | 1,534 (0%) | 0mo | $128,000 | $83 | 100 |
Match score weights: distance 35% · size 25% · config 20% · recency 20%. Top-matched comps best support the ARV.
Projected returns pro-forma
10.0% appreciation · 3.0% rent growth · sell at horizon
- IRR
- 20.0%
- Equity multiple
- 2.62×
- Total profit
- $95,042
- Equity at exit
- $188,284
- IRR
- 18.3%
- Equity multiple
- 6.03×
- Total profit
- $294,432
- Equity at exit
- $406,041
Cash invested: $58,520 (down + closing). Projections, not guarantees.
Landlord ↔ Tenant lean methodology
- Overall (STATE)
- 55 Moderately Landlord-Leaning
- State Virginia
- 55 Moderately Landlord-Leaning · D+2
- County
- — inherits STATE
- City
- — inherits STATE
ZIP-level market 22733
- Home prices YoY
- 26.3%
- Active inventory
- 24
- Price-to-rent
- 13.9×
Monthly cashflow live
- Estimated rent
- $1,252 medium interval (Pro) →
- Mortgage (P&I)
- −$1,096
- Tax from tax record
- −$100 /mo · $1,196/yr
- Insurance
- −$87
- HOA
- −$0
- Vacancy / Maint / Mgmt
- −$263
- Net cashflow
- $-294
Break-even live
Sensitivity live
| Price | -10% $-175 | -5% $-235 | +0% $-294 | +5% $-353 | +10% $-412 |
|---|---|---|---|---|---|
| Rent | -10% $-393 | -5% $-343 | +0% $-294 | +5% $-244 | +10% $-195 |
| Rate | -1.0pp $-188 | -0.5pp $-241 | base $-294 | +0.5pp $-348 | +1.0pp $-403 |
UW: 25.0% down · 7.5% · 30yr · 1.5% tax · 5.0% vac · 8.0% maint · 8.0% mgmt
Financing live
Cash to close
- Down payment
- $52,250
- Closing costs
- $6,270
- Reserves months
- —
- Total cash needed
- —
Loan-product check · same deal, 3 products live
Conventional
25% down · 7.5% · 30yr
- Down + closing
- —
- Monthly P&I
- —
- Monthly cashflow
- —
- DSCR
- —
- Eligible?
- —
Personal DTI + credit; lowest rate.
DSCR
20% down · 8.5% · 30yr
- Down + closing
- —
- Monthly P&I
- —
- Monthly cashflow
- —
- DSCR
- —
- Eligible?
- —
No personal income docs; deal must DSCR.
Hard money
10% down · 12.0% · 12mo
- Down + closing
- —
- Monthly P&I
- —
- Monthly cashflow
- —
- DSCR
- —
- Eligible?
- —
Short-term bridge; refi at stabilization.
Listing history 50 events
-
2026-04-30status Pending
-
2026-04-23historical
-
2026-04-07status Active
-
2026-03-31historical
-
2026-02-19$209,000 Active
-
2025-05-21status Active
-
2025-05-21historical
-
2025-03-18status Pending
-
2025-03-04historical
-
2025-03-04historical
-
2025-01-31$162,600 Active
-
2025-01-23historical
-
2025-01-15status Active
-
2025-01-07status Pending
-
2024-12-26price $162,600
-
2024-12-06status Active
-
2024-12-06historical Active Under Contract
-
2024-11-14price $189,700
-
2024-10-09price $216,800
-
2024-10-09status Active
-
2024-10-03historical
-
2024-08-19price $243,000
-
2024-07-03$271,000 Active
-
2022-05-06soldstatus $258,500
-
2022-05-05soldstatus $258,500 Closed
-
2022-04-05historical Active Under Contract
-
2022-03-24price $254,500
-
2022-03-02status Active
-
2022-03-02$269,500 Active
-
2022-03-02historical
-
2018-08-15soldstatus $178,500 Closed
-
2018-08-15soldstatus $178,500 Sold
-
2018-08-13soldstatus $178,500
-
2018-08-10status Pending
-
2018-07-15historical Active Under Contract
-
2018-07-15status Contingent (No Kick Out)
-
2018-06-15historical
-
2018-06-15$189,900 Active
-
2018-06-15$189,900 Active
-
2018-06-15historical Withdrawn
-
2018-05-09$195,000 Active
-
2018-05-09Active
-
2017-02-10soldstatus $75,000
-
2017-02-08soldstatus $75,000 Sold
-
2017-02-08soldstatus $75,000
-
2017-01-19status Contingent (No Kick Out)
-
2017-01-19historical
-
2016-12-20price $89,000
-
2016-08-13price $94,500
-
2016-06-21$109,900 Active
ⓘ Source: listings_history table (triggers on properties + properties_extension) + one-shot
backfill from property_details.listing_events for pre-trigger history.
Tax reassessment forecast VA · Resets to sale price
- Current annual tax
- $1,196 · $100/mo
- Projected year-2 tax
- $1,714 · $143/mo
- Expected delta
- +$518/yr (+$43/mo · 43.3%)
ⓘ Screening estimate from a state-policy table — verify with the county assessor before closing.
Climate risk First Street
- Flood 1/10 Low FEMA zone X (unshaded) · 0% chance over 30 yrs
- Wildfire 4/10 Moderate
- Heat 7/10 Severe 7 d/yr ≥105°F today · 17 d/yr by 30 yrs out
- Wind 3/10 Moderate 5% chance of damaging wind over 30 yrs
- Air quality 2/10 Low 0 unhealthy d/yr today · 1 by 30 yrs out
Nearby sold comps map
Loading sold comps map…
Walkable amenities ~0.75 mi
Loading nearby amenities…
Taxation est. · year 1
- Rental income
- $15,024
- − Mortgage interest
- −$11,707
- − Property taxes
- −$1,196
- − Insurance
- −$1,045
- − Repairs & maintenance
- −$1,202
- − Management
- −$1,202
- − Depreciation
- −$6,080
- Taxable loss
- −$7,408
- Est. tax savings @ 24.0%
- +$1,778
- After-tax cash flow
- $-1,746/yr
For passive investors: Depreciation is non-cash, so a rental often shows a tax loss while cash-flowing — sheltering income. Rental losses are passive: they offset passive income freely, and up to $25,000/yr can offset ordinary (W-2) income if you actively participate and your MAGI is under $100k (phasing out to $0 by $150k); unused losses carry forward. On sale, claimed depreciation is recaptured at up to 25%, and gains may owe capital-gains tax (a 1031 exchange can defer both). Figures are a year-1 estimate at your 24.0% rate — not tax advice; consult a CPA.
Schools (NCES district)
- District
- Culpeper County Public School District
- NCES district ID
- 5101050
- Math proficiency
- 49% ▼ -33.00%
- Reading proficiency
- 63% ▼ -10.00%
- Median HH income
- $66,051
- Composite
- 49.24/100
- National rank
- #2033
- State rank
- #69 of 131 in VA
Livability — Orange
- Score
- 74/100
- State rank
- #151
- US rank
- #4842
Category grades
Schools grade is shown separately in the Schools card above.
Census & demographics
- Population (ZIP)
- 1,828
Population outlook (Culpeper County) Hauer SSP2
- Today (2025)
- 54,299 people
- By 2030
- 56,492 · +4.0%
- By 2040
- 60,267 · +11.0%
- By 2050
- 62,773 · +15.6%
- By 2075
- 67,747 · +24.8%
- By 2100
- 65,971 · +21.5%
Race, ethnicity, and origin ACS 2023
- Neighborhood character
- Predominantly White (71%)
- Race & ethnicity
- White 71% Black 15% Two or more races 9% Hispanic / Latino 6% Asian 1%
- Hispanic origin (detail)
- Common ancestry
- Scottish 3% Serbian 1% Portuguese 1%
- Foreign-born
- 3% · Canada, Jamaica
- Languages at home
- 93% English-only · Spanish 6% Other Indo-European 1%
Political lean MEDSL · Culpeper
- 2024 margin
- Strong R (+25.0) · D 37.0% · R 61.9% · Other 1.1%
- 2008→2024 swing
- -15.3pp toward R · 2008: -9.7pp · 2024: -25.0pp
- All cycles
- 2024: R+25.0 2020: R+19.9 2016: R+25.3 2012: R+16.3 2008: R+9.7
Not yet ingested
- Civics
- —
Market trends
- HPI YoY
- ▲ 69.54%
- Current HPI
- 334.357
- Rent YoY
- —
- Metro
- —
- State GDP YoY
- ▲ 2.40%
- F500 in state
- 50
Industry mix (Fortune 500 HQ in VA)
| Industry | F500 HQs | Revenue |
|---|---|---|
| Aerospace / Defense | 4 | $236B |
|
||
| Technology / Defense | 3 | $32B |
|
||
| Financial Services | 2 | $176B |
|
||
| Utilities | 2 | $27B |
|
||
| Insurance | 2 | $25B |
|
||
| Technology | 2 | $15B |
|
||
Price history
+60.9% since first listed57 events — show timeline
- 2026-04-30 Pending — BRIGHT MLS
- 2026-04-23 Listing Removed — BRIGHT MLS
- 2026-04-07 Relisted — BRIGHT MLS
- 2026-03-31 Listing Removed — BRIGHT MLS
- 2026-02-19 Listed $209,000 BRIGHT MLS
- 2025-05-21 Relisted — BRIGHT MLS
- 2025-05-21 Listing Removed — BRIGHT MLS
- 2025-03-18 Pending — BRIGHT MLS
- 2025-03-04 Listing Removed — BRIGHT MLS
- 2025-03-04 Listing Removed — BRIGHT MLS
- 2025-01-31 Listed $162,600 BRIGHT MLS
- 2025-01-23 Listing Removed — BRIGHT MLS
- 2025-01-15 Relisted — BRIGHT MLS
- 2025-01-07 Pending — BRIGHT MLS
- 2024-12-26 Price Changed $162,600 BRIGHT MLS
- 2024-12-06 Relisted — BRIGHT MLS
- 2024-12-06 Contingent — BRIGHT MLS
- 2024-11-14 Price Changed $189,700 BRIGHT MLS
- 2024-10-09 Price Changed $216,800 BRIGHT MLS
- 2024-10-09 Relisted — BRIGHT MLS
- 2024-10-03 Listing Removed — BRIGHT MLS
- 2024-08-19 Price Changed $243,000 BRIGHT MLS
- 2024-07-03 Listed $271,000 BRIGHT MLS
- 2022-05-06 Sold (Public Records) $258,500 Public Records
- 2022-05-05 Sold (MLS) $258,500 BRIGHT MLS
- 2022-04-05 Contingent — BRIGHT MLS
- 2022-03-24 Price Changed $254,500 BRIGHT MLS
- 2022-03-02 Relisted — BRIGHT MLS
- 2022-03-02 Listing Removed — BRIGHT MLS
- 2022-03-02 Listed $269,500 BRIGHT MLS
- 2018-08-15 Sold (MLS) $178,500 MRIS
- 2018-08-15 Sold (MLS) $178,500 BRIGHT MLS
- 2018-08-13 Sold (Public Records) $178,500 Public Records
- 2018-08-10 Pending — BRIGHT MLS
- 2018-07-15 Contingent — BRIGHT MLS
- 2018-07-15 Pending — MRIS
- 2018-06-15 Listing Removed — BRIGHT MLS
- 2018-06-15 Delisted — MRIS
- 2018-06-15 Listed $189,900 MRIS
- 2018-06-15 Listed $189,900 BRIGHT MLS
- 2018-05-09 Listed — MRIS
- 2018-05-09 Listed $195,000 BRIGHT MLS
- 2017-02-10 Sold (Public Records) $75,000 Public Records
- 2017-02-08 Sold (MLS) $75,000 BRIGHT MLS
- 2017-02-08 Sold (MLS) $75,000 MRIS
- 2017-01-19 Pending — MRIS
- 2017-01-19 Listing Removed — BRIGHT MLS
- 2016-12-20 Price Changed $89,000 MRIS
- 2016-08-13 Price Changed $94,500 MRIS
- 2016-06-21 Listed $109,900 MRIS
- 2016-06-21 Listed $89,000 BRIGHT MLS
- 2016-06-11 Listing Removed — CAAR
- 2015-12-11 Listing Removed — BRIGHT MLS
- 2015-12-11 Delisted — MRIS
- 2015-11-09 Listed — MRIS
- 2015-11-09 Listed $149,900 BRIGHT MLS
- 2015-10-10 Listed $129,900 CAAR
Property tax history
+2.9%/yrLatest (2025): $1,196 · -0.5% YoY. Source: county tax records.
Cash-flow waterfall
monthlySold comps — $/sqft
last 12 mo · ≤1 miLoading sold comps…