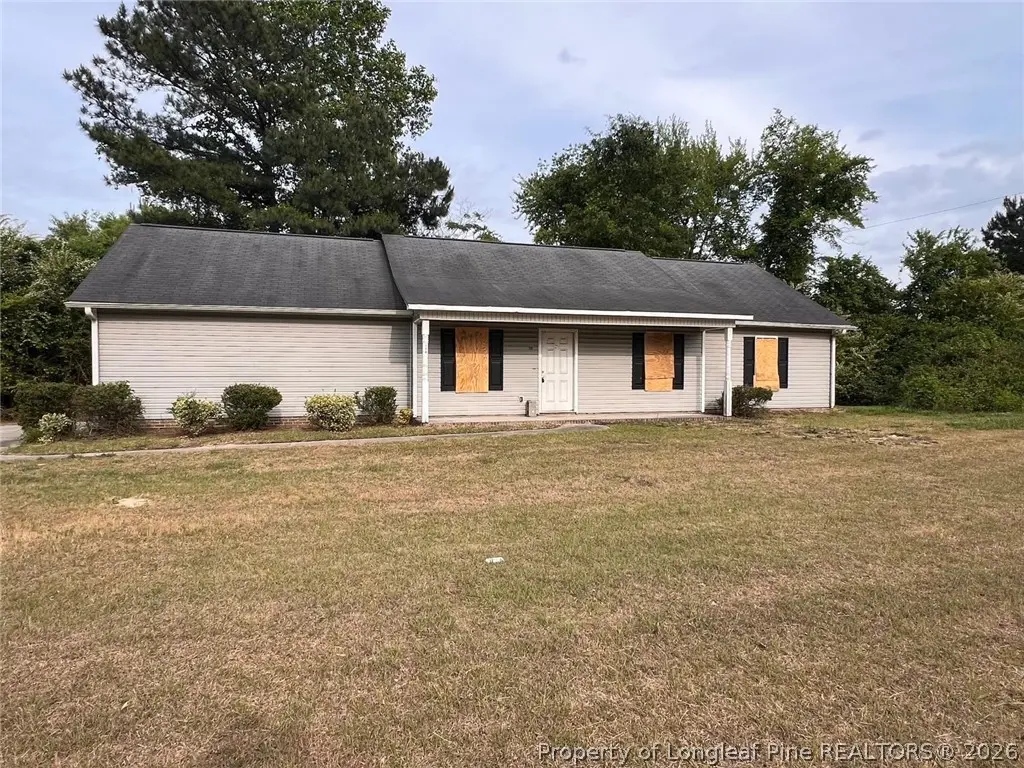
128 Copper Creek Dr · Rockfish, NC
Flood risk 1/10 · Minimal
- FEMA flood zone
- X (unshaded)
- Chance of flooding over 30 yrs
- 0.0%
- Est. flood insurance / yr
- $507 – $1,088
Fire risk 7/10 · Major
- Est. fire insurance / yr
- $906 – $1,684
Heat risk 7/10 · Major
- Hot days now (above 106°F)
- 7 days/yr
- Hot days in 30 yrs
- 16 days/yr
Wind risk 7/10 · Major
- Chance of severe wind over 30 yrs
- 78.0%
Air-quality risk 1/10 · Minimal
- Unhealthy air days now
- 0 days/yr
- Unhealthy air days in 30 yrs
- 0 days/yr
Risk factors via First Street. Map © Google.
Why this score? — see what drove the B+ grade
The composite is a weighted blend of 9 inputs, each scored 0–100. Each bar is that input's sub-score; the figure is the points it added to the 100-point composite (weight × sub-score).
- Cash flow +30.0/30.0
- ARV discount +15.0/15.0
- 1% rule +10.0/10.0
- DSCR +10.0/10.0
- Livability +3.6/5.0
- Schools +3.2/10.0
- Rent growth +3.0/5.0
- Condition / age +2.5/5.0
- Appreciation +0.0/10.0
$119,900
🖨 Deal sheet (PDF) 📄 Offer letter ✓ Due diligence
Listing remarks
Investor special with strong upside potential! This 3-bedroom, 2-bath home offers a solid layout and is ready for a full renovation. Property requires significant repairs including flooring, interior paint, windows, appliances, HVAC replacement, and overall cosmetic updates. Ideal opportunity for investors, flippers, or buyers looking to customize a home to their liking. Home features a spacious layout with a fireplace, open living area, and kitchen with existing cabinetry. Exterior includes vinyl siding and a covered front entry. Property is being sold as-is and will not qualify for traditional financing. Located at the entrance of Copper Creek directly off Rockfish Road. Per NCDOT plans,
Key facts
- 2 garage spots
- Built 2009
- Listed 8 days
Property features AI
Exterior
- Parking: Attached 2-car garage (2 covered spaces)
- Security: Security system; Smoke detectors
- Utilities: Public water; Septic tank / holding tank
- Home design: Single-family residence; Residential property
- Construction: Vinyl siding
- Exterior features: Subdivision: Copper Creek
Interior
- Kitchen: Dishwasher; Garbage disposal; Microwave; Range; Refrigerator
- Bedrooms: Total rooms: 5
- Flooring: Carpet; Vinyl
- Bathrooms: 2 full bathrooms
- Heating & cooling: Heat pump heating; Ceiling fan cooling
- Interior features: Ceiling fans; Cathedral ceilings; Vaulted ceilings; Eat-in kitchen; Walk-in closets; Window coverings and blinds; Factory-built gas-log fireplace (1)
Neighborhood map
What this means for you Summary
Snapshot
- This is a 3-bed/2.0-bath single-family listed at $120k.
Deal economics
- At list price, monthly cash flow is $778 ($9k/yr) — positive.
- The deal already cash-flows at list — no discount required.
- Meets the 1% rule at list price ($2k rent vs $120k).
- Cap rate 14.1% vs local median 4.7% in Rockfish — top-decile yield for the area; either an underpriced asset or a hidden risk that comps aren't pricing in. Stress-test before assuming the spread holds.
Location & tenants
- Location reads 71/100 on livability (#108 in NC) — a middle-class / working-renter tenant base. Strengths: cost of living A+, housing A+, crime A; Watch: amenities F, commute F.
- Hoke County Schools (suburban): math 35% / reading 40% proficiency, ranked #123 of 178 in NC (top 69%) — families likely to look elsewhere, expect single-tenant / working-renter base with shorter leases.
- Zoned schools: Sandy Grove Elementary (math 26% / reading 31%, grade F, #1,018 of 1,410 statewide, top 72%, 578 students, 100% FRL); East Hoke Middle (math 32% / reading 40%, grade F, #273 of 475 statewide, top 58%, 780 students, 100% FRL); Hoke County High (math 42% / reading 44%, grade F, #372 of 535 statewide, top 69%, 2,060 students, 100% FRL) — zoned schools average 100% FRL vs 57% district-wide (43 pts higher); higher-poverty schools than district average — tighter screening recommended.
- Market conditions: Rents rising (+1.9%/yr); 575 active listings in the ZIP; 2 comparable units currently listed for rent nearby; 685 units permitted in Hoke County in 2024 (0 in 5+ unit buildings).
- This rent runs 36% of the median local income ($66k/yr) — at the standard rent-burdened threshold; future hikes will face affordability resistance.
Forward outlook
- Local home prices are declining (-3.0%/yr); year-one equity from $829 of loan paydown is wiped out by about $4k of value loss. Plan a longer hold.
- Hoke County population projected at +36% by 2050 — long-run rental-demand tailwind backs the buy-and-hold thesis.
- At projected returns (-3.0% appreciation + 1.9% rent growth), your $34k cash investment doubles in ~5 years — after that, you're playing with house money.
Negotiation context
- Only 8 days on market — expect competitive offers; lowballing is unlikely to land.
- Current owner paid $50k; list at $120k implies a 140% gain — meaningful room to come down on a strong offer.
Risks & watch-outs
- Climate carrying-cost: major wind risk, 78% chance of damaging wind over 30y; major wildfire risk; extreme-heat days projected 7→16/yr by 2055 (HVAC capex compounding) — expect insurance premiums to compound above CPI over the hold.
Questions for the listing agent
- Is there a deadline driving the sale (1031 exchange, divorce, estate, relocation)? That informs how much negotiation room exists.
- Schools are A-rated — typically a magnet for longer-tenancy family renters. What's the average tenant stay here, and is there a school-zone premium baked into asking?
- What's the average days-on-market for RENTAL listings here right now (not sales)? A rising rental-DOM trend means longer vacancies and softer asking-rent achievability than the comps imply.
- What's the recent tenant-quality profile in this submarket — average credit score on applications, eviction rate, late-payment / NSF rate, and stable-employment percentage? A property-management company in the area should have these aggregated.
- How much new for-sale + rental construction is in the pipeline within 1–3 miles? Heavy new supply typically softens prices + rents 12–24 months out; constrained supply supports both.
Investment metrics
- 1% rule
- 1.65% ✓
- Cap rate
- 14.08%
- Cash-on-cash
- 27.80%
- DSCR
- 2.24
- GRM
- 5.1
CMA / ARV
- ARV (on-the-fly)
- $215,852
- Comps found
- 12
Show comp detail 12 sales within ~0.75 mi
| Address | Dist | Beds/Ba | Sqft | Sold | Price | $/sf | Match |
|---|---|---|---|---|---|---|---|
| 9701 Rockfish Rd | 0.21mi | 3/2.0 | 1,318 (+11%) | 4mo | $175,000 | $133 | 68 |
| 302 Kernstown Rd | 0.40mi | 3/2.0 | 1,170 (-1%) | 13mo | $240,000 | $205 | 68 |
| 151 Maria Dr | 0.43mi | 3/2.0 | 1,260 (+6%) | 3mo | $244,000 | $194 | 67 |
| 9937 Rockfish Rd | 0.45mi | 3/2.0 | 1,206 (+2%) | 21mo | $207,000 | $172 | 59 |
| 221 Overton Rd | 0.31mi | 3/2.0 | 1,306 (+10%) | 12mo | $238,000 | $182 | 58 |
| 159 Quarry Ln | 0.10mi | 3/2.0 | 1,359 (+15%) | 17mo | $248,000 | $182 | 56 |
| 311 Kernstown Rd | 0.43mi | 3/3.0 | 1,301 (+10%) | 8mo | $250,000 | $192 | 53 |
| 501 Camden Rd | 0.72mi | 3/2.0 | 1,188 (+0%) | 16mo | $216,000 | $182 | 53 |
| 107 Stonewall St | 0.43mi | 3/2.0 | 1,294 (+9%) | 14mo | $228,000 | $176 | 52 |
| 317 Kernstown Rd | 0.49mi | 3/2.0 | 1,318 (+11%) | 14mo | $240,000 | $182 | 47 |
| 217 Overton Rd | 0.30mi | 3/2.0 | 1,345 (+13%) | 20mo | $233,000 | $173 | 47 |
| 10109 Rockfish Rd | 0.62mi | 3/2.0 | 1,040 (-12%) | 16mo | $216,500 | $208 | 37 |
Match score weights: distance 35% · size 25% · config 20% · recency 20%. Top-matched comps best support the ARV.
Projected returns pro-forma
-3.0% appreciation · 1.92% rent growth · sell at horizon
- IRR
- 20.7%
- Equity multiple
- 1.83×
- Total profit
- $27,986
- Equity at exit
- $17,877
- IRR
- 28.2%
- Equity multiple
- 3.37×
- Total profit
- $79,636
- Equity at exit
- $10,367
Cash invested: $33,572 (down + closing). Projections, not guarantees.
Landlord ↔ Tenant lean methodology
- Overall (STATE)
- 85 Strongly Landlord-Friendly
- State North Carolina
- 85 Strongly Landlord-Friendly · R+3
- County
- — inherits STATE
- City
- — inherits STATE
ZIP-level market 28376
- Home prices YoY
- -24.0%
- Rents YoY
- 1.9%
- Active inventory
- 575
- Price-to-rent
- 5.1×
Monthly cashflow live
- Estimated rent
- $1,976 medium interval (Pro) →
- Mortgage (P&I)
- −$629
- Tax from tax record
- −$105 /mo · $1,257/yr
- Insurance
- −$50
- HOA
- −$0
- Vacancy / Maint / Mgmt
- −$415
- Net cashflow
- $778
Break-even live
Sensitivity live
| Price | -10% $846 | -5% $812 | +0% $778 | +5% $744 | +10% $710 |
|---|---|---|---|---|---|
| Rent | -10% $622 | -5% $700 | +0% $778 | +5% $856 | +10% $934 |
| Rate | -1.0pp $838 | -0.5pp $808 | base $778 | +0.5pp $747 | +1.0pp $715 |
UW: 25.0% down · 7.5% · 30yr · 1.5% tax · 5.0% vac · 8.0% maint · 8.0% mgmt
Financing live
Cash to close
- Down payment
- $29,975
- Closing costs
- $3,597
- Reserves months
- —
- Total cash needed
- —
Loan-product check · same deal, 3 products live
Conventional
25% down · 7.5% · 30yr
- Down + closing
- —
- Monthly P&I
- —
- Monthly cashflow
- —
- DSCR
- —
- Eligible?
- —
Personal DTI + credit; lowest rate.
DSCR
20% down · 8.5% · 30yr
- Down + closing
- —
- Monthly P&I
- —
- Monthly cashflow
- —
- DSCR
- —
- Eligible?
- —
No personal income docs; deal must DSCR.
Hard money
10% down · 12.0% · 12mo
- Down + closing
- —
- Monthly P&I
- —
- Monthly cashflow
- —
- DSCR
- —
- Eligible?
- —
Short-term bridge; refi at stabilization.
Rent comps 2 comps
| Address | Beds | Baths | Sqft | Rent | $/sqft | DOM | Units | Dist |
|---|---|---|---|---|---|---|---|---|
| 109 Belle Boyd Dr Raeford, NC | 3.0 | 2.0 | 1215 | $1,800 | $1.48 | 25d | 1 | 0.46mi |
| 287 Finch Rd Fayetteville, NC | 3.0 | 2.0 | 1250 | $1,695 | $1.36 | 25d | 1 | 1.40mi |
Listing history 3 events
-
2026-05-14status Pending
-
2026-05-05$119,900 Active
-
2009-03-24soldstatus $50,000
ⓘ Source: listings_history table (triggers on properties + properties_extension) + one-shot
backfill from property_details.listing_events for pre-trigger history.
Tax reassessment forecast NC · Resets to sale price
- Current annual tax
- $1,257 · $105/mo
- Projected year-2 tax
- $1,257 · $105/mo
- Expected delta
- $0/yr ($0/mo · 0.0%)
ⓘ Screening estimate from a state-policy table — verify with the county assessor before closing.
Climate risk First Street
- Flood 1/10 Low FEMA zone X (unshaded) · 0% chance over 30 yrs
- Wildfire 7/10 Severe
- Heat 7/10 Severe 7 d/yr ≥106°F today · 16 d/yr by 30 yrs out
- Wind 7/10 Severe 78% chance of damaging wind over 30 yrs
- Air quality 1/10 Low 0 unhealthy d/yr today · 0 by 30 yrs out
Nearby sold comps map
Loading sold comps map…
Walkable amenities ~0.75 mi
Loading nearby amenities…
Taxation est. · year 1
- Rental income
- $23,715
- − Mortgage interest
- −$6,716
- − Property taxes
- −$1,257
- − Insurance
- −$600
- − Repairs & maintenance
- −$1,897
- − Management
- −$1,897
- − Depreciation
- −$3,488
- Taxable income
- $7,860
- Est. tax owed @ 24.0%
- −$1,886
- After-tax cash flow
- $7,447/yr
For passive investors: Depreciation is non-cash, so a rental often shows a tax loss while cash-flowing — sheltering income. Rental losses are passive: they offset passive income freely, and up to $25,000/yr can offset ordinary (W-2) income if you actively participate and your MAGI is under $100k (phasing out to $0 by $150k); unused losses carry forward. On sale, claimed depreciation is recaptured at up to 25%, and gains may owe capital-gains tax (a 1031 exchange can defer both). Figures are a year-1 estimate at your 24.0% rate — not tax advice; consult a CPA.
Schools (NCES district)
- District
- Hoke County Schools
- NCES district ID
- 3702250
- Math proficiency
- 35% ▼ -1.00%
- Reading proficiency
- 40% ▲ 1.00%
- Median HH income
- $43,896
- Composite
- 31.82/100
- National rank
- #5880
- State rank
- #123 of 178 in NC
Livability — Rockfish
- Score
- 71/100
- State rank
- #108
- US rank
- #6802
Category grades
Schools grade is shown separately in the Schools card above.
Census & demographics
- County
- Hoke County · 44,880 people
- Metro
- Fayetteville, NC
- Population (ZIP)
- 44,880
- Household income
- $66,471
- Rent vs Own
- Severe rent burden
- 897.0
Population outlook (Hoke County) Hauer SSP2
- Today (2025)
- 63,354 people
- By 2030
- 68,361 · +7.9%
- By 2040
- 78,074 · +23.2%
- By 2050
- 86,384 · +36.4%
- By 2075
- 99,517 · +57.1%
- By 2100
- 98,939 · +56.2%
Race, ethnicity, and origin ACS 2023
- Neighborhood character
- Highly diverse neighborhood (Simpson 0.71)
- Race & ethnicity
- White 38% Black 35% Hispanic / Latino 15% Two or more races 9% Native American 3% Asian 1%
- Hispanic origin (detail)
- Mexican 7% Puerto Rican 4%
- Common ancestry
- Slovak 2% Romanian 1% Italian 1%
- Foreign-born
- 6% · Canada, Vietnam
- Languages at home
- 89% English-only · Spanish 8% French/Haitian/Cajun 1%
Political lean MEDSL · Hoke
- 2024 margin
- Lean D (+5.9) · D 52.4% · R 46.4% · Other 1.2%
- 2008→2024 swing
- -12.8pp toward R · 2008: 18.8pp · 2024: 5.9pp
- All cycles
- 2024: D+5.9 2020: D+10.9 2016: D+10.8 2012: D+19.0 2008: D+18.8
Not yet ingested
- Civics
- —
Market trends
- HPI YoY
- ▼ -53.30%
- Current HPI
- 169.1801
- Rent YoY
- ▲ 1.92%
- Metro
- Fayetteville, NC
- State GDP YoY
- ▲ 3.28%
- F500 in state
- 26
Industry mix (Fortune 500 HQ in NC)
| Industry | F500 HQs | Revenue |
|---|---|---|
| Financial Services | 2 | $213B |
|
||
| Retail | 2 | $95B |
|
||
| Industrial Conglomerate | 1 | $38B |
|
||
| Metals / Steel | 1 | $35B |
|
||
| Utilities | 1 | $30B |
|
||
| Industrial Machinery | 1 | $19B |
|
||
Price history
+139.8% since first listed3 events — show timeline
- 2026-05-14 Pending — LPRMLS
- 2026-05-05 Listed $119,900 LPRMLS
- 2009-03-24 Sold (Public Records) $50,000 Public Records
Property tax history
+0.9%/yrLatest (2025): $1,257 · +0.0% YoY. Source: county tax records.
Cash-flow waterfall
monthlySold comps — $/sqft
last 12 mo · ≤1 miLoading sold comps…