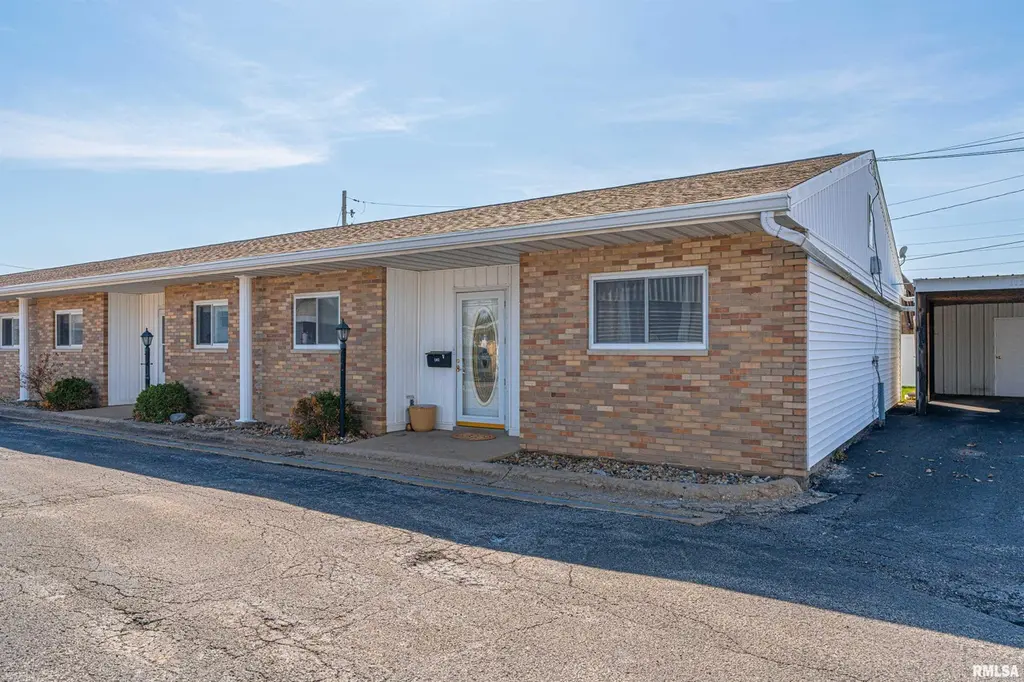
420 Brentwood Rd #105 · Morton, IL
Flood risk 1/10 · Minimal
- FEMA flood zone
- X (unshaded)
- Chance of flooding over 30 yrs
- 0.0%
- Est. flood insurance / yr
- $473 – $860
Fire risk 1/10 · Minimal
- Est. fire insurance / yr
- $804 – $1,492
Heat risk 3/10 · Minor
- Hot days now (above 104°F)
- 7 days/yr
- Hot days in 30 yrs
- 18 days/yr
Wind risk 2/10 · Minimal
- Chance of severe wind over 30 yrs
- 1.0%
Air-quality risk 2/10 · Minimal
- Unhealthy air days now
- 1 days/yr
- Unhealthy air days in 30 yrs
- 2 days/yr
Risk factors via First Street. Map © Google.
Why this score? — see what drove the F grade
The composite is a weighted blend of 9 inputs, each scored 0–100. Each bar is that input's sub-score; the figure is the points it added to the 100-point composite (weight × sub-score).
- Cash flow +11.4/30.0
- 1% rule +5.2/10.0
- Schools +4.8/10.0
- Livability +4.3/5.0
- DSCR +3.3/10.0
- Rent growth +2.5/5.0
- Condition / age +2.5/5.0
- ARV discount +0.0/15.0
- Appreciation +0.0/10.0
$125,000
🖨 Deal sheet (PDF) 📄 Offer letter ✓ Due diligence
Listing remarks MLS
Move-in ready efficient two-bedroom brick and vinyl sided attached condo with a carport and storage shed. Interior has been freshened up and awaits new ownership! The sensible layout includes an open living/dining/kitchen concept, hall laundry facilities, two nice sized bedrooms, and a full hall bath (accessed from main area as well as one bedroom). Quaint back patio plus all appliances including washer and dryer. $145.00/month association dues. Enjoy easy living here!
Key facts
- Attached condo
- Quaint back patio
- Move in ready
Tags
Neighborhood map
What this means for you Summary
Snapshot
- This is a 1-bed/1.0-bath single-family listed at $125k.
Deal economics
- At list price, monthly cash flow is $-44 ($-530/yr) — negative.
- To cash-flow at today's rent, offer at most $117k (6.2% below list).
- Meets the 1% rule at list price ($1k rent vs $125k).
- Recommended offer: $117k (6.2% below list) — sets the bar for cash-flow.
- Cap rate 5.9% vs local median 2.9% in Morton — top-decile yield for the area; either an underpriced asset or a hidden risk that comps aren't pricing in. Stress-test before assuming the spread holds.
Location & tenants
- Location reads 86/100 on livability (#22 in IL, #419 nationally) — a professional / high-income tenant draw. Strengths: crime A+, employment A+, housing A+; Watch: commute F.
- Morton CUSD 709 (suburban): math 48% / reading 59% proficiency, ranked #41 of 620 in IL (top 7%) — acceptable for families but not a draw, mixed tenant base, ~2y average lease; only 12% free/reduced lunch — higher-income household profile.
- Zoned schools: Morton Jr High School (math 46% / reading 68%, grade B, #30 of 665 statewide, top 5%, 485 students, 0% FRL); Morton High School (math 52% / reading 51%, grade D+, #38 of 693 statewide, top 6%, 1,061 students, 0% FRL).
- Market conditions: 63 active listings in the ZIP; 2 comparable units currently listed for rent nearby; 77 units permitted in Tazewell County in 2024 (0 in 5+ unit buildings).
Forward outlook
- Local home prices are declining (-3.0%/yr); year-one equity from $864 of loan paydown is wiped out by about $4k of value loss. Plan a longer hold.
- Tazewell County population projected at -15% by 2050 — secular population decline; favor cash flow + early exit over multi-decade hold.
Negotiation context
- It's been on market 64 days — a 6% lower offer ($118k) is reasonable based on typical stale-listing flexibility.
- 2 sale attempts since 24y ago; this cycle's ask has dropped $10k (7%) from the opening price — seller is motivated, your offer sets the floor, not the list.
- Current owner paid $78k; list at $125k implies a 61% gain — meaningful room to come down on a strong offer.
Questions for the listing agent
- What do current leases actually rent for vs. the listed asking? Can we see a recent rent roll and the last 12 months of T-12 income?
- It's been on market 64 days. Have you received any prior offers? Is the seller open to a 6% concession, seller financing, or rate buy-down credit?
- Built in 1968 — when were the roof, HVAC, electrical panel, plumbing, and water heater last replaced?
- What does the HOA fee cover, when was the last increase, and are there any pending special assessments or reserve-fund shortfalls?
- Why hasn't it sold? Are there any deal-killer items the seller is aware of (foundation, flood, title, zoning, code violations)?
- Is there a deadline driving the sale (1031 exchange, divorce, estate, relocation)? That informs how much negotiation room exists.
- Schools are B-rated — typically a magnet for longer-tenancy family renters. What's the average tenant stay here, and is there a school-zone premium baked into asking?
- The area grade is low — what's the realistic commute time and amenity access for the typical tenant pool here? Any planned neighborhood developments (good or bad) we should know about?
- What's the average days-on-market for RENTAL listings here right now (not sales)? A rising rental-DOM trend means longer vacancies and softer asking-rent achievability than the comps imply.
- What's the recent tenant-quality profile in this submarket — average credit score on applications, eviction rate, late-payment / NSF rate, and stable-employment percentage? A property-management company in the area should have these aggregated.
- How much new for-sale + rental construction is in the pipeline within 1–3 miles? Heavy new supply typically softens prices + rents 12–24 months out; constrained supply supports both.
Investment metrics
- 1% rule
- 1.02% ✓
- Cap rate
- 5.87%
- Cash-on-cash
- -1.51%
- DSCR
- 0.93
- GRM
- 8.2
CMA / ARV
- ARV (median comp)
- $97,803
- List price
- $125,000
- Delta
- 27.81%
- Verdict
- OVERPRICED
- Comps
- 17 within 1.0 mi
Show comp detail 3 sales within ~0.75 mi
| Address | Dist | Beds/Ba | Sqft | Sold | Price | $/sf | Match |
|---|---|---|---|---|---|---|---|
| 334 S Nelson Ave | 0.58mi | 2/1.0 (+1) | 916 (+1%) | 0mo | $148,900 | $163 | 66 |
| 512 S Carol Ave | 0.58mi | 2/1.0 (+1) | 875 (-3%) | 12mo | $156,250 | $179 | 52 |
| 210 W Wagler St | 0.64mi | 2/2.0 (+1) | 982 (+8%) | 8mo | $167,500 | $171 | 40 |
Match score weights: distance 35% · size 25% · config 20% · recency 20%. Top-matched comps best support the ARV.
Projected returns pro-forma
-3.0% appreciation · 3.0% rent growth · sell at horizon
- IRR
- -18.7%
- Equity multiple
- 0.34×
- Total profit
- $-22,936
- Equity at exit
- $18,638
- IRR
- -10.9%
- Equity multiple
- 0.34×
- Total profit
- $-23,060
- Equity at exit
- $10,808
Cash invested: $35,000 (down + closing). Projections, not guarantees.
Landlord ↔ Tenant lean methodology
- Overall (STATE)
- 43 Moderately Tenant-Leaning
- State Illinois
- 43 Moderately Tenant-Leaning · D+7
- County
- — inherits STATE
- City
- — inherits STATE
ZIP-level market 61550
- Active inventory
- 63
- Price-to-rent
- 8.2×
Monthly cashflow live
- Estimated rent
- $1,269 medium interval (Pro) →
- Mortgage (P&I)
- −$656
- Tax from tax record
- −$194 /mo · $2,328/yr
- Insurance
- −$52
- HOA
- −$145
- Vacancy / Maint / Mgmt
- −$266
- Net cashflow
- $-44
Break-even live
Sensitivity live
| Price | -10% $27 | -5% $-9 | +0% $-44 | +5% $-80 | +10% $-115 |
|---|---|---|---|---|---|
| Rent | -10% $-144 | -5% $-94 | +0% $-44 | +5% $6 | +10% $56 |
| Rate | -1.0pp $19 | -0.5pp $-12 | base $-44 | +0.5pp $-77 | +1.0pp $-110 |
UW: 25.0% down · 7.5% · 30yr · 1.5% tax · 5.0% vac · 8.0% maint · 8.0% mgmt
Financing live
Cash to close
- Down payment
- $31,250
- Closing costs
- $3,750
- Reserves months
- —
- Total cash needed
- —
Loan-product check · same deal, 3 products live
Conventional
25% down · 7.5% · 30yr
- Down + closing
- —
- Monthly P&I
- —
- Monthly cashflow
- —
- DSCR
- —
- Eligible?
- —
Personal DTI + credit; lowest rate.
DSCR
20% down · 8.5% · 30yr
- Down + closing
- —
- Monthly P&I
- —
- Monthly cashflow
- —
- DSCR
- —
- Eligible?
- —
No personal income docs; deal must DSCR.
Hard money
10% down · 12.0% · 12mo
- Down + closing
- —
- Monthly P&I
- —
- Monthly cashflow
- —
- DSCR
- —
- Eligible?
- —
Short-term bridge; refi at stabilization.
Rent comps 2 comps
| Address | Beds | Baths | Sqft | Rent | $/sqft | DOM | Units | Dist |
|---|---|---|---|---|---|---|---|---|
| 514 N Main St Morton, IL | 2.0 | 1.0 | 1087 | $1,600 | $1.47 | 23d | 1 | 0.73mi |
| 1240 S Main St Morton, IL | 1.0–2.0 | 1.0–1.5 | 1000 | $950 | $0.95 | 15d | 2 | 0.76mi |
HOA detail
- Monthly dues
- $145 · $1,740/yr
Listing history 23 events
-
2026-06-22days on market $125,000 Active 64 DOM
-
2026-06-19days on market $125,000 Active 62 DOM
-
2026-06-18days on market $125,000 Active 61 DOM
-
2026-06-17days on market $125,000 Active 60 DOM
-
2026-06-16days on market $125,000 Active 59 DOM
-
2026-06-15days on market $125,000 Active 58 DOM
-
2026-06-14days on market $125,000 Active 56 DOM
-
2026-06-13days on market $125,000 Active 55 DOM
-
2026-06-10days on market $125,000 Active 53 DOM
-
2026-06-09days on market $125,000 Active 52 DOM
-
2026-06-08days on market $125,000 Active 51 DOM
-
2026-06-07days on market $125,000 Active 50 DOM
-
2026-06-05days on market $125,000 Active 47 DOM
-
2026-06-02days on market $125,000 Active 45 DOM
-
2026-06-01days on market $125,000 Active 44 DOM
-
2026-05-31days on market $125,000 Active 43 DOM
-
2026-05-30days on market $125,000 Active 42 DOM
-
2026-05-06price $125,000 473-char remark
Show marketing remark (473 chars)
Move-in ready efficient two-bedroom brick and vinyl sided attached condo with a carport and storage shed. Interior has been freshened up and awaits new ownership! The sensible layout includes an open living/dining/kitchen concept, hall laundry facilities, two nice sized bedrooms, and a full hall bath (accessed from main area as well as one bedroom). Quaint back patio plus all appliances including washer and dryer. $145.00/month association dues. Enjoy easy living here!
-
2026-04-13$135,000 Active 473-char remark
Show marketing remark (473 chars)
Move-in ready efficient two-bedroom brick and vinyl sided attached condo with a carport and storage shed. Interior has been freshened up and awaits new ownership! The sensible layout includes an open living/dining/kitchen concept, hall laundry facilities, two nice sized bedrooms, and a full hall bath (accessed from main area as well as one bedroom). Quaint back patio plus all appliances including washer and dryer. $145.00/month association dues. Enjoy easy living here!
-
2015-06-04soldstatus $77,500
-
2002-08-27soldstatus $69,100
-
2002-08-26soldstatus $69,000 198-char remark
Show marketing remark (198 chars)
TWO BEDROOM RANCH CONDO WITH ROECKER CABINETS*A VERY NICE, CLEAN UNIT* FLOOR COVERING ALLOWANCE OF $2,500. (SEE FLOORING COSTS PROPOSAL ON COUNTER)*APPLIANCES NOT WARRANTED*WASHER AND DRYER TO STAY.
-
2002-06-21$73,500 198-char remark
Show marketing remark (198 chars)
TWO BEDROOM RANCH CONDO WITH ROECKER CABINETS*A VERY NICE, CLEAN UNIT* FLOOR COVERING ALLOWANCE OF $2,500. (SEE FLOORING COSTS PROPOSAL ON COUNTER)*APPLIANCES NOT WARRANTED*WASHER AND DRYER TO STAY.
ⓘ Source: listings_history table (triggers on properties + properties_extension) + one-shot
backfill from property_details.listing_events for pre-trigger history.
Tax reassessment forecast IL · Partial reset (capped growth)
- Current annual tax
- $2,328 · $194/mo
- Projected year-2 tax
- $2,583 · $215/mo
- Expected delta
- +$255/yr (+$21/mo · 10.9%)
ⓘ Screening estimate from a state-policy table — verify with the county assessor before closing.
Climate risk First Street
- Flood 1/10 Low FEMA zone X (unshaded) · 0% chance over 30 yrs
- Wildfire 1/10 Low
- Heat 3/10 Moderate 7 d/yr ≥104°F today · 18 d/yr by 30 yrs out
- Wind 2/10 Low 100% chance of damaging wind over 30 yrs
- Air quality 2/10 Low 1 unhealthy d/yr today · 2 by 30 yrs out
Nearby sold comps map
Loading sold comps map…
Walkable amenities ~0.75 mi
Loading nearby amenities…
Taxation est. · year 1
- Rental income
- $15,227
- − Mortgage interest
- −$7,002
- − Property taxes
- −$2,328
- − Insurance
- −$625
- − Repairs & maintenance
- −$1,218
- − Management
- −$1,218
- − HOA
- −$1,740
- − Depreciation
- −$3,636
- Taxable loss
- −$2,541
- Est. tax savings @ 24.0%
- +$610
- After-tax cash flow
- $80/yr
For passive investors: Depreciation is non-cash, so a rental often shows a tax loss while cash-flowing — sheltering income. Rental losses are passive: they offset passive income freely, and up to $25,000/yr can offset ordinary (W-2) income if you actively participate and your MAGI is under $100k (phasing out to $0 by $150k); unused losses carry forward. On sale, claimed depreciation is recaptured at up to 25%, and gains may owe capital-gains tax (a 1031 exchange can defer both). Figures are a year-1 estimate at your 24.0% rate — not tax advice; consult a CPA.
Schools (NCES district)
- District
- Morton CUSD 709
- NCES district ID
- 1726800
- Math proficiency
- 48% ▼ -3.00%
- Reading proficiency
- 59% ▼ -6.00%
- Median HH income
- $71,729
- Composite
- 47.72/100
- National rank
- #2239
- State rank
- #41 of 620 in IL
Livability — Morton
- Score
- 86/100
- State rank
- #22
- US rank
- #419
Category grades
Schools grade is shown separately in the Schools card above.
Census & demographics
- Census place
- Morton, IL
- City population
- 18,688
- Population (ZIP)
- 18,688
Population outlook (Tazewell County) Hauer SSP2
- Today (2025)
- 131,252 people
- By 2030
- 128,028 · -2.5%
- By 2040
- 120,443 · -8.2%
- By 2050
- 111,872 · -14.8%
- By 2075
- 89,843 · -31.5%
- By 2100
- 66,468 · -49.4%
Race, ethnicity, and origin ACS 2023
- Neighborhood character
- Predominantly White (92%)
- Race & ethnicity
- White 92% Two or more races 3% Asian 3% Hispanic / Latino 2%
- Common ancestry
- Italian 4% Lithuanian 3% Romanian 2%
- Foreign-born
- 2% · China
- Languages at home
- 97% English-only · Chinese 1% Spanish 1% Other Indo-European 1%
Political lean MEDSL · Tazewell
- 2024 margin
- Strong R (+26.7) · D 35.8% · R 62.5% · Other 1.8%
- 2008→2024 swing
- -20.6pp toward R · 2008: -6.0pp · 2024: -26.7pp
- All cycles
- 2024: R+26.7 2020: R+25.6 2016: R+28.5 2012: R+17.9 2008: R+6.0
Not yet ingested
- Civics
- —
Market trends
- HPI YoY
- ▼ -102.61%
- Current HPI
- 159.6287
- Rent YoY
- —
- Metro
- —
- State GDP YoY
- ▲ 1.59%
- F500 in state
- 60
Industry mix (Fortune 500 HQ in IL)
| Industry | F500 HQs | Revenue |
|---|---|---|
| Insurance | 4 | $201B |
|
||
| Consumer Goods | 4 | $87B |
|
||
| Industrial Machinery | 3 | $64B |
|
||
| Healthcare | 2 | $55B |
|
||
| Retail / Pharmacy | 1 | $148B |
|
||
| Agriculture / Food | 1 | $86B |
|
||
Price history
+70.1% since first listed6 events — show timeline
- 2026-05-06 Price Changed $125,000 RMLSA as Distributed by MLS Grid
- 2026-04-13 Listed $135,000 RMLSA as Distributed by MLS Grid
- 2015-06-04 Sold (Public Records) $77,500 Public Records
- 2002-08-27 Sold (Public Records) $69,100 Public Records
- 2002-08-26 Sold (MLS) $69,000 RMLSA as Distributed by MLS Grid
- 2002-06-21 Listed $73,500 RMLSA as Distributed by MLS Grid
Property tax history
+11.3%/yrLatest (2024): $2,328 · +3.6% YoY. Source: county tax records.
Cash-flow waterfall
monthlySold comps — $/sqft
last 12 mo · ≤1 miLoading sold comps…