 🏷️ Likely Rental
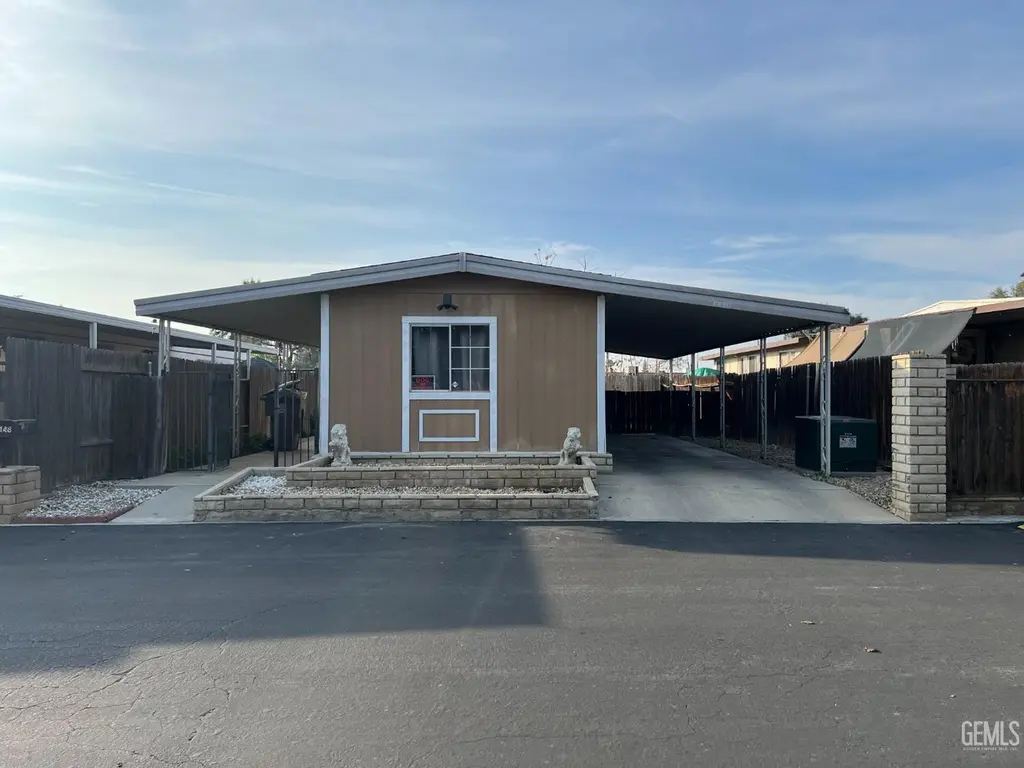
3535 Stine Rd #148 · Bakersfield, CA
Flood risk 1/10 · Minimal
- FEMA flood zone
- X (unshaded)
- Chance of flooding over 30 yrs
- 0.0%
- Est. flood insurance / yr
- $507 – $1,088
Fire risk 1/10 · Minimal
- Est. fire insurance / yr
- $659 – $1,223
Heat risk 8/10 · Major
- Hot days now (above 105°F)
- 7 days/yr
- Hot days in 30 yrs
- 18 days/yr
Wind risk 1/10 · Minimal
- Chance of severe wind over 30 yrs
- —
Air-quality risk 10/10 · Severe
- Unhealthy air days now
- 33 days/yr
- Unhealthy air days in 30 yrs
- 38 days/yr
Risk factors via First Street. Map © Google.
Why this score? — see what drove the B+ grade
The composite is a weighted blend of 9 inputs, each scored 0–100. Each bar is that input's sub-score; the figure is the points it added to the 100-point composite (weight × sub-score).
- Cash flow +30.0/30.0
- ARV discount +15.0/15.0
- 1% rule +10.0/10.0
- DSCR +10.0/10.0
- Schools +4.2/10.0
- Rent growth +3.3/5.0
- Livability +2.9/5.0
- Condition / age +2.5/5.0
- Appreciation +0.0/10.0
$38,000
🖨 Deal sheet (PDF) 📄 Offer letter ✓ Due diligence
Listing remarks
Fixer opportunity on this Manufactured home. This 2-bedroom 1 bath mobile home has a carport patio and small yard. The Park is Stockdale Villas Mobile Home Park! Great investment has lots of amenities like park, pool, gym and community center. Monthly rent is $792 and includes water. Needs your imagination and TLC and this one is a money maker. Owner installed a new ac system 3 years ago Seller extremely motivated - bring your CASH offer and let's get it sold!
Key facts
- Community center
- Carport patio
- New ac system
Tags
Property features AI
Finance
- HOA & community: Association clubhouse/recreation; Association gym/exercise; Association pool; Association park
Exterior
- Parking: Carport
- Utilities: Public sewer; Public water
- Home design: Manufactured home zoning; Vacant occupancy
- Construction: Composition roof; Concrete/perimeter foundation
- Exterior features: Covered patio; Community pool; Located in Spice Tract neighborhood; Cross street: Planz Rd; Leased space (manufactured home space)
Interior
- Kitchen: Range/oven
- Bathrooms: 1 full bathroom
- Heating & cooling: Evaporative cooling
- Interior features: Range/oven; Evaporative cooling
Neighborhood map
What this means for you Summary
Snapshot
- This is a 2-bed/2.0-bath manufactured listed at $38k.
Deal economics
- At list price, monthly cash flow is $825 ($10k/yr) — positive.
- The deal already cash-flows at list — no discount required.
- Meets the 1% rule at list price ($1k rent vs $38k).
- Cap rate 32.3% vs local median 3.6% in Bakersfield — top-decile yield for the area; either an underpriced asset or a hidden risk that comps aren't pricing in. Stress-test before assuming the spread holds.
Location & tenants
- Location reads 58/100 on livability (#716 in CA) — a working-class tenant base; expect higher turnover. Strengths: housing A+; Watch: health & safety D, crime F, amenities F.
- Panama-Buena Vista Union (urban): math 37% / reading 52% proficiency, ranked #542 of 1,400 in CA (top 39%) — families likely to look elsewhere, expect single-tenant / working-renter base with shorter leases.
- Zoned schools: Louise Sandrini Elementary (597 students, 92% FRL); O. J. Actis Junior High (680 students, 83% FRL); West High (reading 90%, 2,025 students, 91% FRL) — zoned schools average 89% FRL vs 51% district-wide (38 pts higher); higher-poverty schools than district average — tighter screening recommended.
- Market conditions: Rents rising (+3.2%/yr); 208 active listings in the ZIP; 17 comparable units currently listed for rent nearby; rentals leasing fast (median 12d on market — plan ~1-2 weeks tenant-placement turnaround); 3,244 units permitted in Kern County in 2024 (73 in 5+ unit buildings).
Forward outlook
- Local home prices are declining (-3.0%/yr); year-one equity from $263 of loan paydown is wiped out by about $1k of value loss. Plan a longer hold.
- Kern County population projected at +17% by 2050 — long-run rental-demand tailwind backs the buy-and-hold thesis.
- At projected returns (-3.0% appreciation + 3.2% rent growth), your $11k cash investment doubles in ~2 years — after that, you're playing with house money.
Negotiation context
- Only 13 days on market — expect competitive offers; lowballing is unlikely to land.
- 2 sale attempts with the ask held roughly flat each time — persistent listings suggest the price (not the market) is what's stuck; bring a comps-based counter.
Risks & watch-outs
- Climate carrying-cost: extreme-heat days projected 7→18/yr by 2055 (HVAC capex compounding) — expect insurance premiums to compound above CPI over the hold.
Questions for the listing agent
- Is there a deadline driving the sale (1031 exchange, divorce, estate, relocation)? That informs how much negotiation room exists.
- Schools are D-rated, which usually means shorter tenancies and higher turnover. Who's the typical renter profile here, and what's been the actual vacancy rate?
- Crime grade is F in this area — have there been break-ins, vandalism, or insurance claims at this property in the last 3 years? What carrier currently insures it and at what premium?
- What's the average days-on-market for RENTAL listings here right now (not sales)? A rising rental-DOM trend means longer vacancies and softer asking-rent achievability than the comps imply.
- What's the recent tenant-quality profile in this submarket — average credit score on applications, eviction rate, late-payment / NSF rate, and stable-employment percentage? A property-management company in the area should have these aggregated.
- How much new for-sale + rental construction is in the pipeline within 1–3 miles? Heavy new supply typically softens prices + rents 12–24 months out; constrained supply supports both.
Investment metrics
- 1% rule
- 3.52% ✓
- Cap rate
- 32.35%
- Cash-on-cash
- 93.04%
- DSCR
- 5.14
- GRM
- 2.4
CMA / ARV
- ARV (median comp)
- $64,039
- List price
- $38,000
- Delta
- -40.66%
- Verdict
- UNDERPRICED
- Comps
- 5 within 2.0 mi
Projected returns pro-forma
-3.0% appreciation · 3.2% rent growth · sell at horizon
- IRR
- 94.1%
- Equity multiple
- 5.39×
- Total profit
- $46,657
- Equity at exit
- $5,666
- IRR
- 96.9%
- Equity multiple
- 11.28×
- Total profit
- $109,399
- Equity at exit
- $3,286
Cash invested: $10,640 (down + closing). Projections, not guarantees.
Landlord ↔ Tenant lean methodology
- Overall (STATE)
- 18 Strongly Tenant-Friendly
- State California
- 18 Strongly Tenant-Friendly · D+13
- County
- — inherits STATE
- City
- — inherits STATE
ZIP-level market 93309
- Rents YoY
- 3.2%
- Active inventory
- 208
- Price-to-rent
- 2.4×
Monthly cashflow live
- Estimated rent
- $1,336 high interval (Pro) →
- Mortgage (P&I)
- −$199
- Tax from tax record
- −$16 /mo · $187/yr
- Insurance
- −$16
- HOA
- −$0
- Vacancy / Maint / Mgmt
- −$281
- Net cashflow
- $825
Break-even live
Sensitivity live
| Price | -10% $847 | -5% $836 | +0% $825 | +5% $814 | +10% $803 |
|---|---|---|---|---|---|
| Rent | -10% $719 | -5% $772 | +0% $825 | +5% $878 | +10% $931 |
| Rate | -1.0pp $844 | -0.5pp $835 | base $825 | +0.5pp $815 | +1.0pp $805 |
UW: 25.0% down · 7.5% · 30yr · 1.5% tax · 5.0% vac · 8.0% maint · 8.0% mgmt
Financing live
Cash to close
- Down payment
- $9,500
- Closing costs
- $1,140
- Reserves months
- —
- Total cash needed
- —
Loan-product check · same deal, 3 products live
Conventional
25% down · 7.5% · 30yr
- Down + closing
- —
- Monthly P&I
- —
- Monthly cashflow
- —
- DSCR
- —
- Eligible?
- —
Personal DTI + credit; lowest rate.
DSCR
20% down · 8.5% · 30yr
- Down + closing
- —
- Monthly P&I
- —
- Monthly cashflow
- —
- DSCR
- —
- Eligible?
- —
No personal income docs; deal must DSCR.
Hard money
10% down · 12.0% · 12mo
- Down + closing
- —
- Monthly P&I
- —
- Monthly cashflow
- —
- DSCR
- —
- Eligible?
- —
Short-term bridge; refi at stabilization.
Rent comps 17 comps
| Address | Beds | Baths | Sqft | Rent | $/sqft | DOM | Units | Dist |
|---|---|---|---|---|---|---|---|---|
| 4701 Beechwood St #67 Bakersfield, CA | 1.0 | 1.0 | 528 | $1,275 | $2.41 | 4d | 1 | 0.15mi |
| 4600 Beechwood St Bakersfield, CA | 1.0 | 1.0 | 642 | $1,550 | $2.41 | 12d | 1 | 0.17mi |
| 3800 Stine Rd Bakersfield, CA | 2.0 | 1.0 | 565 | $1,250 | $2.21 | 45d | 1 | 0.21mi |
| 3800 Stine Rd Bakersfield, CA | 1.0 | 1.0 | 480 | $1,250 | $2.60 | 20d | 2 | 0.21mi |
| 3109 Edmonton St Unit D Bakersfield, CA | 2.0 | 1.0 | 725 | $1,195 | $1.65 | 4d | 1 | 0.25mi |
| 3000 Stine Rd Bakersfield, CA | 2.0 | 1.0 | 595 | $1,015 | $1.71 | 45d | 1 | 0.32mi |
| 3000 New Stine Rd Unit 20-03 Bakersfield, CA | 1.0 | 1.0 | 650 | $1,125 | $1.73 | 45d | 1 | 0.33mi |
| 4809 Hahn Ave #24 Bakersfield, CA | 2.0 | 1.0 | 690 | $1,450 | $2.10 | 4d | 1 | 0.38mi |
| 4301 Poach St Unit B Bakersfield, CA | 1.0 | 1.0 | 475 | $1,325 | $2.79 | 23d | 1 | 0.78mi |
| 4220 Parker Ave Unit C5 Bakersfield, CA | 1.0 | 1.0 | 700 | $995 | $1.42 | 4d | 1 | 0.97mi |
| 4220 Parker Ave Apt A1 Bakersfield, CA | 1.0 | 1.0 | 700 | $995 | $1.42 | 45d | 1 | 0.97mi |
| 3401 Wible Rd Bakersfield, CA | 1.0 | 1.0 | 700 | $1,175 | $1.68 | 45d | 1 | 1.00mi |
| 2801 Wible Rd Bakersfield, CA | 1.0–2.0 | 1.0 | 700 | $1,300 | $1.86 | 4d | 2 | 1.03mi |
| 5051 Ming Ave Bakersfield, CA | 1.0–3.0 | 1.0–2.0 | 925 | $1,460 | $1.58 | 4d | 9 | 1.05mi |
| 5100 Ming Ave Bakersfield, CA | 1.0–2.0 | 1.0 | 732 | $1,300 | $1.77 | 4d | 9 | 1.12mi |
| 2224 S Real Rd Bakersfield, CA | 1.0 | 1.0 | 611 | $1,125 | $1.84 | 4d | 1 | 1.12mi |
| 1400 Valhalla Dr Bakersfield, CA | 2.0 | 1.0 | 665 | $1,345 | $2.02 | 25d | 1 | 1.29mi |
Listing history 4 events
-
2026-05-11status Pending 464-char remark
-
2026-04-28$38,000 Active 464-char remark
-
2025-12-23price $44,950
-
2025-12-05$50,000 Active
ⓘ Source: listings_history table (triggers on properties + properties_extension) + one-shot
backfill from property_details.listing_events for pre-trigger history.
Tax reassessment forecast CA · Resets to sale price
- Current annual tax
- $187 · $16/mo
- Projected year-2 tax
- $289 · $24/mo
- Expected delta
- +$102/yr (+$8/mo · 54.3%)
ⓘ Screening estimate from a state-policy table — verify with the county assessor before closing.
Climate risk First Street
- Flood 1/10 Low FEMA zone X (unshaded) · 0% chance over 30 yrs
- Wildfire 1/10 Low
- Heat 8/10 Severe 7 d/yr ≥105°F today · 18 d/yr by 30 yrs out
- Wind 1/10 Low
- Air quality 10/10 Extreme 33 unhealthy d/yr today · 38 by 30 yrs out
Nearby sold comps map
Loading sold comps map…
Walkable amenities ~0.75 mi
Loading nearby amenities…
Taxation est. · year 1
- Rental income
- $16,036
- − Mortgage interest
- −$2,129
- − Property taxes
- −$187
- − Insurance
- −$190
- − Repairs & maintenance
- −$1,283
- − Management
- −$1,283
- − Depreciation
- −$1,105
- Taxable income
- $9,859
- Est. tax owed @ 24.0%
- −$2,366
- After-tax cash flow
- $7,534/yr
For passive investors: Depreciation is non-cash, so a rental often shows a tax loss while cash-flowing — sheltering income. Rental losses are passive: they offset passive income freely, and up to $25,000/yr can offset ordinary (W-2) income if you actively participate and your MAGI is under $100k (phasing out to $0 by $150k); unused losses carry forward. On sale, claimed depreciation is recaptured at up to 25%, and gains may owe capital-gains tax (a 1031 exchange can defer both). Figures are a year-1 estimate at your 24.0% rate — not tax advice; consult a CPA.
Schools (NCES district)
- District
- Panama-Buena Vista Union
- NCES district ID
- 0606390
- Math proficiency
- 37% ▲ 3.00%
- Reading proficiency
- 52% ▲ 1.00%
- Median HH income
- $63,361
- Composite
- 41.71/100
- National rank
- #7191
- State rank
- #542 of 1400 in CA
Livability — Bakersfield
- Score
- 58/100
- State rank
- #716
- US rank
- #21355
Category grades
Schools grade is shown separately in the Schools card above.
Census & demographics
- Census place
- Bakersfield, CA
- County
- Kern County · 710,371 people
- City population
- 499,124
- Metro
- Bakersfield, CA
- Population (ZIP)
- 63,217
- Household income
- $63,544
- Rent vs Own
- Severe rent burden
- 3180.0
Population outlook (Kern County) Hauer SSP2
- Today (2025)
- 947,286 people
- By 2030
- 978,984 · +3.3%
- By 2040
- 1,045,018 · +10.3%
- By 2050
- 1,105,232 · +16.7%
- By 2075
- 1,229,538 · +29.8%
- By 2100
- 1,238,059 · +30.7%
Race, ethnicity, and origin ACS 2023
- Neighborhood character
- Diverse neighborhood (Simpson 0.61)
- Race & ethnicity
- Hispanic / Latino 54% White 30% Two or more races 29% Black 8% Asian 4% Native American 1%
- Hispanic origin (detail)
- Mexican 46%
- Common ancestry
- Slovak 2% Italian 1% Lithuanian 1%
- Foreign-born
- 16% · Canada, China
- Languages at home
- 62% English-only · Spanish 34% Other Indo-European 1% Tagalog/Filipino 1%
Political lean MEDSL · Kern
- 2024 margin
- Strong R (+21.1) · D 38.2% · R 59.3% · Other 2.5%
- 2008→2024 swing
- -3.3pp toward R · 2008: -17.8pp · 2024: -21.1pp
- All cycles
- 2024: R+21.1 2020: R+10.2 2016: R+15.0 2012: R+20.9 2008: R+17.8
Not yet ingested
- Civics
- —
Market trends
- HPI YoY
- ▼ -296.97%
- Current HPI
- 376.8674
- Rent YoY
- ▲ 3.20%
- Metro
- Bakersfield, CA
- State GDP YoY
- ▲ 3.21%
- F500 in state
- 116
Industry mix (Fortune 500 HQ in CA)
| Industry | F500 HQs | Revenue |
|---|---|---|
| Technology | 27 | $1,492B |
|
||
| Financial Services | 3 | $174B |
|
||
| Retail | 3 | $44B |
|
||
| Insurance | 3 | $26B |
|
||
| Media / Entertainment | 2 | $115B |
|
||
| Pharmaceuticals / Biotech | 2 | $62B |
|
||
Price history
-24.0% since first listed4 events — show timeline
- 2026-05-11 Pending — GEMLS
- 2026-04-28 Listed $38,000 GEMLS
- 2025-12-23 Price Changed $44,950 GEMLS
- 2025-12-05 Listed $50,000 GEMLS
Property tax history
+5.3%/yrLatest (2025): $187 · -2.6% YoY. Source: county tax records.
Cash-flow waterfall
monthlySold comps — $/sqft
last 12 mo · ≤1 miLoading sold comps…