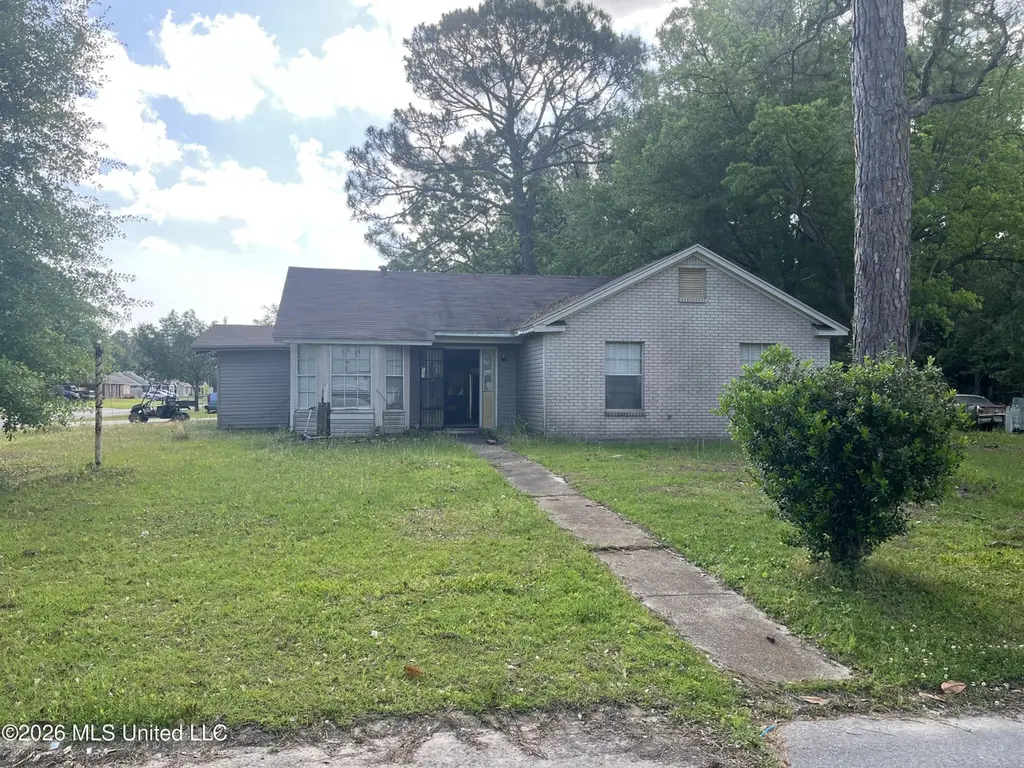
7212 Greenbriar St · Gulf Hills, MS
Flood risk 1/10 · Minimal
- FEMA flood zone
- X (unshaded)
- Chance of flooding over 30 yrs
- 0.0%
- Est. flood insurance / yr
- $507 – $1,088
Fire risk 6/10 · Moderate
- Est. fire insurance / yr
- $1,241 – $2,305
Heat risk 10/10 · Severe
- Hot days now (above 107°F)
- 7 days/yr
- Hot days in 30 yrs
- 22 days/yr
Wind risk 9/10 · Severe
- Chance of severe wind over 30 yrs
- 99.0%
Air-quality risk 2/10 · Minimal
- Unhealthy air days now
- 1 days/yr
- Unhealthy air days in 30 yrs
- 2 days/yr
Risk factors via First Street. Map © Google.
Why this score? — see what drove the B grade
The composite is a weighted blend of 9 inputs, each scored 0–100. Each bar is that input's sub-score; the figure is the points it added to the 100-point composite (weight × sub-score).
- Cash flow +30.0/30.0
- 1% rule +10.0/10.0
- DSCR +10.0/10.0
- ARV discount +7.5/15.0
- Schools +4.4/10.0
- Livability +3.6/5.0
- Rent growth +2.8/5.0
- Condition / age +2.5/5.0
- Appreciation +0.0/10.0
$75,000
🖨 Deal sheet (PDF) 📄 Offer letter ✓ Due diligence
Listing remarks
Investor special. Enter at your own risk. Good location. Very close to the interstate.
Key facts
- 0.23 acre lot
Property features AI
Exterior
- Parking: Concrete parking
- Utilities: Sewer listed as Other; Water source listed as Other; Utilities listed as Other
- Home design: Single Family Residence, house; One level
- Construction: Brick and siding exterior; Slab foundation; Built area approximately 1,562 (source: assessor); Property described as fixer
- Exterior features: Asphalt shingle roof; Concrete parking surface
Interior
- Bathrooms: 2 bathrooms (total)
- Heating & cooling: Has heating (type listed as Other); Has cooling (type listed as Other)
- Interior features: Appliances listed as Other
Neighborhood map
What this means for you Summary
Snapshot
- This is a 3-bed/2.0-bath single-family listed at $75k.
Deal economics
- At list price, monthly cash flow is $864 ($10k/yr) — positive.
- The deal already cash-flows at list — no discount required.
- Meets the 1% rule at list price ($2k rent vs $75k).
- Cap rate 20.1% vs local median 4.5% in Gulf Hills — top-decile yield for the area; either an underpriced asset or a hidden risk that comps aren't pricing in. Stress-test before assuming the spread holds.
Location & tenants
- Location reads 71/100 on livability (#38 in MS) — a middle-class / working-renter tenant base. Strengths: crime A+, cost of living A+, housing A+; Watch: employment D+, schools F, amenities F.
- Jackson County School District (rural): math 53% / reading 48% proficiency, ranked #10 of 130 in MS (top 8%) — acceptable for families but not a draw, mixed tenant base, ~2y average lease.
- Market conditions: Rents rising (+1.3%/yr); 714 active listings in the ZIP; 8 comparable units currently listed for rent nearby; rentals lingering (median 45d on market — plan ~5-8 weeks vacancy on turnover, expect pricing pressure); 50% of comp listings sitting > 30 days — soft ceiling on asking rent; solid renter incomes; 516 units permitted in Jackson County in 2024 (6 in 5+ unit buildings).
Forward outlook
- Local home prices are declining (-3.0%/yr); year-one equity from $519 of loan paydown is wiped out by about $2k of value loss. Plan a longer hold.
- At projected returns (-3.0% appreciation + 1.3% rent growth), your $21k cash investment doubles in ~3 years — after that, you're playing with house money.
Negotiation context
- Only 1 days on market — expect competitive offers; lowballing is unlikely to land.
Risks & watch-outs
- Climate carrying-cost: severe wind risk, 99% chance of damaging wind over 30y; major wildfire risk; extreme-heat days projected 7→22/yr by 2055 (HVAC capex compounding) — expect insurance premiums to compound above CPI over the hold.
Questions for the listing agent
- Is there a deadline driving the sale (1031 exchange, divorce, estate, relocation)? That informs how much negotiation room exists.
- Schools are F-rated, which usually means shorter tenancies and higher turnover. Who's the typical renter profile here, and what's been the actual vacancy rate?
- What's the average days-on-market for RENTAL listings here right now (not sales)? A rising rental-DOM trend means longer vacancies and softer asking-rent achievability than the comps imply.
- What's the recent tenant-quality profile in this submarket — average credit score on applications, eviction rate, late-payment / NSF rate, and stable-employment percentage? A property-management company in the area should have these aggregated.
- How much new for-sale + rental construction is in the pipeline within 1–3 miles? Heavy new supply typically softens prices + rents 12–24 months out; constrained supply supports both.
Investment metrics
- 1% rule
- 2.41% ✓
- Cap rate
- 20.12%
- Cash-on-cash
- 49.40%
- DSCR
- 3.20
- GRM
- 3.5
CMA / ARV
- ARV (on-the-fly)
- $232,738
- Comps found
- 12
Show comp detail 12 sales within ~0.75 mi
| Address | Dist | Beds/Ba | Sqft | Sold | Price | $/sf | Match |
|---|---|---|---|---|---|---|---|
| 7212 Greenbriar St | 0.00mi | 3/2.0 | 1,562 (0%) | 1mo | $75,000 | $48 | 99 |
| 13104 Sweetbriar St | 0.10mi | 3/2.0 | 1,499 (-4%) | 9mo | $205,000 | $137 | 81 |
| 13501 Saint Martin Dr | 0.45mi | 3/2.0 | 1,442 (-8%) | 4mo | $215,000 | $149 | 63 |
| 2020 Irma Cir | 0.70mi | 3/2.0 | 1,535 (-2%) | 4mo | $239,900 | $156 | 61 |
| 6601 Lancaster Blvd | 0.72mi | 3/1.5 | 1,554 (-0%) | 6mo | $194,999 | $125 | 59 |
| 13012 Horseshoe Dr #1006 | 0.22mi | 3/2.0 | 1,380 (-12%) | 15mo | $267,990 | $194 | 58 |
| 13032 Horseshoe Dr Lot 1004 | 0.23mi | 3/2.0 | 1,379 (-12%) | 15mo | $267,990 | $194 | 58 |
| 7505 Martin Ct | 0.42mi | 3/2.0 | 1,379 (-12%) | 11mo | $238,000 | $173 | 52 |
| 2125 Magazine St | 0.74mi | 3/2.5 | 1,697 (+9%) | 4mo | $215,000 | $127 | 46 |
| 2024 Toulouse St | 0.69mi | 3/2.0 | 1,393 (-11%) | 12mo | $195,000 | $140 | 40 |
| 2101 Napoleon St St | 0.70mi | 3/2.0 | 1,345 (-14%) | 12mo | $210,000 | $156 | 34 |
| 6608 Columbus Cir | 0.71mi | 4/2.5 (+1) | 1,360 (-13%) | 7mo | $179,900 | $132 | 32 |
Match score weights: distance 35% · size 25% · config 20% · recency 20%. Top-matched comps best support the ARV.
Projected returns pro-forma
-3.0% appreciation · 1.31% rent growth · sell at horizon
- IRR
- 45.1%
- Equity multiple
- 2.90×
- Total profit
- $39,935
- Equity at exit
- $11,183
- IRR
- 50.2%
- Equity multiple
- 5.47×
- Total profit
- $93,895
- Equity at exit
- $6,485
Cash invested: $21,000 (down + closing). Projections, not guarantees.
Landlord ↔ Tenant lean methodology
- Overall (STATE)
- 90 Strongly Landlord-Friendly
- State Mississippi
- 90 Strongly Landlord-Friendly · R+11
- County
- — inherits STATE
- City
- — inherits STATE
ZIP-level market 39564
- Home prices YoY
- -26.8%
- Rents YoY
- 1.3%
- Active inventory
- 714
- Price-to-rent
- 3.5×
Monthly cashflow live
- Estimated rent
- $1,810 high interval (Pro) →
- Mortgage (P&I)
- −$393
- Tax from tax record
- −$141 /mo · $1,689/yr
- Insurance
- −$31
- HOA
- −$0
- Vacancy / Maint / Mgmt
- −$380
- Net cashflow
- $864
Break-even live
Sensitivity live
| Price | -10% $907 | -5% $886 | +0% $864 | +5% $843 | +10% $822 |
|---|---|---|---|---|---|
| Rent | -10% $721 | -5% $793 | +0% $864 | +5% $936 | +10% $1,007 |
| Rate | -1.0pp $902 | -0.5pp $884 | base $864 | +0.5pp $845 | +1.0pp $825 |
UW: 25.0% down · 7.5% · 30yr · 1.5% tax · 5.0% vac · 8.0% maint · 8.0% mgmt
Financing live
Cash to close
- Down payment
- $18,750
- Closing costs
- $2,250
- Reserves months
- —
- Total cash needed
- —
Loan-product check · same deal, 3 products live
Conventional
25% down · 7.5% · 30yr
- Down + closing
- —
- Monthly P&I
- —
- Monthly cashflow
- —
- DSCR
- —
- Eligible?
- —
Personal DTI + credit; lowest rate.
DSCR
20% down · 8.5% · 30yr
- Down + closing
- —
- Monthly P&I
- —
- Monthly cashflow
- —
- DSCR
- —
- Eligible?
- —
No personal income docs; deal must DSCR.
Hard money
10% down · 12.0% · 12mo
- Down + closing
- —
- Monthly P&I
- —
- Monthly cashflow
- —
- DSCR
- —
- Eligible?
- —
Short-term bridge; refi at stabilization.
Rent comps 8 comps
| Address | Beds | Baths | Sqft | Rent | $/sqft | DOM | Units | Dist |
|---|---|---|---|---|---|---|---|---|
| 12297 Massachusetts Rd Ocean Springs, MS | 3.0 | 2.0 | 1148 | $1,595 | $1.39 | 22d | 1 | 0.74mi |
| 12293 Massachusetts Rd Ocean Springs, MS | 3.0 | 2.0 | 1148 | $1,595 | $1.39 | 44d | 1 | 0.74mi |
| 2401 Esplanade St Unit B Ocean Springs, MS | 3.0 | 2.0 | 1250 | $1,225 | $0.98 | 22d | 1 | 0.79mi |
| 6721 Washington Ave Ocean Springs, MS | 1.0–3.0 | 1.0–2.0 | 1084 | $1,696 | $1.56 | 14d | 12 | 0.81mi |
| 6428 Poco Rd Ocean Springs, MS | 3.0 | 2.0 | 1990 | $2,500 | $1.26 | 44d | 1 | 0.87mi |
| 2501 Gladiolus St Ocean Springs, MS | 3.0 | 2.0 | 1125 | $1,350 | $1.20 | 44d | 1 | 0.92mi |
| 6249 Tennyson Dr Ocean Springs, MS | 3.0 | 2.0 | 1372 | $1,600 | $1.17 | 22d | 1 | 1.09mi |
| 6217 Browning Dr Ocean Springs, MS | 3.0 | 2.0 | 1264 | $1,750 | $1.38 | 44d | 1 | 1.12mi |
Listing history 2 events
-
2026-04-30status Pending
-
2026-04-24$75,000 Active
ⓘ Source: listings_history table (triggers on properties + properties_extension) + one-shot
backfill from property_details.listing_events for pre-trigger history.
Tax reassessment forecast MS · Resets to sale price
- Current annual tax
- $1,689 · $141/mo
- Projected year-2 tax
- $1,689 · $141/mo
- Expected delta
- $0/yr ($0/mo · 0.0%)
ⓘ Screening estimate from a state-policy table — verify with the county assessor before closing.
Climate risk First Street
- Flood 1/10 Low FEMA zone X (unshaded) · 0% chance over 30 yrs
- Wildfire 6/10 Major
- Heat 10/10 Extreme 7 d/yr ≥107°F today · 22 d/yr by 30 yrs out
- Wind 9/10 Extreme 99% chance of damaging wind over 30 yrs
- Air quality 2/10 Low 1 unhealthy d/yr today · 2 by 30 yrs out
Nearby sold comps map
Loading sold comps map…
Walkable amenities ~0.75 mi
Loading nearby amenities…
Taxation est. · year 1
- Rental income
- $21,718
- − Mortgage interest
- −$4,201
- − Property taxes
- −$1,689
- − Insurance
- −$375
- − Repairs & maintenance
- −$1,737
- − Management
- −$1,737
- − Depreciation
- −$2,182
- Taxable income
- $9,796
- Est. tax owed @ 24.0%
- −$2,351
- After-tax cash flow
- $8,023/yr
For passive investors: Depreciation is non-cash, so a rental often shows a tax loss while cash-flowing — sheltering income. Rental losses are passive: they offset passive income freely, and up to $25,000/yr can offset ordinary (W-2) income if you actively participate and your MAGI is under $100k (phasing out to $0 by $150k); unused losses carry forward. On sale, claimed depreciation is recaptured at up to 25%, and gains may owe capital-gains tax (a 1031 exchange can defer both). Figures are a year-1 estimate at your 24.0% rate — not tax advice; consult a CPA.
Schools (NCES district)
- District
- Jackson County School District
- NCES district ID
- 2802160
- Math proficiency
- 53% ▼ -5.00%
- Reading proficiency
- 48% ▼ -5.00%
- Median HH income
- $53,569
- Composite
- 43.57/100
- National rank
- #2980
- State rank
- #10 of 130 in MS
Livability — Gulf Hills
- Score
- 71/100
- State rank
- #38
- US rank
- #7310
Category grades
Schools grade is shown separately in the Schools card above.
Census & demographics
- Census place
- Gulf Hills, MS
- County
- Jackson County · 82,196 people
- Metro
- Gulfport-Biloxi, MS
- Population (ZIP)
- 43,240
- Household income
- $78,596
- Rent vs Own
- Severe rent burden
- 734.0
Population outlook (Jackson County) Hauer SSP2
- Today (2025)
- 146,926 people
- By 2030
- 148,442 · +1.0%
- By 2040
- 149,631 · +1.8%
- By 2050
- 148,723 · +1.2%
- By 2075
- 147,845 · +0.6%
- By 2100
- 144,510 · -1.6%
Race, ethnicity, and origin ACS 2023
- Neighborhood character
- Predominantly White (74%)
- Race & ethnicity
- White 74% Black 10% Hispanic / Latino 8% Two or more races 7% Asian 4%
- Hispanic origin (detail)
- Mexican 3% Puerto Rican 2%
- Common ancestry
- Lithuanian 5% Slovak 4% Romanian 2%
- Foreign-born
- 5% · Canada, South Korea, Vietnam
- Languages at home
- 93% English-only · Spanish 3% Vietnamese 2% Tagalog/Filipino 1%
Political lean MEDSL · Jackson
- 2024 margin
- Solid R (+39.9) · D 29.5% · R 69.4% · Other 1.1%
- 2008→2024 swing
- -6.4pp toward R · 2008: -33.5pp · 2024: -39.9pp
- All cycles
- 2024: R+39.9 2020: R+34.6 2016: R+39.9 2012: R+36.1 2008: R+33.5
Not yet ingested
- Civics
- —
Market trends
- HPI YoY
- ▼ -74.77%
- Current HPI
- 204.2244
- Rent YoY
- ▲ 1.31%
- Metro
- Gulfport-Biloxi, MS
- State GDP YoY
- —
- F500 in state
- 0
Price history
2 events — show timeline
- 2026-04-30 Pending — MLSU
- 2026-04-24 Listed $75,000 MLSU
Property tax history
+8.9%/yrLatest (2025): $1,689 · +4.8% YoY. Source: county tax records.
Cash-flow waterfall
monthlySold comps — $/sqft
last 12 mo · ≤1 miLoading sold comps…