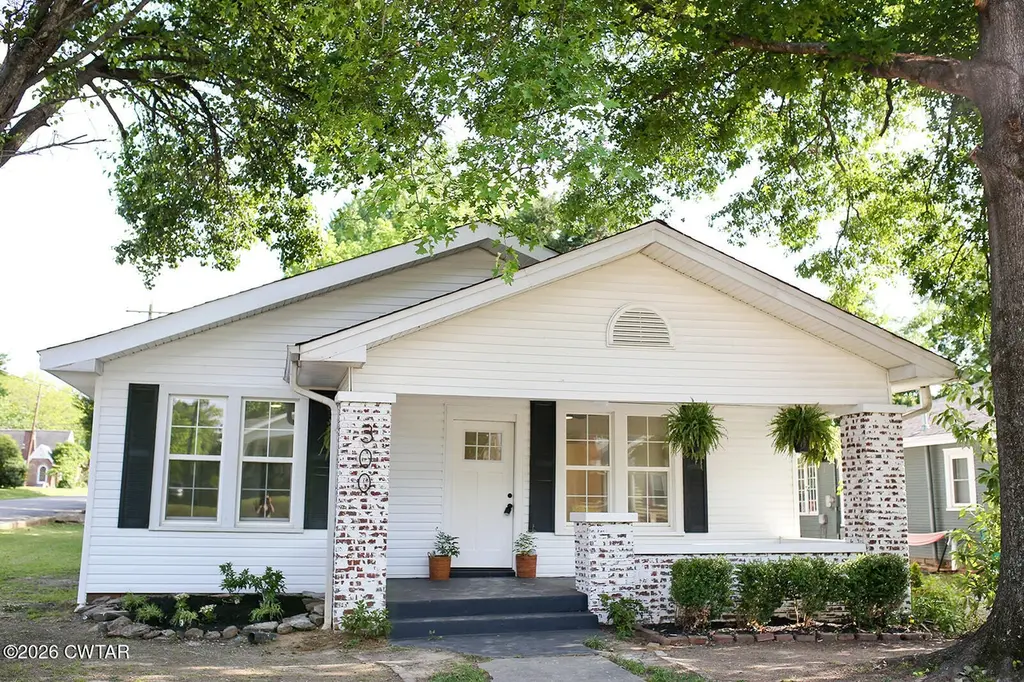
300 Roland Ave · Jackson, TN
Flood risk 1/10 · Minimal
- FEMA flood zone
- X (unshaded)
- Chance of flooding over 30 yrs
- 0.0%
- Est. flood insurance / yr
- $507 – $1,088
Fire risk 1/10 · Minimal
- Est. fire insurance / yr
- $949 – $1,763
Heat risk 6/10 · Moderate
- Hot days now (above 108°F)
- 7 days/yr
- Hot days in 30 yrs
- 20 days/yr
Wind risk 4/10 · Minor
- Chance of severe wind over 30 yrs
- 16.0%
Air-quality risk 1/10 · Minimal
- Unhealthy air days now
- 0 days/yr
- Unhealthy air days in 30 yrs
- 0 days/yr
Risk factors via First Street. Map © Google.
Why this score? — see what drove the D grade
The composite is a weighted blend of 9 inputs, each scored 0–100. Each bar is that input's sub-score; the figure is the points it added to the 100-point composite (weight × sub-score).
- Cash flow +15.6/30.0
- ARV discount +7.6/15.0
- DSCR +4.8/10.0
- Rent growth +3.8/5.0
- 1% rule +3.1/10.0
- Livability +3.1/5.0
- Condition / age +2.5/5.0
- Schools +1.2/10.0
- Appreciation +0.0/10.0
$215,000
🖨 Deal sheet (PDF) 📄 Offer letter ✓ Due diligence
Listing remarks
Charming 1935 home full of historic character with modern updates throughout! This completely updated 3-bedroom, 2.5-bath home sits on a corner lot and features a versatile flex space perfect for a home office, playroom, or additional living area. The updated kitchen includes new appliances that remain, while both full bathrooms and the half bath have been renovated. Enjoy peace of mind with a roof just 6 months old, new vinyl siding, and four mini-split units providing efficient heating and cooling. Step outside to a fenced backyard and a detached shop with power.
Key facts
- Renovated bathrooms
- Flex space
- Detached shop
Tags
Property features AI
Exterior
- Parking: 1 parking space
- Utilities: Public water
- Home design: Single-family residence; One-level / single-story
- Construction: Vinyl siding
- Exterior features: Back yard fencing; Public-maintained road access
Interior
- Bedrooms: 3 main-level bedrooms
- Bathrooms: 2 full bathrooms; 1 half bathroom; 2 main-level bathrooms
- Interior features: 8 total rooms
Neighborhood map
What this means for you Summary
Snapshot
- This is a 3-bed/1.0-bath single-family listed at $215k.
Deal economics
- At list price, monthly cash flow is $89 ($1k/yr) — positive.
- The deal already cash-flows at list — no discount required.
- To meet the 1% rule (rent ≥ 1% of price), the offer needs to be $174k (19.1% below list).
- Recommended offer: $174k (19.1% below list) — sets the bar for 1% rule.
- Cap rate 6.8% vs local median 3.5% in Jackson — top-decile yield for the area; either an underpriced asset or a hidden risk that comps aren't pricing in. Stress-test before assuming the spread holds.
Location & tenants
- Location reads 62/100 on livability (#216 in TN) — a middle-class / working-renter tenant base. Strengths: cost of living A+, housing A+; Watch: health & safety C-, crime F, amenities F.
- Madison County (urban): math 10% / reading 17% proficiency, ranked #131 of 139 in TN (top 94%) — low school quality limits family demand, transient renter base, plan for 1-2y turnover; 68% free/reduced lunch — lower-income household profile, screen leases tightly.
- Zoned schools: Alexander Elementary School (math 8% / reading 8%, grade F, #848 of 952 statewide, top 91%, 385 students, 0% FRL) — zoned schools average 0% FRL vs 68% district-wide (68 pts lower); this property's tenant base skews higher-income than the district average.
- Market conditions: Rents rising fast (+5.2%/yr); 255 active listings in the ZIP; 1 comparable units currently listed for rent nearby; lower-income renter base — watch delinquency; 247 units permitted in Madison County in 2024 (0 in 5+ unit buildings).
- At $1,740/mo this rent would consume 48% of the median local household income ($43k/yr) (locally 1701% of renters already pay >50% of income on rent) — very limited rent-growth headroom before tenants either downsize or default.
Forward outlook
- Local home prices are declining (-3.0%/yr); year-one equity from $1k of loan paydown is wiped out by about $6k of value loss. Plan a longer hold.
- Madison County population projected at -12% by 2050 — secular population decline; favor cash flow + early exit over multi-decade hold.
Negotiation context
- Only 9 days on market — expect competitive offers; lowballing is unlikely to land.
- Current owner paid $70k; list at $215k implies a 207% gain — meaningful room to come down on a strong offer.
Risks & watch-outs
- Watch-outs: built in 1935 — expect roof / HVAC / electrical / plumbing capex.
- Climate carrying-cost: extreme-heat days projected 7→20/yr by 2055 (HVAC capex compounding) — expect insurance premiums to compound above CPI over the hold.
Questions for the listing agent
- Built in 1935 — when were the roof, HVAC, electrical panel, plumbing, and water heater last replaced?
- Is there a deadline driving the sale (1031 exchange, divorce, estate, relocation)? That informs how much negotiation room exists.
- Schools are F-rated, which usually means shorter tenancies and higher turnover. Who's the typical renter profile here, and what's been the actual vacancy rate?
- Crime grade is F in this area — have there been break-ins, vandalism, or insurance claims at this property in the last 3 years? What carrier currently insures it and at what premium?
- The area grade is low — what's the realistic commute time and amenity access for the typical tenant pool here? Any planned neighborhood developments (good or bad) we should know about?
- What's the average days-on-market for RENTAL listings here right now (not sales)? A rising rental-DOM trend means longer vacancies and softer asking-rent achievability than the comps imply.
- What's the recent tenant-quality profile in this submarket — average credit score on applications, eviction rate, late-payment / NSF rate, and stable-employment percentage? A property-management company in the area should have these aggregated.
- How much new for-sale + rental construction is in the pipeline within 1–3 miles? Heavy new supply typically softens prices + rents 12–24 months out; constrained supply supports both.
Investment metrics
- 1% rule
- 0.81% ✗
- Cap rate
- 6.79%
- Cash-on-cash
- 1.78%
- DSCR
- 1.08
- GRM
- 10.3
CMA / ARV
- ARV (on-the-fly)
- $215,512
- Comps found
- 12
Show comp detail 12 sales within ~0.75 mi
| Address | Dist | Beds/Ba | Sqft | Sold | Price | $/sf | Match |
|---|---|---|---|---|---|---|---|
| 300 Roland Ave | 0.00mi | 3/2.5 | 1,738 (0%) | 1mo | $215,000 | $124 | 93 |
| 159 N Lake Dr | 0.11mi | 3/2.0 | 1,896 (+9%) | 8mo | $325,000 | $171 | 69 |
| 400 W Grand St | 0.41mi | 3/1.5 | 1,792 (+3%) | 7mo | $92,500 | $52 | 68 |
| 907 Lambuth Blvd | 0.50mi | 3/1.0 | 1,715 (-1%) | 10mo | $204,000 | $119 | 66 |
| 161 W Grand St | 0.36mi | 4/3.0 (+1) | 1,780 (+2%) | 1mo | $255,000 | $143 | 66 |
| 568 Westmoreland Pl | 0.63mi | 3/2.0 | 1,727 (-1%) | 2mo | $240,000 | $139 | 64 |
| 415 Division Ave | 0.34mi | 2/2.0 (-1) | 1,614 (-7%) | 1mo | $194,500 | $121 | 62 |
| 1044 Campbell St | 0.49mi | 3/1.0 | 1,836 (+6%) | 10mo | $42,000 | $23 | 59 |
| 145 Arlington Ave | 0.43mi | 4/2.5 (+1) | 1,859 (+7%) | 6mo | $260,000 | $140 | 52 |
| 402 Fairmont Ave | 0.59mi | 3/1.0 | 1,528 (-12%) | 4mo | $79,000 | $52 | 49 |
| 517 Wisdom St | 0.38mi | 4/2.0 (+1) | 1,926 (+11%) | 8mo | $251,900 | $131 | 48 |
| 1116 Campbell St | 0.74mi | 4/2.0 (+1) | 1,858 (+7%) | 8mo | $224,900 | $121 | 38 |
Match score weights: distance 35% · size 25% · config 20% · recency 20%. Top-matched comps best support the ARV.
Projected returns pro-forma
-3.0% appreciation · 5.19% rent growth · sell at horizon
- IRR
- -11.4%
- Equity multiple
- 0.58×
- Total profit
- $-25,329
- Equity at exit
- $32,057
- IRR
- 0.4%
- Equity multiple
- 1.03×
- Total profit
- $1,690
- Equity at exit
- $18,589
Cash invested: $60,200 (down + closing). Projections, not guarantees.
Landlord ↔ Tenant lean methodology
- Overall (STATE)
- 87 Strongly Landlord-Friendly
- State Tennessee
- 87 Strongly Landlord-Friendly · R+13
- County
- — inherits STATE
- City
- — inherits STATE
ZIP-level market 38301
- Rents YoY
- 5.2%
- Active inventory
- 255
- Price-to-rent
- 10.3×
Monthly cashflow live
- Estimated rent
- $1,740 medium interval (Pro) →
- Mortgage (P&I)
- −$1,127
- Tax from tax record
- −$68 /mo · $820/yr
- Insurance
- −$90
- HOA
- −$0
- Vacancy / Maint / Mgmt
- −$365
- Net cashflow
- $89
Break-even live
Sensitivity live
| Price | -10% $211 | -5% $150 | +0% $89 | +5% $28 | +10% $-32 |
|---|---|---|---|---|---|
| Rent | -10% $-48 | -5% $21 | +0% $89 | +5% $158 | +10% $227 |
| Rate | -1.0pp $198 | -0.5pp $144 | base $89 | +0.5pp $34 | +1.0pp $-23 |
UW: 25.0% down · 7.5% · 30yr · 1.5% tax · 5.0% vac · 8.0% maint · 8.0% mgmt
Financing live
Cash to close
- Down payment
- $53,750
- Closing costs
- $6,450
- Reserves months
- —
- Total cash needed
- —
Loan-product check · same deal, 3 products live
Conventional
25% down · 7.5% · 30yr
- Down + closing
- —
- Monthly P&I
- —
- Monthly cashflow
- —
- DSCR
- —
- Eligible?
- —
Personal DTI + credit; lowest rate.
DSCR
20% down · 8.5% · 30yr
- Down + closing
- —
- Monthly P&I
- —
- Monthly cashflow
- —
- DSCR
- —
- Eligible?
- —
No personal income docs; deal must DSCR.
Hard money
10% down · 12.0% · 12mo
- Down + closing
- —
- Monthly P&I
- —
- Monthly cashflow
- —
- DSCR
- —
- Eligible?
- —
Short-term bridge; refi at stabilization.
Rent comps 1 comps
| Address | Beds | Baths | Sqft | Rent | $/sqft | DOM | Units | Dist |
|---|---|---|---|---|---|---|---|---|
| 102 Jackson Walk Plz Jackson, TN | 1.0–3.0 | 1.0–2.5 | 1082 | $2,600 | $2.40 | 45d | 1 | 1.10mi |
Listing history 3 events
-
2026-05-07status Pending
-
2026-04-25$215,000 Active
-
1999-06-04soldstatus $70,000
ⓘ Source: listings_history table (triggers on properties + properties_extension) + one-shot
backfill from property_details.listing_events for pre-trigger history.
Tax reassessment forecast TN · Resets to sale price
- Current annual tax
- $820 · $68/mo
- Projected year-2 tax
- $1,526 · $127/mo
- Expected delta
- +$706/yr (+$59/mo · 86.2%)
ⓘ Screening estimate from a state-policy table — verify with the county assessor before closing.
Climate risk First Street
- Flood 1/10 Low FEMA zone X (unshaded) · 0% chance over 30 yrs
- Wildfire 1/10 Low
- Heat 6/10 Major 7 d/yr ≥108°F today · 20 d/yr by 30 yrs out
- Wind 4/10 Moderate 16% chance of damaging wind over 30 yrs
- Air quality 1/10 Low 0 unhealthy d/yr today · 0 by 30 yrs out
Nearby sold comps map
Loading sold comps map…
Walkable amenities ~0.75 mi
Loading nearby amenities…
Taxation est. · year 1
- Rental income
- $20,882
- − Mortgage interest
- −$12,043
- − Property taxes
- −$820
- − Insurance
- −$1,075
- − Repairs & maintenance
- −$1,671
- − Management
- −$1,671
- − Depreciation
- −$6,255
- Taxable loss
- −$2,652
- Est. tax savings @ 24.0%
- +$637
- After-tax cash flow
- $1,708/yr
For passive investors: Depreciation is non-cash, so a rental often shows a tax loss while cash-flowing — sheltering income. Rental losses are passive: they offset passive income freely, and up to $25,000/yr can offset ordinary (W-2) income if you actively participate and your MAGI is under $100k (phasing out to $0 by $150k); unused losses carry forward. On sale, claimed depreciation is recaptured at up to 25%, and gains may owe capital-gains tax (a 1031 exchange can defer both). Figures are a year-1 estimate at your 24.0% rate — not tax advice; consult a CPA.
Schools (NCES district)
- District
- Madison County
- NCES district ID
- 4702580
- Math proficiency
- 10% ▼ -11.00%
- Reading proficiency
- 17% ▼ -4.00%
- Median HH income
- $42,015
- Composite
- 11.74/100
- National rank
- #9687
- State rank
- #131 of 139 in TN
Livability — Jackson
- Score
- 62/100
- State rank
- #216
- US rank
- #16488
Category grades
Schools grade is shown separately in the Schools card above.
Census & demographics
- Census place
- Jackson, TN
- County
- Madison County · 87,024 people
- City population
- 87,024
- Metro
- Jackson, TN
- Population (ZIP)
- 33,536
- Household income
- $43,227
- Rent vs Own
- Severe rent burden
- 1701.0
Population outlook (Madison County) Hauer SSP2
- Today (2025)
- 95,952 people
- By 2030
- 94,264 · -1.8%
- By 2040
- 89,607 · -6.6%
- By 2050
- 84,133 · -12.3%
- By 2075
- 72,215 · -24.7%
- By 2100
- 62,062 · -35.3%
Race, ethnicity, and origin ACS 2023
- Neighborhood character
- Diverse neighborhood (Simpson 0.57)
- Race & ethnicity
- Black 50% White 42% Two or more races 5% Hispanic / Latino 4%
- Common ancestry
- Slovak 1% Serbian 1% Portuguese 1%
- Foreign-born
- 3% · Canada
- Languages at home
- 96% English-only · Spanish 3%
Political lean MEDSL · Madison
- 2024 margin
- R (+18.2) · D 40.3% · R 58.5% · Other 1.2%
- 2008→2024 swing
- +3.4pp toward D · 2008: -21.6pp · 2024: -18.2pp
- All cycles
- 2024: R+18.2 2020: R+12.9 2016: R+15.6 2012: R+8.9 2008: R+21.6
Not yet ingested
- Civics
- —
Market trends
- HPI YoY
- ▼ -112.26%
- Current HPI
- 162.2273
- Rent YoY
- ▲ 5.19%
- Metro
- Jackson, TN
- State GDP YoY
- ▲ 2.78%
- F500 in state
- 22
Industry mix (Fortune 500 HQ in TN)
| Industry | F500 HQs | Revenue |
|---|---|---|
| Healthcare | 3 | $91B |
|
||
| Retail | 3 | $72B |
|
||
| Transportation / Logistics | 1 | $88B |
|
||
| Paper / Packaging | 1 | $19B |
|
||
| Insurance | 1 | $13B |
|
||
| Energy | 1 | $12B |
|
||
Price history
+207.1% since first listed3 events — show timeline
- 2026-05-07 Pending — CWTAR
- 2026-04-25 Listed $215,000 CWTAR
- 1999-06-04 Sold (Public Records) $70,000 Public Records
Property tax history
+3.2%/yrLatest (2025): $820 · +0.0% YoY. Source: county tax records.
Cash-flow waterfall
monthlySold comps — $/sqft
last 12 mo · ≤1 miLoading sold comps…