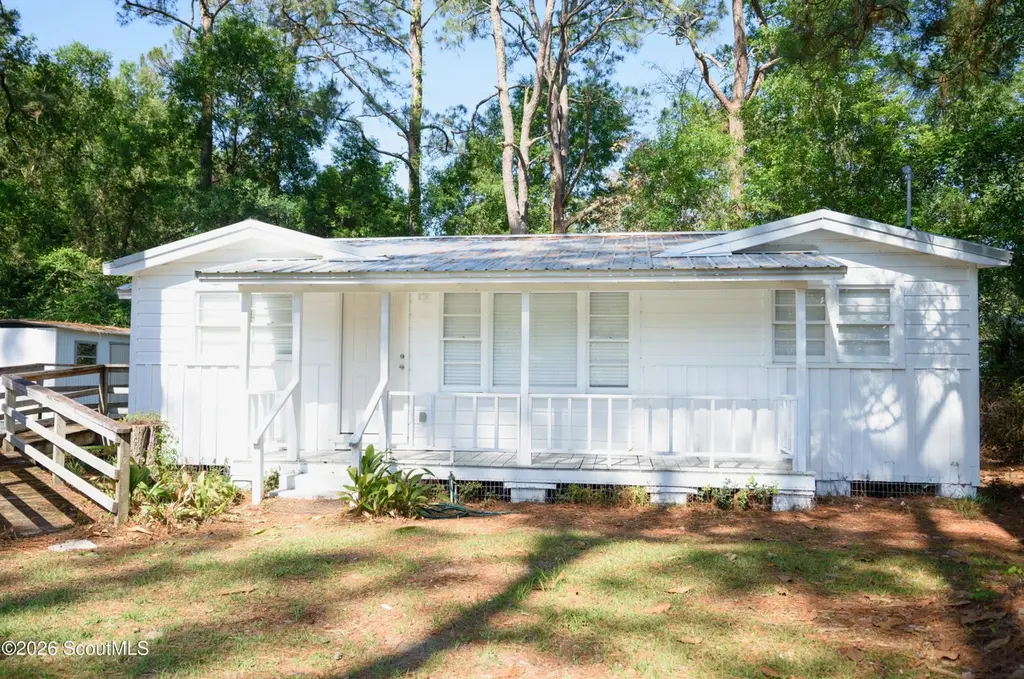
2920 S Lakeview Dr · Waycross, GA
Flood risk 1/10 · Minimal
- FEMA flood zone
- X (unshaded)
- Chance of flooding over 30 yrs
- 0.0%
- Est. flood insurance / yr
- $473 – $860
Fire risk 8/10 · Major
- Est. fire insurance / yr
- $963 – $1,789
Heat risk 8/10 · Major
- Hot days now (above 108°F)
- 7 days/yr
- Hot days in 30 yrs
- 20 days/yr
Wind risk 8/10 · Major
- Chance of severe wind over 30 yrs
- 99.0%
Air-quality risk 6/10 · Moderate
- Unhealthy air days now
- 11 days/yr
- Unhealthy air days in 30 yrs
- 11 days/yr
Risk factors via First Street. Map © Google.
Why this score? — see what drove the D grade
The composite is a weighted blend of 9 inputs, each scored 0–100. Each bar is that input's sub-score; the figure is the points it added to the 100-point composite (weight × sub-score).
- Cash flow +15.6/30.0
- ARV discount +7.5/15.0
- DSCR +4.8/10.0
- 1% rule +3.3/10.0
- Livability +2.8/5.0
- Schools +2.6/10.0
- Rent growth +2.5/5.0
- Condition / age +2.5/5.0
- Appreciation +0.0/10.0
$125,000
🖨 Deal sheet 📄 Offer letter ✓ Due diligence
Listing remarks
Completely renovated and move-in ready! This charming 2 bedroom, 1 bathroom home sits on approximately . 75 acres in Waycross and has been extensively updated from top to bottom. Recent improvements include a metal roof and HVAC system, electrical, plumbing, septic (2021), along with new flooring and doors completed in 2026. The home also features a wheelchair ramp, storage shed, and two water meters with one serving as a backup. Currently being used as a rental property, this home would make a great investment opportunity, starter home, or downsizing option. With major systems already updated, this is a low-maintenance property with tons of value packed into it!
Key facts
- Metal roof
- Storage shed
- Wheelchair ramp
Tags
Property features AI
Exterior
- Utilities: Well water
- Home design: Single-story home; Metal roof
- Construction: Built on a lot of 0.75 acres
- Exterior features: Storage structure on the property; Wooded lot; Asphalt road access
Interior
- Bedrooms: 2 main-level bedrooms
- Bathrooms: 1 full bathroom
- Interior features: 6 total rooms
Neighborhood map
What this means for you Summary
Snapshot
- This is a 2-bed/1.0-bath single-family listed at $125k.
Deal economics
- At list price, monthly cash flow is $53 ($640/yr) — positive.
- The deal already cash-flows at list — no discount required.
- To meet the 1% rule (rent ≥ 1% of price), the offer needs to be $104k (16.8% below list).
- Recommended offer: $104k (16.8% below list) — sets the bar for 1% rule.
- Cap rate 6.8% vs local median 5.1% in Waycross — top-decile yield for the area; either an underpriced asset or a hidden risk that comps aren't pricing in. Stress-test before assuming the spread holds.
Location & tenants
- Location reads 55/100 on livability (#519 in GA) — a working-class tenant base; expect higher turnover. Strengths: cost of living A+, housing A+; Watch: health & safety C-, schools D-, crime F.
- Ware County (town): math 27% / reading 35% proficiency, ranked #95 of 174 in GA (top 55%) — families likely to look elsewhere, expect single-tenant / working-renter base with shorter leases; 64% free/reduced lunch — lower-income household profile, screen leases tightly.
- Market conditions: 143 active listings in the ZIP; 45 units permitted in Ware County in 2024 (0 in 5+ unit buildings).
Forward outlook
- Local home prices are declining (-3.0%/yr); year-one equity from $864 of loan paydown is wiped out by about $4k of value loss. Plan a longer hold.
- Ware County population projected at -18% by 2050 — secular population decline; favor cash flow + early exit over multi-decade hold.
Negotiation context
- It's been on market 29 days — a 2% lower offer ($123k) is reasonable based on typical stale-listing flexibility.
Risks & watch-outs
- Watch-outs: built in 1955 — expect roof / HVAC / electrical / plumbing capex.
- Climate carrying-cost: severe wind risk, 99% chance of damaging wind over 30y; severe wildfire risk; extreme-heat days projected 7→20/yr by 2055 (HVAC capex compounding) — expect insurance premiums to compound above CPI over the hold.
Questions for the listing agent
- Built in 1955 — when were the roof, HVAC, electrical panel, plumbing, and water heater last replaced?
- Is there a deadline driving the sale (1031 exchange, divorce, estate, relocation)? That informs how much negotiation room exists.
- Schools are D-rated, which usually means shorter tenancies and higher turnover. Who's the typical renter profile here, and what's been the actual vacancy rate?
- Crime grade is F in this area — have there been break-ins, vandalism, or insurance claims at this property in the last 3 years? What carrier currently insures it and at what premium?
- The area grade is low — what's the realistic commute time and amenity access for the typical tenant pool here? Any planned neighborhood developments (good or bad) we should know about?
- What's the average days-on-market for RENTAL listings here right now (not sales)? A rising rental-DOM trend means longer vacancies and softer asking-rent achievability than the comps imply.
- What's the recent tenant-quality profile in this submarket — average credit score on applications, eviction rate, late-payment / NSF rate, and stable-employment percentage? A property-management company in the area should have these aggregated.
- How much new for-sale + rental construction is in the pipeline within 1–3 miles? Heavy new supply typically softens prices + rents 12–24 months out; constrained supply supports both.
Investment metrics
- 1% rule
- 0.83% ✗
- Cap rate
- 6.81%
- Cash-on-cash
- 1.83%
- DSCR
- 1.08
- GRM
- 10.0
CMA / ARV
No comps found within radius.
Projected returns pro-forma
-3.0% appreciation · 3.0% rent growth · sell at horizon
- IRR
- -13.4%
- Equity multiple
- 0.52×
- Total profit
- $-16,901
- Equity at exit
- $18,638
- IRR
- -4.6%
- Equity multiple
- 0.70×
- Total profit
- $-10,518
- Equity at exit
- $10,808
Cash invested: $35,000 (down + closing). Projections, not guarantees.
Landlord ↔ Tenant lean methodology
- Overall (STATE)
- 90 Strongly Landlord-Friendly
- State Georgia
- 90 Strongly Landlord-Friendly · R+3
- County
- — inherits STATE
- City
- — inherits STATE
ZIP-level market 31503
- Home prices YoY
- -24.9%
- Active inventory
- 143
- Price-to-rent
- 10.0×
Monthly cashflow live
- Estimated rent
- $1,040 medium interval (Pro) →
- Mortgage (P&I)
- −$656
- Tax from tax record
- −$60 /mo · $726/yr
- Insurance
- −$52
- HOA
- −$0
- Vacancy / Maint / Mgmt
- −$218
- Net cashflow
- $53
Break-even live
UW: 25.0% down · 7.5% · 30yr · 1.5% tax · 5.0% vac · 8.0% maint · 8.0% mgmt
Financing live
Cash to close
- Down payment
- $31,250
- Closing costs
- $3,750
- Reserves months
- —
- Total cash needed
- —
Loan-product check · same deal, 3 products live
Conventional
25% down · 7.5% · 30yr
- Down + closing
- —
- Monthly P&I
- —
- Monthly cashflow
- —
- DSCR
- —
- Eligible?
- —
Personal DTI + credit; lowest rate.
DSCR
20% down · 8.5% · 30yr
- Down + closing
- —
- Monthly P&I
- —
- Monthly cashflow
- —
- DSCR
- —
- Eligible?
- —
No personal income docs; deal must DSCR.
Hard money
10% down · 12.0% · 12mo
- Down + closing
- —
- Monthly P&I
- —
- Monthly cashflow
- —
- DSCR
- —
- Eligible?
- —
Short-term bridge; refi at stabilization.
Listing history 15 events
-
2026-06-18days on market $125,000 Active 29 DOM
-
2026-06-17days on market $125,000 Active 28 DOM
-
2026-06-16days on market $125,000 Active 27 DOM
-
2026-06-15days on market $125,000 Active 26 DOM
-
2026-06-13days on market $125,000 Active 24 DOM
-
2026-06-12days on market $125,000 Active 23 DOM
-
2026-06-09pricedays on market $125,000 Active 20 DOM
-
2026-06-08days on market $128,000 Active 19 DOM
-
2026-06-07days on market $128,000 Active 18 DOM
-
2026-06-04days on market $128,000 Active 14 DOM
-
2026-06-02days on market $128,000 Active 13 DOM
-
2026-06-01days on market $128,000 Active 12 DOM
-
2026-05-31days on market $128,000 Active 11 DOM
-
2026-05-31days on market $128,000 Active 10 DOM
-
2026-05-19$128,000 Active
ⓘ Source: listings_history table (triggers on properties + properties_extension) + one-shot
backfill from property_details.listing_events for pre-trigger history.
Tax reassessment forecast GA · Resets to sale price
- Current annual tax
- $726 · $60/mo
- Projected year-2 tax
- $1,150 · $96/mo
- Expected delta
- +$424/yr (+$35/mo · 58.5%)
ⓘ Screening estimate from a state-policy table — verify with the county assessor before closing.
Climate risk First Street
- Flood 1/10 Low FEMA zone X (unshaded) · 0% chance over 30 yrs
- Wildfire 8/10 Severe
- Heat 8/10 Severe 7 d/yr ≥108°F today · 20 d/yr by 30 yrs out
- Wind 8/10 Severe 99% chance of damaging wind over 30 yrs
- Air quality 6/10 Major 11 unhealthy d/yr today · 11 by 30 yrs out
Nearby sold comps map
Loading sold comps map…
Walkable amenities ~0.75 mi
Loading nearby amenities…
Taxation est. · year 1
- Rental income
- $12,477
- − Mortgage interest
- −$7,002
- − Property taxes
- −$726
- − Insurance
- −$625
- − Repairs & maintenance
- −$998
- − Management
- −$998
- − Depreciation
- −$3,636
- Taxable loss
- −$1,508
- Est. tax savings @ 24.0%
- +$362
- After-tax cash flow
- $1,002/yr
For passive investors: Depreciation is non-cash, so a rental often shows a tax loss while cash-flowing — sheltering income. Rental losses are passive: they offset passive income freely, and up to $25,000/yr can offset ordinary (W-2) income if you actively participate and your MAGI is under $100k (phasing out to $0 by $150k); unused losses carry forward. On sale, claimed depreciation is recaptured at up to 25%, and gains may owe capital-gains tax (a 1031 exchange can defer both). Figures are a year-1 estimate at your 24.0% rate — not tax advice; consult a CPA.
Schools (NCES district)
- District
- Ware County
- NCES district ID
- 1305430
- Math proficiency
- 27% ▼ -18.00%
- Reading proficiency
- 35% ▼ -12.00%
- Median HH income
- $35,231
- Composite
- 25.6/100
- National rank
- #7415
- State rank
- #95 of 174 in GA
Livability — Waycross
- Score
- 55/100
- State rank
- #519
- US rank
- #23458
Category grades
Schools grade is shown separately in the Schools card above.
Census & demographics
- City population
- 36,207
- Population (ZIP)
- 23,173
Population outlook (Ware County) Hauer SSP2
- Today (2025)
- 33,313 people
- By 2030
- 32,071 · -3.7%
- By 2040
- 29,587 · -11.2%
- By 2050
- 27,197 · -18.4%
- By 2075
- 22,323 · -33.0%
- By 2100
- 18,197 · -45.4%
Race, ethnicity, and origin ACS 2023
- Neighborhood character
- Predominantly White (68%)
- Race & ethnicity
- White 68% Black 21% Hispanic / Latino 7% Two or more races 6% Asian 2%
- Hispanic origin (detail)
- Mexican 3%
- Common ancestry
- Italian 1% Serbian 1% Slovak 1%
- Foreign-born
- 4% · Canada, Philippines
- Languages at home
- 94% English-only · Spanish 4% Other Indo-European 1% Other Asian/Pacific 1%
Political lean MEDSL · Ware
- 2024 margin
- Solid R (+43.1) · D 28.3% · R 71.4%
- 2008→2024 swing
- -8.7pp toward R · 2008: -34.5pp · 2024: -43.1pp
- All cycles
- 2024: R+43.1 2020: R+40.4 2016: R+41.7 2012: R+33.9 2008: R+34.5
Not yet ingested
- Civics
- —
Market trends
- HPI YoY
- ▼ -76.44%
- Current HPI
- 230.6527
- Rent YoY
- —
- Metro
- —
- State GDP YoY
- ▲ 2.66%
- F500 in state
- 28
Industry mix (Fortune 500 HQ in GA)
| Industry | F500 HQs | Revenue |
|---|---|---|
| Paper / Packaging | 2 | $29B |
|
||
| Retail | 1 | $160B |
|
||
| Transportation / Logistics | 1 | $91B |
|
||
| Airlines | 1 | $62B |
|
||
| Consumer Goods | 1 | $47B |
|
||
| Utilities | 1 | $25B |
|
||
Price history
1 event — show timeline
- 2026-05-19 Listed $128,000 GIAR
Property tax history
+8.5%/yrLatest (2025): $726 · -2.0% YoY. Source: county tax records.
Cash-flow waterfall
monthlySold comps — $/sqft
last 12 mo · ≤1 miLoading sold comps…