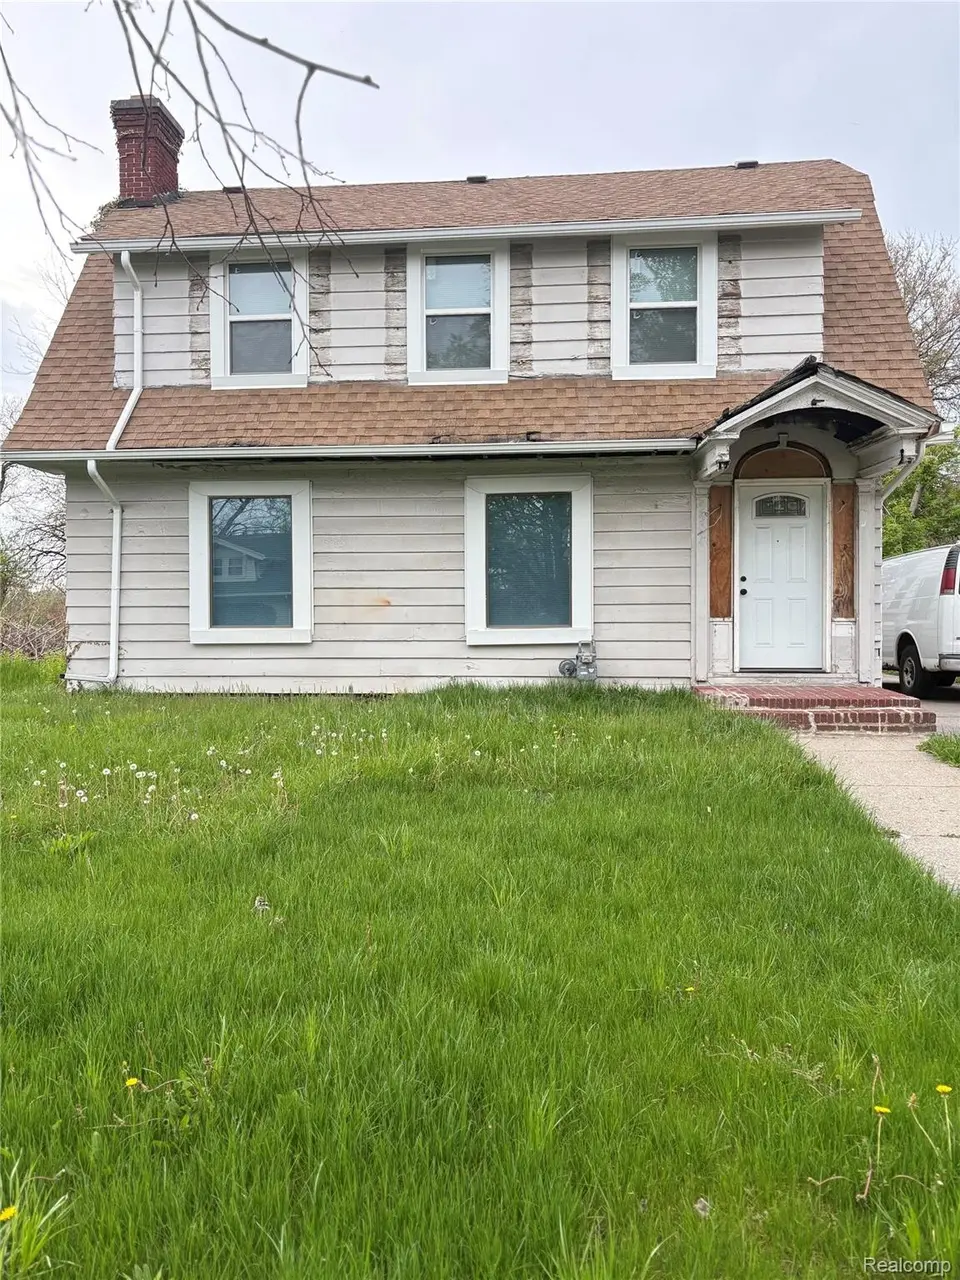
5594 Greenway St · Detroit, MI
Flood risk 1/10 · Minimal
- FEMA flood zone
- X (unshaded)
- Chance of flooding over 30 yrs
- 0.0%
- Est. flood insurance / yr
- $473 – $860
Fire risk 1/10 · Minimal
- Est. fire insurance / yr
- $784 – $1,456
Heat risk 3/10 · Minor
- Hot days now (above 97°F)
- 7 days/yr
- Hot days in 30 yrs
- 15 days/yr
Wind risk 2/10 · Minimal
- Chance of severe wind over 30 yrs
- —
Air-quality risk 4/10 · Minor
- Unhealthy air days now
- 4 days/yr
- Unhealthy air days in 30 yrs
- 6 days/yr
Risk factors via First Street. Map © Google.
Why this score? — see what drove the B+ grade
The composite is a weighted blend of 9 inputs, each scored 0–100. Each bar is that input's sub-score; the figure is the points it added to the 100-point composite (weight × sub-score).
- Cash flow +30.0/30.0
- DSCR +10.0/10.0
- Appreciation +10.0/10.0
- 1% rule +8.6/10.0
- ARV discount +7.5/15.0
- Livability +3.7/5.0
- Rent growth +2.5/5.0
- Condition / age +2.5/5.0
- Schools +1.3/10.0
$90,000
🖨 Deal sheet (PDF) 📄 Offer letter ✓ Due diligence
Listing remarks MLS
Beautifully updated property offering modern finishes and move-in-ready appeal. Recent improvements enhance both functionality and style, making this home a great option for homeowners or investors alike. Features include refreshed interiors, and a layout designed for comfortable living. Conveniently located near major roads, schools, and local amenities. Schedule your showing today and bring your best offer - this one won't last.
Key facts
- Updated property
- Modern finishes
- Refreshed interiors
Tags
Neighborhood map
What this means for you Summary
Snapshot
- This is a 3-bed/1.0-bath single-family listed at $90k.
Deal economics
- At list price, monthly cash flow is $388 ($5k/yr) — positive.
- The deal already cash-flows at list — no discount required.
- Meets the 1% rule at list price ($1k rent vs $90k).
- Recommended offer: $79k (12.0% below list) — sets the bar for market timing.
Location & tenants
- Location reads 73/100 on livability (#218 in MI) — a middle-class / working-renter tenant base. Strengths: amenities A+, commute A+, cost of living A+; Watch: schools F, crime F, employment F.
- Detroit Public Schools Community District (urban): math 10% / reading 24% proficiency, ranked #499 of 540 in MI (top 92%) — low school quality limits family demand, transient renter base, plan for 1-2y turnover; 90% free/reduced lunch — lower-income household profile, screen leases tightly.
- Market conditions: 248 active listings in the ZIP; 38 comparable units currently listed for rent nearby; rentals at typical pace (median 26d on market — plan ~3-4 weeks tenant-placement turnaround); lower-income renter base — watch delinquency; 2,639 units permitted in Wayne County in 2024 (1,216 in 5+ unit buildings).
- This rent runs 43% of the median local income ($34k/yr) — at the standard rent-burdened threshold; future hikes will face affordability resistance.
Forward outlook
- In year one you build about $10k of equity ($622 loan paydown + $9k appreciation (10.0% local appreciation)).
- Wayne County population projected at -17% by 2050 — secular population decline; favor cash flow + early exit over multi-decade hold.
- At projected returns (10.0% appreciation + 3.0% rent growth), your $25k cash investment doubles in ~2 years — after that, you're playing with house money.
- By year 4, paydown + projected appreciation supports a ~$34k cash-out refi (75% LTV) — recoverable capital for the next deal without selling this one.
Negotiation context
- It's been on market 133 days — a 12% lower offer ($79k) is reasonable based on typical stale-listing flexibility.
- 6 sale attempts since 26y ago; this cycle's ask has dropped $30k (25%) from the opening price — seller is motivated, your offer sets the floor, not the list.
- Current owner paid $4k; list at $90k implies a 2258% gain — meaningful room to come down on a strong offer.
Risks & watch-outs
- Watch-outs: built in 1922 — expect roof / HVAC / electrical / plumbing capex.
Questions for the listing agent
- It's been on market 133 days. Have you received any prior offers? Is the seller open to a 12% concession, seller financing, or rate buy-down credit?
- Built in 1922 — when were the roof, HVAC, electrical panel, plumbing, and water heater last replaced?
- Why hasn't it sold? Are there any deal-killer items the seller is aware of (foundation, flood, title, zoning, code violations)?
- Is there a deadline driving the sale (1031 exchange, divorce, estate, relocation)? That informs how much negotiation room exists.
- Schools are F-rated, which usually means shorter tenancies and higher turnover. Who's the typical renter profile here, and what's been the actual vacancy rate?
- Crime grade is F in this area — have there been break-ins, vandalism, or insurance claims at this property in the last 3 years? What carrier currently insures it and at what premium?
- What's the average days-on-market for RENTAL listings here right now (not sales)? A rising rental-DOM trend means longer vacancies and softer asking-rent achievability than the comps imply.
- What's the recent tenant-quality profile in this submarket — average credit score on applications, eviction rate, late-payment / NSF rate, and stable-employment percentage? A property-management company in the area should have these aggregated.
- How much new for-sale + rental construction is in the pipeline within 1–3 miles? Heavy new supply typically softens prices + rents 12–24 months out; constrained supply supports both.
Investment metrics
- 1% rule
- 1.36% ✓
- Cap rate
- 11.46%
- Cash-on-cash
- 18.45%
- DSCR
- 1.82
- GRM
- 6.1
CMA / ARV
- ARV (median comp)
- $42,955
- List price
- $90,000
- Delta
- 109.52%
- Verdict
- OVERPRICED
- Comps
- 20 within 1.0 mi
Show comp detail 12 sales within ~0.75 mi
| Address | Dist | Beds/Ba | Sqft | Sold | Price | $/sf | Match |
|---|---|---|---|---|---|---|---|
| 5640 Underwood Ave | 0.08mi | 3/1.0 | 1,450 (-2%) | 2mo | $65,000 | $45 | 91 |
| 9539 Beechwood St St | 0.25mi | 3/1.0 | 1,440 (-3%) | 2mo | $36,000 | $25 | 82 |
| 5125 Whitfield St | 0.19mi | 4/2.0 (+1) | 1,530 (+3%) | 2mo | $136,800 | $89 | 75 |
| 9414 American St | 0.41mi | 2/1.0 (-1) | 1,476 (-0%) | 8mo | $17,000 | $12 | 68 |
| 5535 Vancouver St | 0.63mi | 3/1.0 | 1,440 (-3%) | 3mo | $110,000 | $76 | 64 |
| 10163 Monica St | 0.73mi | 3/1.0 | 1,486 (+0%) | 8mo | $46,000 | $31 | 59 |
| 5260 Spokane St | 0.58mi | 2/1.0 (-1) | 1,438 (-3%) | 7mo | $12,250 | $9 | 58 |
| 5250 Vancouver St | 0.68mi | 4/2.0 (+1) | 1,450 (-2%) | 1mo | $151,000 | $104 | 54 |
| 5357 Spokane Ave | 0.55mi | 3/1.5 | 1,288 (-13%) | 6mo | $47,997 | $37 | 46 |
| 5297 Vancouver St | 0.68mi | 4/1.5 (+1) | 1,363 (-8%) | 4mo | $60,000 | $44 | 44 |
| 5327 Vancouver St | 0.67mi | 3/1.0 | 1,274 (-14%) | 5mo | $40,000 | $31 | 41 |
| 8127 American St | 0.67mi | 4/1.0 (+1) | 1,317 (-11%) | 8mo | $29,000 | $22 | 39 |
Match score weights: distance 35% · size 25% · config 20% · recency 20%. Top-matched comps best support the ARV.
Projected returns pro-forma
10.0% appreciation · 3.0% rent growth · sell at horizon
- IRR
- 38.0%
- Equity multiple
- 3.92×
- Total profit
- $73,691
- Equity at exit
- $81,079
- IRR
- 32.7%
- Equity multiple
- 8.84×
- Total profit
- $197,584
- Equity at exit
- $174,850
Cash invested: $25,200 (down + closing). Projections, not guarantees.
Landlord ↔ Tenant lean methodology
- Overall (STATE)
- 62 Landlord-Friendly
- State Michigan
- 62 Landlord-Friendly · EVEN
- County
- — inherits STATE
- City
- — inherits STATE
ZIP-level market 48204
- Home prices YoY
- 18.5%
- Active inventory
- 248
- Price-to-rent
- 6.1×
Monthly cashflow live
- Estimated rent
- $1,225 high interval (Pro) →
- Mortgage (P&I)
- −$472
- Tax from tax record
- −$71 /mo · $854/yr
- Insurance
- −$38
- HOA
- −$0
- Vacancy / Maint / Mgmt
- −$257
- Net cashflow
- $388
Break-even live
Sensitivity live
| Price | -10% $438 | -5% $413 | +0% $388 | +5% $362 | +10% $337 |
|---|---|---|---|---|---|
| Rent | -10% $291 | -5% $339 | +0% $388 | +5% $436 | +10% $484 |
| Rate | -1.0pp $433 | -0.5pp $410 | base $388 | +0.5pp $364 | +1.0pp $340 |
UW: 25.0% down · 7.5% · 30yr · 1.5% tax · 5.0% vac · 8.0% maint · 8.0% mgmt
Financing live
Cash to close
- Down payment
- $22,500
- Closing costs
- $2,700
- Reserves months
- —
- Total cash needed
- —
Loan-product check · same deal, 3 products live
Conventional
25% down · 7.5% · 30yr
- Down + closing
- —
- Monthly P&I
- —
- Monthly cashflow
- —
- DSCR
- —
- Eligible?
- —
Personal DTI + credit; lowest rate.
DSCR
20% down · 8.5% · 30yr
- Down + closing
- —
- Monthly P&I
- —
- Monthly cashflow
- —
- DSCR
- —
- Eligible?
- —
No personal income docs; deal must DSCR.
Hard money
10% down · 12.0% · 12mo
- Down + closing
- —
- Monthly P&I
- —
- Monthly cashflow
- —
- DSCR
- —
- Eligible?
- —
Short-term bridge; refi at stabilization.
Rent comps 38 comps
| Address | Beds | Baths | Sqft | Rent | $/sqft | DOM | Units | Dist |
|---|---|---|---|---|---|---|---|---|
| 8762 Epworth St Unit 8768 Detroit, MI | 2.0 | 1.0 | 900 | $995 | $1.11 | 0d | 1 | 0.18mi |
| 8353 Alpine St Detroit, MI | 2.0 | 1.0 | 1000 | $1,050 | $1.05 | 45d | 1 | 0.67mi |
| 4915 Maplewood St Detroit, MI | 3.0 | 1.0 | 1324 | $1,100 | $0.83 | 18d | 1 | 0.72mi |
| 9022 Northlawn St Detroit, MI | 2.0 | 1.0 | 1100 | $1,300 | $1.18 | 26d | 1 | 0.76mi |
| 5101 Oregon St Detroit, MI | 2.0 | 1.0 | 1000 | $1,049 | $1.05 | 45d | 1 | 0.78mi |
| 5398 Allendale St Detroit, MI | 2.0 | 1.0 | 1100 | $1,200 | $1.09 | 25d | 1 | 0.79mi |
| 8320 Northlawn St Detroit, MI | 3.0 | 1.0 | 1737 | $1,550 | $0.89 | 22d | 1 | 0.86mi |
| 8230 Ohio St Detroit, MI | 3.0 | 1.0 | 1350 | $1,200 | $0.89 | 18d | 1 | 0.94mi |
| 4345 W Euclid St Unit 2 Detroit, MI | 3.0 | 1.0 | 1300 | $1,450 | $1.12 | 26d | 1 | 0.95mi |
| 4345 W Euclid St Unit 1 Detroit, MI | 3.0 | 1.0 | 1300 | $1,400 | $1.08 | 26d | 1 | 0.95mi |
| 12019 Stoepel St Detroit, MI | 2.0 | 1.0 | 1000 | $943 | $0.94 | 6d | 1 | 1.01mi |
| 7424 Wykes St Detroit, MI | 3.0 | 1.0 | 1200 | $1,100 | $0.92 | 45d | 1 | 1.02mi |
| 12032 Santa Rosa Dr Unit 1 Detroit, MI | 3.0 | 1.0 | 900 | $1,278 | $1.42 | 0d | 1 | 1.03mi |
| 4566 Seebaldt St Detroit, MI | 2.0 | 1.0 | 1200 | $1,250 | $1.04 | 23d | 1 | 1.04mi |
| 8143 Wisconsin St Detroit, MI | 4.0 | 1.0 | 1370 | $1,800 | $1.31 | 0d | 1 | 1.05mi |
| 3786 Carter St Unit 2 Detroit, MI | 3.0 | 1.0 | 1400 | $1,100 | $0.79 | 26d | 1 | 1.06mi |
| 11704 Broadstreet Ave Detroit, MI | 3.0 | 1.0 | 1200 | $1,050 | $0.88 | 45d | 1 | 1.07mi |
| 3759 Atkinson St Unit 2 Detroit, MI | 2.0 | 1.0 | 919 | $1,200 | $1.31 | 26d | 1 | 1.08mi |
| 3757 Blaine St Detroit, MI | 3.0 | 1.0 | 1169 | $1,480 | $1.27 | 18d | 1 | 1.11mi |
| 12123 Santa Rosa Dr Detroit, MI | 2.0 | 1.0 | 1680 | $1,000 | $0.60 | 26d | 1 | 1.12mi |
| 3422 Edison St Detroit, MI | 3.0 | 1.0 | 1300 | $1,295 | $1.00 | 18d | 1 | 1.24mi |
| 4016 Hogarth St Unit 4018 Hogarth Lower Detroit, MI | 2.0 | 1.0 | 1200 | $1,100 | $0.92 | 5d | 1 | 1.24mi |
| 6307 Woodrow St Detroit, MI | 2.0 | 1.0 | 1000 | $750 | $0.75 | 45d | 1 | 1.27mi |
| 3220 Gladstone St Detroit, MI | 3.0 | 1.0 | 1248 | $1,200 | $0.96 | 45d | 1 | 1.30mi |
| 10303 Morley St #1 Detroit, MI | 2.0 | 1.0 | 950 | $950 | $1.00 | 45d | 1 | 1.31mi |
| 3259 W Philadelphia St Detroit, MI | 3.0 | 1.0 | 1293 | $1,400 | $1.08 | 18d | 1 | 1.31mi |
| 12415 Monica St Detroit, MI | 2.0 | 1.0 | 1000 | $1,200 | $1.20 | 45d | 1 | 1.34mi |
| 4268 Cortland St Unit 1 Detroit, MI | 2.0 | 1.0 | 1000 | $1,050 | $1.05 | 45d | 1 | 1.37mi |
| 10359 Violetlawn St Unit 1 Detroit, MI | 2.0 | 1.0 | 1200 | $985 | $0.82 | 45d | 1 | 1.38mi |
| 3266 Calvert Ave Fl 2 Detroit, MI | 3.0 | 1.0 | 1279 | $1,300 | $1.02 | 26d | 1 | 1.38mi |
| 12663 Stoepel St Detroit, MI | 2.0 | 1.0 | 1100 | $1,050 | $0.95 | 23d | 1 | 1.40mi |
| 12303 Cloverlawn St Detroit, MI | 3.0 | 1.5 | 1454 | $1,400 | $0.96 | 45d | 1 | 1.41mi |
| 3226 Calvert Ave Detroit, MI | 3.0 | 1.0 | 1100 | $1,200 | $1.09 | 14d | 1 | 1.42mi |
| 3224 Calvert St Detroit, MI | 3.0 | 1.0 | 1150 | $1,150 | $1.00 | 45d | 1 | 1.42mi |
| 3322 Webb St Unit 1 Detroit, MI | 3.0 | 1.0 | 1656 | $1,350 | $0.82 | 45d | 1 | 1.45mi |
| 3322 Webb St Unit 2 Detroit, MI | 3.0 | 1.0 | 1656 | $1,350 | $0.82 | 45d | 1 | 1.45mi |
| 3322 Webb St Detroit, MI | 3.0 | 1.0 | 1600 | $1,250 | $0.78 | 18d | 1 | 1.45mi |
| 9209 Pinehurst St Detroit, MI | 3.0 | 1.0 | 1589 | $1,500 | $0.94 | 45d | 1 | 1.47mi |
Listing history 26 events
-
2026-06-21days on market $90,000 Active 133 DOM
-
2026-06-18days on market $90,000 Active 130 DOM
-
2026-06-17days on market $90,000 Active 129 DOM
-
2026-06-15days on market $90,000 Active 127 DOM
-
2026-06-13days on market $90,000 Active 125 DOM
-
2026-06-13days on market $90,000 Active 124 DOM
-
2026-06-09days on market $90,000 Active 121 DOM
-
2026-06-08days on market $90,000 Active 120 DOM
-
2026-06-07days on market $90,000 Active 119 DOM
-
2026-06-04days on market $90,000 Active 116 DOM
-
2026-06-03days on market $90,000 Active 115 DOM
-
2026-06-01days on market $90,000 Active 113 DOM
-
2026-05-31days on market $90,000 Active 112 DOM
-
2026-04-24price $90,000 434-char remark
Show marketing remark (444 chars)
Beautifully updated property offering modern finishes and move-in-ready appeal. Recent improvements enhance both functionality and style, making this home a great option for homeowners or investors alike. Features include refreshed interiors, and a layout designed for comfortable living. Conveniently located near major roads, schools, and local amenities. Schedule your showing today and bring your best offer—this one won’t last.
-
2026-04-24price $90,000 444-char remark
Show marketing remark (444 chars)
Beautifully updated property offering modern finishes and move-in-ready appeal. Recent improvements enhance both functionality and style, making this home a great option for homeowners or investors alike. Features include refreshed interiors, and a layout designed for comfortable living. Conveniently located near major roads, schools, and local amenities. Schedule your showing today and bring your best offer—this one won’t last.
-
2026-02-09$120,000 Active 444-char remark
Show marketing remark (444 chars)
Beautifully updated property offering modern finishes and move-in-ready appeal. Recent improvements enhance both functionality and style, making this home a great option for homeowners or investors alike. Features include refreshed interiors, and a layout designed for comfortable living. Conveniently located near major roads, schools, and local amenities. Schedule your showing today and bring your best offer—this one won’t last.
-
2026-02-08$120,000 Active 434-char remark
Show marketing remark (434 chars)
Beautifully updated property offering modern finishes and move-in-ready appeal. Recent improvements enhance both functionality and style, making this home a great option for homeowners or investors alike. Features include refreshed interiors, and a layout designed for comfortable living. Conveniently located near major roads, schools, and local amenities. Schedule your showing today and bring your best offer - this one won't last.
-
2010-09-09soldstatus $3,817
-
2010-06-11$3,000
-
2007-09-03historical
-
2007-03-03$89,000
-
2006-12-26historical
-
2006-09-06$95,000
-
2000-03-30soldstatus $69,000
-
2000-03-10soldstatus $69,000
-
2000-01-12$70,000
ⓘ Source: listings_history table (triggers on properties + properties_extension) + one-shot
backfill from property_details.listing_events for pre-trigger history.
Tax reassessment forecast MI · Partial reset (capped growth)
- Current annual tax
- $854 · $71/mo
- Projected year-2 tax
- $1,120 · $93/mo
- Expected delta
- +$266/yr (+$22/mo · 31.2%)
ⓘ Screening estimate from a state-policy table — verify with the county assessor before closing.
Climate risk First Street
- Flood 1/10 Low FEMA zone X (unshaded) · 0% chance over 30 yrs
- Wildfire 1/10 Low
- Heat 3/10 Moderate 7 d/yr ≥97°F today · 15 d/yr by 30 yrs out
- Wind 2/10 Low
- Air quality 4/10 Moderate 4 unhealthy d/yr today · 6 by 30 yrs out
Nearby sold comps map
Loading sold comps map…
Walkable amenities ~0.75 mi
Loading nearby amenities…
Taxation est. · year 1
- Rental income
- $14,706
- − Mortgage interest
- −$5,041
- − Property taxes
- −$854
- − Insurance
- −$450
- − Repairs & maintenance
- −$1,176
- − Management
- −$1,176
- − Depreciation
- −$2,618
- Taxable income
- $3,390
- Est. tax owed @ 24.0%
- −$813
- After-tax cash flow
- $3,837/yr
For passive investors: Depreciation is non-cash, so a rental often shows a tax loss while cash-flowing — sheltering income. Rental losses are passive: they offset passive income freely, and up to $25,000/yr can offset ordinary (W-2) income if you actively participate and your MAGI is under $100k (phasing out to $0 by $150k); unused losses carry forward. On sale, claimed depreciation is recaptured at up to 25%, and gains may owe capital-gains tax (a 1031 exchange can defer both). Figures are a year-1 estimate at your 24.0% rate — not tax advice; consult a CPA.
Schools (NCES district)
- District
- Detroit Public Schools Community District
- NCES district ID
- 2601103
- Math proficiency
- 10% ▼ -2.00%
- Reading proficiency
- 24% ▲ 6.00%
- Median HH income
- $25,815
- Composite
- 13.06/100
- National rank
- #9564
- State rank
- #499 of 540 in MI
Livability — Detroit
- Score
- 73/100
- State rank
- #218
- US rank
- #5427
Category grades
Schools grade is shown separately in the Schools card above.
Census & demographics
- Census place
- Detroit, MI
- County
- Wayne County · 1,562,939 people
- City population
- 572,865
- Metro
- Detroit-Warren-Dearborn, MI
- Population (ZIP)
- 20,696
- Household income
- $34,468
- Rent vs Own
- Severe rent burden
- 1418.0
Population outlook (Wayne County) Hauer SSP2
- Today (2025)
- 1,675,273 people
- By 2030
- 1,620,300 · -3.3%
- By 2040
- 1,502,341 · -10.3%
- By 2050
- 1,384,039 · -17.4%
- By 2075
- 1,124,592 · -32.9%
- By 2100
- 881,193 · -47.4%
Race, ethnicity, and origin ACS 2023
- Neighborhood character
- Predominantly Black (86%)
- Race & ethnicity
- Black 86% Two or more races 7% Hispanic / Latino 5% White 4% Native American 2%
- Hispanic origin (detail)
- Mexican 4%
- Common ancestry
- Hispanic 1% Romanian 1%
- Foreign-born
- 2% · Canada
- Languages at home
- 95% English-only · Spanish 4%
Political lean MEDSL · Wayne
- 2024 margin
- Strong D (+29.0) · D 62.7% · R 33.7% · Other 3.6%
- 2008→2024 swing
- -20.5pp toward R · 2008: 49.5pp · 2024: 29.0pp
- All cycles
- 2024: D+29.0 2020: D+38.1 2016: D+37.3 2012: D+46.9 2008: D+49.5
Not yet ingested
- Civics
- —
Market trends
- HPI YoY
- ▲ 36.51%
- Current HPI
- 234.0465
- Rent YoY
- —
- Metro
- Detroit-Warren-Dearborn, MI
- State GDP YoY
- ▲ 1.37%
- F500 in state
- 28
Industry mix (Fortune 500 HQ in MI)
| Industry | F500 HQs | Revenue |
|---|---|---|
| Automotive Parts | 3 | $48B |
|
||
| Automotive | 2 | $372B |
|
||
| Chemicals | 1 | $45B |
|
||
| Automotive Retail | 1 | $29B |
|
||
| Healthcare / Medical Devices | 1 | $23B |
|
||
| Automotive Technology | 1 | $20B |
|
||
Price history
+28.6% since first listed13 events — show timeline
- 2026-04-24 Price Changed $90,000 MiRealSource-MiMLS
- 2026-04-24 Price Changed $90,000 REALCOMP
- 2026-02-09 Listed $120,000 REALCOMP
- 2026-02-08 Listed $120,000 MiRealSource-MiMLS
- 2010-09-09 Sold (MLS) $3,817 REALCOMP
- 2010-06-11 Listed $3,000 REALCOMP
- 2007-09-03 Listing Removed — REALCOMP
- 2007-03-03 Listed $89,000 REALCOMP
- 2006-12-26 Listing Removed — REALCOMP
- 2006-09-06 Listed $95,000 REALCOMP
- 2000-03-30 Sold (Public Records) $69,000 Public Records
- 2000-03-10 Sold (MLS) $69,000 REALCOMP
- 2000-01-12 Listed $70,000 REALCOMP
Property tax history
-1.1%/yrLatest (2025): $854 · -53.5% YoY. Source: county tax records.
Cash-flow waterfall
monthlySold comps — $/sqft
last 12 mo · ≤1 miLoading sold comps…