 Fourplex
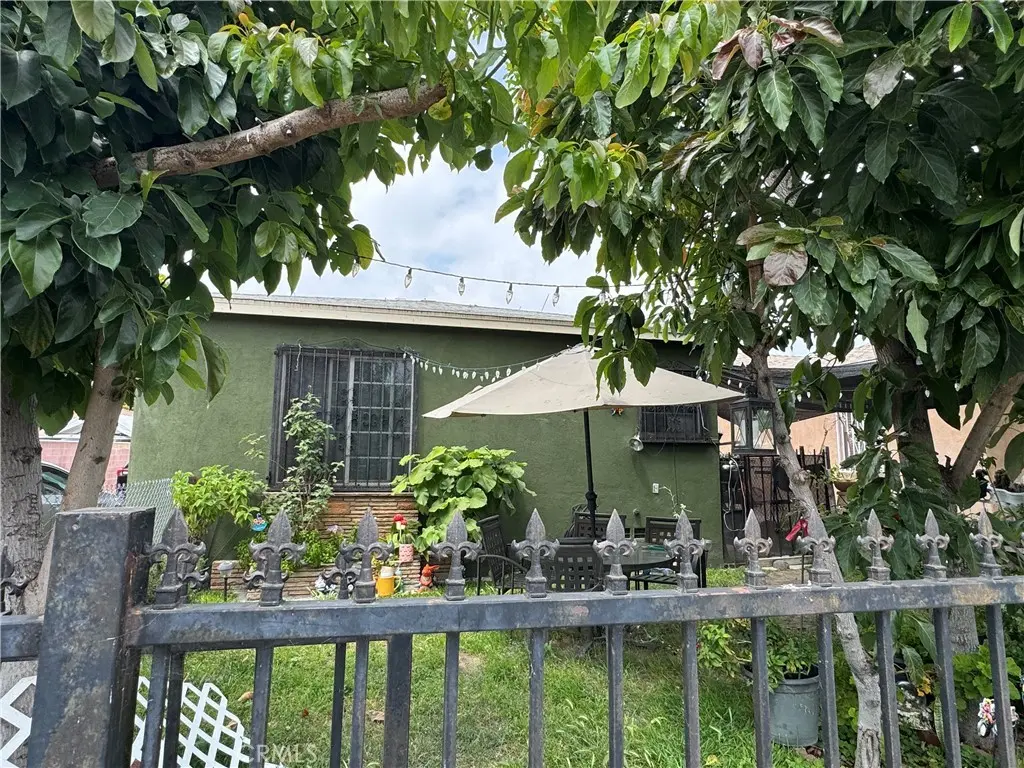
5121 E 60th St · Maywood, CA
Flood risk 1/10 · Minimal
- FEMA flood zone
- X
- Chance of flooding over 30 yrs
- 0.0%
- Est. flood insurance / yr
- $507 – $1,088
Fire risk 1/10 · Minimal
- Est. fire insurance / yr
- $659 – $1,223
Heat risk 5/10 · Moderate
- Hot days now (above 93°F)
- 7 days/yr
- Hot days in 30 yrs
- 21 days/yr
Wind risk 1/10 · Minimal
- Chance of severe wind over 30 yrs
- —
Air-quality risk 5/10 · Moderate
- Unhealthy air days now
- 9 days/yr
- Unhealthy air days in 30 yrs
- 9 days/yr
Risk factors via First Street. Map © Google.
Why this score? — see what drove the B- grade
The composite is a weighted blend of 9 inputs, each scored 0–100. Each bar is that input's sub-score; the figure is the points it added to the 100-point composite (weight × sub-score).
- Cash flow +30.0/30.0
- 1% rule +10.0/10.0
- DSCR +10.0/10.0
- ARV discount +7.5/15.0
- Schools +3.6/10.0
- Livability +2.7/5.0
- Rent growth +2.5/5.0
- Condition / age +2.5/5.0
- Appreciation +0.0/10.0
$750,000
🖨 Deal sheet (PDF) 📄 Offer letter ✓ Due diligence
Multi-family units
County records classify this as Multi-Family (2-4 Unit). Listing-text estimate: 4 units. confirmed
Listing remarks
Prime multi-family investment opportunity in Maywood! This quadruplex at 5121 E 60th Street is a fantastic addition to any investor’s portfolio, offering excellent rental income potential and long-term upside. With its affordable price point, this property is also ideal for first-time investors looking to enter the income property market and begin building wealth through real estate. Situated in a desirable residential neighborhood, the property is conveniently located within walking distance to Riverfront Park and close to schools, shopping, dining, and freeway access. With strong tenant demand in the area, this income-producing property presents an excellent opportunity for steady c
Key facts
- Close to schools
- Close to dining
- Quadruplex
Tags
Property features AI
Finance
- Other: Four separate electric meters; Four separate gas meters; One separate water meter; Total building area reported as 2,337; Number of units: 4
- Financial info: Total actual rent reported: $4,155; Gross income reported: $49,860; Gross scheduled income: $4,155; Net operating income: $3,805; Operating expenses: $350; Insurance expense: $4,500; Water/sewer expense: $250; Trash expense: $100; Rent control applies; Four leased units
- HOA & community: Community features include street lighting, sidewalks, and a nearby park
Exterior
- Parking: Three parking spaces total; Three-car garage capacity with side-entry garage and direct garage access; Driveway and private parking
- Security: Window bars; Smoke detector
- Utilities: Private water; Public sewer; Natural gas connected; Electricity connected; Sewer connected
- Home design: Single-story buildings; Property has a view; Cosmetic repairs needed in parts and some units updated/remodeled; Entry at first level
- Construction: Shingle/composition roof; Concrete slab foundation; Two buildings; Year built from public records
- Exterior features: Satellite dish; No pool
Interior
- Kitchen: Gas range
- Bedrooms: All bedrooms on the first level; Unit breakdown includes one 2-bed unit and three 1-bed units
- Flooring: Tile flooring
- Bathrooms: All units have one full bathroom
- Interior features: Ceiling fan; Granite counters; Smoke detector; Window bars
- Laundry & utility: No laundry hookups listed
Neighborhood map
What this means for you Summary
Snapshot
- This is a 4 × 4-bed/4.0-bath units multifamily listed at $750k.
Deal economics
- At list price, monthly cash flow is $6k ($75k/yr) — positive. Per door: $2k/mo.
- The deal already cash-flows at list — no discount required.
- Meets the 1% rule at list price ($14k rent vs $750k).
Location & tenants
- Location reads 53/100 on livability (#948 in CA) — a working-class tenant base; expect higher turnover. Watch: crime F, amenities F, commute F.
- Los Angeles Unified (urban): math 29% / reading 54% proficiency, ranked #223 of 517 in CA (top 43%) — families likely to look elsewhere, expect single-tenant / working-renter base with shorter leases; 67% free/reduced lunch — lower-income household profile, screen leases tightly.
- Zoned schools: Heliotrope Avenue Elementary (491 students, 94% FRL); Chester W. Nimitz Middle (1,177 students, 96% FRL); Bell Senior High (math 32% / reading 66%, grade D, #369 of 1,170 statewide, top 32%, 2,351 students, 95% FRL) — zoned schools average 95% FRL vs 67% district-wide (28 pts higher); higher-poverty schools than district average — tighter screening recommended.
- Market conditions: 14 active listings in the ZIP; 18 comparable units currently listed for rent nearby; rentals at typical pace (median 20d on market — plan ~3-4 weeks tenant-placement turnaround); 19,697 units permitted in Los Angeles County in 2024 (9,426 in 5+ unit buildings).
Forward outlook
- Local home prices are declining (-3.0%/yr); year-one equity from $5k of loan paydown is wiped out by about $22k of value loss. Plan a longer hold.
- Los Angeles County population projected at +9% by 2050 — modest demand growth; plan on rents tracking national, not racing it.
- At projected returns (-3.0% appreciation + 3.0% rent growth), your $210k cash investment doubles in ~4 years — after that, you're playing with house money.
Negotiation context
- Only 12 days on market — expect competitive offers; lowballing is unlikely to land.
Risks & watch-outs
- Watch-outs: built in 1946 — expect roof / HVAC / electrical / plumbing capex.
- Climate carrying-cost: extreme-heat days projected 7→21/yr by 2055 (HVAC capex compounding) — expect insurance premiums to compound above CPI over the hold.
Questions for the listing agent
- Can we see the unit-by-unit rent roll, current vacancy, and any below-market leases? What's the average tenancy length?
- What capital expenditures (roof, boiler, parking lot, exteriors) have been made in the last 5 years, and what's planned in the next 2?
- Built in 1946 — when were the roof, HVAC, electrical panel, plumbing, and water heater last replaced?
- Is there a deadline driving the sale (1031 exchange, divorce, estate, relocation)? That informs how much negotiation room exists.
- Schools are D-rated, which usually means shorter tenancies and higher turnover. Who's the typical renter profile here, and what's been the actual vacancy rate?
- Crime grade is F in this area — have there been break-ins, vandalism, or insurance claims at this property in the last 3 years? What carrier currently insures it and at what premium?
- What's the average days-on-market for RENTAL listings here right now (not sales)? A rising rental-DOM trend means longer vacancies and softer asking-rent achievability than the comps imply.
- What's the recent tenant-quality profile in this submarket — average credit score on applications, eviction rate, late-payment / NSF rate, and stable-employment percentage? A property-management company in the area should have these aggregated.
- How much new apartment / multifamily construction is in the pipeline within 1–3 miles? Heavy new supply (>2% of stock underway) typically softens rents 12–24 months out; light construction supports rent growth.
Investment metrics
- 1% rule
- 1.83% ✓
- Cap rate
- 16.27%
- Cash-on-cash
- 35.62%
- DSCR
- 2.58
- GRM
- 4.6
CMA / ARV
No comps found within radius.
Projected returns pro-forma
-3.0% appreciation · 3.0% rent growth · sell at horizon
- IRR
- 31.2%
- Equity multiple
- 2.31×
- Total profit
- $275,292
- Equity at exit
- $111,827
- IRR
- 38.4%
- Equity multiple
- 4.57×
- Total profit
- $750,257
- Equity at exit
- $64,846
Cash invested: $210,000 (down + closing). Projections, not guarantees.
Landlord ↔ Tenant lean methodology
- Overall (STATE)
- 18 Strongly Tenant-Friendly
- State California
- 18 Strongly Tenant-Friendly · D+13
- County
- — inherits STATE
- City
- — inherits STATE
ZIP-level market 90270
- Active inventory
- 14
- Price-to-rent
- 18.2×
Monthly cashflow live
- Estimated rent
- $13,700 high interval (Pro) →
- Mortgage (P&I)
- −$3,933
- Tax from tax record
- −$344 /mo · $4,133/yr
- Insurance
- −$312
- HOA
- −$0
- Vacancy / Maint / Mgmt
- −$2,877
- Net cashflow
- $6,233
Break-even live
Sensitivity live
| Price | -10% $6,658 | -5% $6,445 | +0% $6,233 | +5% $6,021 | +10% $5,808 |
|---|---|---|---|---|---|
| Rent | -10% $5,151 | -5% $5,692 | +0% $6,233 | +5% $6,774 | +10% $7,315 |
| Rate | -1.0pp $6,611 | -0.5pp $6,424 | base $6,233 | +0.5pp $6,039 | +1.0pp $5,841 |
4-unit breakdown (identical units grouped — click to expand)
| Units | Beds | Baths | Est. rent |
|---|---|---|---|
| 4× units | 4 | 4 | $13,700 |
| #1 | 4 | 4 | $3,425 |
| #2 | 4 | 4 | $3,425 |
| #3 | 4 | 4 | $3,425 |
| #4 | 4 | 4 | $3,425 |
| Total (4 units) | $13,700 | ||
UW: 25.0% down · 7.5% · 30yr · 1.5% tax · 5.0% vac · 8.0% maint · 8.0% mgmt
Financing live
Cash to close
- Down payment
- $187,500
- Closing costs
- $22,500
- Reserves months
- —
- Total cash needed
- —
Loan-product check · same deal, 3 products live
Conventional
25% down · 7.5% · 30yr
- Down + closing
- —
- Monthly P&I
- —
- Monthly cashflow
- —
- DSCR
- —
- Eligible?
- —
Personal DTI + credit; lowest rate.
DSCR
20% down · 8.5% · 30yr
- Down + closing
- —
- Monthly P&I
- —
- Monthly cashflow
- —
- DSCR
- —
- Eligible?
- —
No personal income docs; deal must DSCR.
Hard money
10% down · 12.0% · 12mo
- Down + closing
- —
- Monthly P&I
- —
- Monthly cashflow
- —
- DSCR
- —
- Eligible?
- —
Short-term bridge; refi at stabilization.
Rent comps 18 comps
| Address | Beds | Baths | Sqft | Rent | $/sqft | DOM | Units | Dist |
|---|---|---|---|---|---|---|---|---|
| 6105 Alamo Ave Unit 6105C Maywood, CA | 1.0 | 1.0 | 475 | $1,545 | $3.25 | 5d | 1 | 0.18mi |
| 5050 Randolph St Unit 5062 Bell, CA | 1.0 | 1.0 | 500 | $1,700 | $3.40 | 26d | 1 | 0.29mi |
| 4734 E 57th St Unit C Maywood, CA | 1.0 | 1.0 | 550 | $1,800 | $3.27 | 26d | 1 | 0.48mi |
| 6616 Walker Ave Bell, CA | 1.0 | 1.0 | 500 | $1,700 | $3.40 | 20d | 1 | 0.68mi |
| 6309 Eastern Ave Unit A Bell Gardens, CA | 2.0 | 1.0 | 650 | $1,925 | $2.96 | 18d | 1 | 0.70mi |
| 4656 Bell Pl Bell Gardens, CA | 1.0 | 1.0 | 475 | $1,950 | $4.11 | 45d | 1 | 0.89mi |
| 6525 Ajax Ave Bell Gardens, CA | 2.0 | 1.0 | 574 | $2,500 | $4.36 | 0d | 1 | 0.93mi |
| 4656 Bell Ave Unit A Bell, CA | 1.0 | 1.0 | 400 | $1,800 | $4.50 | 19d | 1 | 0.94mi |
| 7113 Chanslor Ave Bell, CA | 2.0 | 1.0 | 650 | $2,600 | $4.00 | 26d | 1 | 1.00mi |
| 6542 El Cortez Ave Bell Gardens, CA | 2.0 | 1.0 | 640 | $2,375 | $3.71 | 7d | 1 | 1.30mi |
| 4332 Florence Ave Unit 15 Bell, CA | 1.0 | 1.0 | 450 | $1,850 | $4.11 | 23d | 1 | 1.38mi |
| 7712 Walker Ave Unit A Cudahy, CA | 2.0 | 1.0 | 720 | $2,200 | $3.06 | 17d | 1 | 1.39mi |
| 7716 Walker Ave Unit C Cudahy, CA | 2.0 | 1.0 | 740 | $2,080 | $2.81 | 9d | 1 | 1.40mi |
| 7520 Atlantic Ave Unit 4 Cudahy, CA | 1.0 | 1.0 | 700 | $1,600 | $2.29 | 45d | 1 | 1.40mi |
| 5712 Priory St Unit 5714 1/4 Bell Gardens, CA | 2.0 | 1.0 | 550 | $2,200 | $4.00 | 0d | 1 | 1.46mi |
| 5712 Priory St Unit 5714 Bell Gardens, CA | 2.0 | 1.0 | 650 | $2,250 | $3.46 | 0d | 1 | 1.46mi |
| 6133 Orchard Ave Unit B Huntington Park, CA | 1.0 | 1.0 | 474 | $1,895 | $4.00 | 9d | 1 | 1.47mi |
| 5930 Loma Vista Ave Apt E Huntington Park, CA | 2.0 | 1.0 | 700 | $2,500 | $3.57 | 26d | 1 | 1.50mi |
Listing history 8 events
-
2026-06-21days on market $750,000 Active 12 DOM
-
2026-06-18days on market $750,000 Active 9 DOM
-
2026-06-17days on market $750,000 Active 8 DOM
-
2026-06-16days on market $750,000 Active 7 DOM
-
2026-06-15days on market $750,000 Active 6 DOM
-
2026-06-13days on market $750,000 Active 4 DOM
-
2026-06-10remarks 693-char remark
-
2026-06-10$750,000 Active 1 DOM
ⓘ Source: listings_history table (triggers on properties + properties_extension) + one-shot
backfill from property_details.listing_events for pre-trigger history.
Tax reassessment forecast CA · Resets to sale price
- Current annual tax
- $4,133 · $344/mo
- Projected year-2 tax
- $5,700 · $475/mo
- Expected delta
- +$1,567/yr (+$131/mo · 37.9%)
ⓘ Screening estimate from a state-policy table — verify with the county assessor before closing.
Climate risk First Street
- Flood 1/10 Low FEMA zone X · 0% chance over 30 yrs
- Wildfire 1/10 Low
- Heat 5/10 Major 7 d/yr ≥93°F today · 21 d/yr by 30 yrs out
- Wind 1/10 Low
- Air quality 5/10 Major 9 unhealthy d/yr today · 9 by 30 yrs out
Nearby sold comps map
Loading sold comps map…
Walkable amenities ~0.75 mi
Loading nearby amenities…
Taxation est. · year 1
- Rental income
- $164,400
- − Mortgage interest
- −$42,012
- − Property taxes
- −$4,133
- − Insurance
- −$3,750
- − Repairs & maintenance
- −$13,152
- − Management
- −$13,152
- − Depreciation
- −$21,818
- Taxable income
- $66,383
- Est. tax owed @ 24.0%
- −$15,932
- After-tax cash flow
- $58,864/yr
For passive investors: Depreciation is non-cash, so a rental often shows a tax loss while cash-flowing — sheltering income. Rental losses are passive: they offset passive income freely, and up to $25,000/yr can offset ordinary (W-2) income if you actively participate and your MAGI is under $100k (phasing out to $0 by $150k); unused losses carry forward. On sale, claimed depreciation is recaptured at up to 25%, and gains may owe capital-gains tax (a 1031 exchange can defer both). Figures are a year-1 estimate at your 24.0% rate — not tax advice; consult a CPA.
Schools (NCES district)
- District
- Los Angeles Unified
- NCES district ID
- 0622710
- Math proficiency
- 29% ▼ -4.00%
- Reading proficiency
- 54% ▲ 10.00%
- Median HH income
- $50,403
- Composite
- 35.67/100
- National rank
- #4875
- State rank
- #223 of 517 in CA
Livability — Maywood
- Score
- 53/100
- State rank
- #948
- US rank
- #24420
Category grades
Schools grade is shown separately in the Schools card above.
Census & demographics
- Census place
- Maywood, CA
- City population
- 24,522
- Population (ZIP)
- 24,522
Population outlook (Los Angeles County) Hauer SSP2
- Today (2025)
- 10,940,515 people
- By 2030
- 11,256,481 · +2.9%
- By 2040
- 11,729,929 · +7.2%
- By 2050
- 11,948,407 · +9.2%
- By 2075
- 11,818,114 · +8.0%
- By 2100
- 10,842,928 · -0.9%
Race, ethnicity, and origin ACS 2023
- Neighborhood character
- Predominantly Hispanic (98%)
- Race & ethnicity
- Hispanic / Latino 98% Two or more races 30% Native American 3%
- Hispanic origin (detail)
- Mexican 79%
- Foreign-born
- 50% · Canada
- Languages at home
- 10% English-only · Spanish 89%
Political lean MEDSL · Los Angeles
- 2024 margin
- Solid D (+32.9) · D 64.8% · R 31.9% · Other 3.3%
- 2008→2024 swing
- -7.4pp toward R · 2008: 40.4pp · 2024: 32.9pp
- All cycles
- 2024: D+32.9 2020: D+44.2 2016: D+48.0 2012: D+40.0 2008: D+40.4
Not yet ingested
- Civics
- —
Market trends
- HPI YoY
- ▼ -366.17%
- Current HPI
- 417.7641
- Rent YoY
- —
- Metro
- —
- State GDP YoY
- ▲ 3.21%
- F500 in state
- 116
Industry mix (Fortune 500 HQ in CA)
| Industry | F500 HQs | Revenue |
|---|---|---|
| Technology | 27 | $1,492B |
|
||
| Financial Services | 3 | $174B |
|
||
| Retail | 3 | $44B |
|
||
| Insurance | 3 | $26B |
|
||
| Media / Entertainment | 2 | $115B |
|
||
| Pharmaceuticals / Biotech | 2 | $62B |
|
||
Price history
1 event — show timeline
- 2026-06-09 Listed $750,000 CRMLS
Property tax history
+2.8%/yrLatest (2025): $4,133 · +6.7% YoY. Source: county tax records.
Cash-flow waterfall
monthlySold comps — $/sqft
last 12 mo · ≤1 miLoading sold comps…