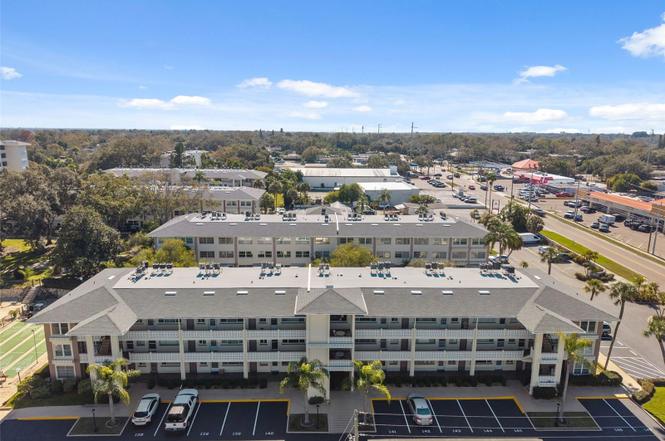
1235 S Highland Ave Unit 1-207 · Clearwater, FL
Flood risk 1/10 · Minimal
- FEMA flood zone
- X (unshaded)
- Chance of flooding over 30 yrs
- 0.0%
- Est. flood insurance / yr
- $507 – $1,088
Fire risk 1/10 · Minimal
- Est. fire insurance / yr
- $947 – $1,759
Heat risk 10/10 · Severe
- Hot days now (above 107°F)
- 7 days/yr
- Hot days in 30 yrs
- 27 days/yr
Wind risk 10/10 · Severe
- Chance of severe wind over 30 yrs
- 99.0%
Air-quality risk 3/10 · Minor
- Unhealthy air days now
- 2 days/yr
- Unhealthy air days in 30 yrs
- 3 days/yr
Risk factors via First Street. Map © Google.
Why this score? — see what drove the D grade
The composite is a weighted blend of 9 inputs, each scored 0–100. Each bar is that input's sub-score; the figure is the points it added to the 100-point composite (weight × sub-score).
- 1% rule +9.6/10.0
- Cash flow +8.7/30.0
- ARV discount +7.5/15.0
- Schools +4.3/10.0
- Livability +4.1/5.0
- Condition / age +2.5/5.0
- DSCR +2.4/10.0
- Rent growth +1.9/5.0
- Appreciation +0.0/10.0
$120,000
🖨 Deal sheet (PDF) 📄 Offer letter ✓ Due diligence
Listing remarks
WELCOME TO YOUR TROPICAL BEACH CONDO at 1235 S Highland Ave #1-207, Clearwater, FL in the MARVELOUS 55+ community of Kalmia. Your AMAZING 2-floor unit features 2 king-size bedrooms & 1 bathroom. Kalmia community is located in a NON-FLOOD, NON-EVACUATION ZONE. Your FULLY REMODELED home is perfect to live the FLORIDA SALT LIFE LIFESTYLE. Step inside and be greeted by a BRIGHT & AIRY OPEN-CONCEPT FLOOR PLAN filled with NATURAL LIGHT streaming through the STORM-IMPACT, DOUBLE-PANE, THERMAL-TINTED, LOW-E WINDOWS (fully permitted 3/2022) illuminating the interior together with the multiple light fixtures. LUXURY VINYL or CERAMIC TILES elegantly flow throughout the entire home. The OPE
Key facts
- Fully remodeled home
- Remodeled kitchen
- Storm impact windows
Tags
Property features AI
Finance
- Other: Furnished; Association approval required
- Financial info: Monthly condo fee of $638 ($7,656 annually); Lease restrictions apply
- HOA & community: HOA membership required; monthly condo fee includes cable TV, common area taxes, pool, escrow reserves, structure and grounds maintenance, management, pest control, private road, recreational facilities, sewer, trash and water; Community amenities: clubhouse, fitness center, pool, park, shuffleboard court, recreation facilities, sidewalks, street lights; Association provides elevator(s), laundry, maintenance and handicap/wheelchair access; Buyer approval required; Senior community; Pets not allowed
Exterior
- Parking: Assigned parking; Ground-level parking; Guest parking; Off-street parking; Reserved spaces
- Security: Smoke detector(s)
- Utilities: Public water; Public sewer; Electricity available and connected; Cable available and connected; BB/HS internet available; Water connected; Sewer connected
- Home design: Residential condominium, attached; One-story; Entry faces north; Accessible entrance and accessible central living area
- Construction: Block and concrete construction; Concrete roof; Slab foundation; Built (completed)
- Exterior features: Front porch; Exterior lighting; Sidewalk; Storage; Child safety pool fence; Gunite in-ground pool; Pool lighting; Outside bath access; Mature landscaping with trees; Florida-friendly/native landscaping; Cleared, landscaped, level grounds; Near golf course, marina and public transit; Private setting with paved roads and sidewalks
Interior
- Kitchen: Range; Range hood; Refrigerator; Electric water heater
- Bedrooms: 2 bedrooms
- Bathrooms: 1 full bathroom
- Heating & cooling: Central heating; Electric heating; Heat pump; Central air conditioning
- Interior features: Built-in features; Ceiling fans; High ceilings; Open floorplan; Solid surface counters; Solid wood cabinets; Stone counters; Thermostat; Walk-in closet(s); Window treatments; Aluminum window frames; Blinds; Double pane / insulated / thermal / tinted windows; Rods
- Laundry & utility: Common area laundry room; Washer hookup; Electric dryer hookup; Accessible washer/dryer
Neighborhood map
What this means for you Summary
Snapshot
- This is a 2-bed/1.0-bath condo listed at $120k.
Deal economics
- At list price, monthly cash flow is $-100 ($-1k/yr) — negative.
- To cash-flow at today's rent, offer at most $102k (14.8% below list).
- Meets the 1% rule at list price ($2k rent vs $120k).
- Recommended offer: $102k (14.8% below list) — sets the bar for cash-flow.
- Cap rate 5.3% vs local median 3.0% in Clearwater — top-decile yield for the area; either an underpriced asset or a hidden risk that comps aren't pricing in. Stress-test before assuming the spread holds.
Location & tenants
- Location reads 82/100 on livability (#60 in FL, #988 nationally) — a professional / high-income tenant draw. Strengths: commute A+, housing A+, health & safety A+; Watch: employment C-.
- Pinellas (suburban): math 51% / reading 51% proficiency, ranked #31 of 73 in FL (top 42%) — acceptable for families but not a draw, mixed tenant base, ~2y average lease.
- Zoned schools: Plumb Elementary School (math 56% / reading 54%, grade C, #872 of 2,144 statewide, top 42%, 622 students, 56% FRL); Clearwater High School (math 30% / reading 36%, grade F, #406 of 667 statewide, top 61%, 1,664 students, 59% FRL).
- Market conditions: Rents soft (-2.2%/yr); 363 active listings in the ZIP; 40 comparable units currently listed for rent nearby; rentals at typical pace (median 19d on market — plan ~3-4 weeks tenant-placement turnaround); 2,676 units permitted in Pinellas County in 2024 (1,422 in 5+ unit buildings).
- This rent runs 34% of the median local income ($62k/yr) — at the standard rent-burdened threshold; future hikes will face affordability resistance.
Forward outlook
- Local home prices are declining (-3.0%/yr); year-one equity from $830 of loan paydown is wiped out by about $4k of value loss. Plan a longer hold.
- Pinellas County population projected at +14% by 2050 — modest demand growth; plan on rents tracking national, not racing it.
Negotiation context
- It's been on market 138 days — a 12% lower offer ($106k) is reasonable based on typical stale-listing flexibility.
- 6 sale attempts since 10y ago; this cycle's ask has dropped $9k (7%) from the opening price — seller is motivated, your offer sets the floor, not the list.
- Current owner paid $72k; list at $120k implies a 67% gain — meaningful room to come down on a strong offer.
Risks & watch-outs
- Watch-outs: HOA is 36% of rent.
- Climate carrying-cost: severe wind risk, 99% chance of damaging wind over 30y; extreme-heat days projected 7→27/yr by 2055 (HVAC capex compounding) — expect insurance premiums to compound above CPI over the hold.
Questions for the listing agent
- What do current leases actually rent for vs. the listed asking? Can we see a recent rent roll and the last 12 months of T-12 income?
- It's been on market 138 days. Have you received any prior offers? Is the seller open to a 15% concession, seller financing, or rate buy-down credit?
- Built in 1968 — when were the roof, HVAC, electrical panel, plumbing, and water heater last replaced?
- What does the HOA fee cover, when was the last increase, and are there any pending special assessments or reserve-fund shortfalls?
- Any open or pending special assessments — roof, HVAC, plumbing, elevator, façade? What's the per-unit balance and payoff schedule, and is the seller paying it off at close or rolling it to the buyer?
- Why hasn't it sold? Are there any deal-killer items the seller is aware of (foundation, flood, title, zoning, code violations)?
- Is there a deadline driving the sale (1031 exchange, divorce, estate, relocation)? That informs how much negotiation room exists.
- The area grade is low — what's the realistic commute time and amenity access for the typical tenant pool here? Any planned neighborhood developments (good or bad) we should know about?
- What's the average days-on-market for RENTAL listings here right now (not sales)? A rising rental-DOM trend means longer vacancies and softer asking-rent achievability than the comps imply.
- What's the recent tenant-quality profile in this submarket — average credit score on applications, eviction rate, late-payment / NSF rate, and stable-employment percentage? A property-management company in the area should have these aggregated.
- How much new apartment / multifamily construction is in the pipeline within 1–3 miles? Heavy new supply (>2% of stock underway) typically softens rents 12–24 months out; light construction supports rent growth.
Investment metrics
- 1% rule
- 1.46% ✓
- Cap rate
- 5.29%
- Cash-on-cash
- -3.59%
- DSCR
- 0.84
- GRM
- 5.7
CMA / ARV
No comps found within radius.
Projected returns pro-forma
-3.0% appreciation · 0.0% rent growth · sell at horizon
- IRR
- -28.5%
- Equity multiple
- 0.09×
- Total profit
- $-30,555
- Equity at exit
- $17,892
- IRR
- -72.0%
- Equity multiple
- -0.58×
- Total profit
- $-52,978
- Equity at exit
- $10,375
Cash invested: $33,600 (down + closing). Projections, not guarantees.
Landlord ↔ Tenant lean methodology
- Overall (STATE)
- 87 Strongly Landlord-Friendly
- State Florida
- 87 Strongly Landlord-Friendly · R+3
- County
- — inherits STATE
- City
- — inherits STATE
ZIP-level market 33756
- Rents YoY
- -2.2%
- Active inventory
- 363
- Price-to-rent
- 5.7×
Monthly cashflow live
- Estimated rent
- $1,756 high interval (Pro) →
- Mortgage (P&I)
- −$629
- Tax from tax record
- −$170 /mo · $2,044/yr
- Insurance
- −$50
- HOA
- −$638
- Vacancy / Maint / Mgmt
- −$369
- Net cashflow
- $-100
Break-even live
Sensitivity live
| Price | -10% $-32 | -5% $-66 | +0% $-100 | +5% $-134 | +10% $-168 |
|---|---|---|---|---|---|
| Rent | -10% $-239 | -5% $-170 | +0% $-100 | +5% $-31 | +10% $38 |
| Rate | -1.0pp $-40 | -0.5pp $-70 | base $-100 | +0.5pp $-132 | +1.0pp $-163 |
UW: 25.0% down · 7.5% · 30yr · 1.5% tax · 5.0% vac · 8.0% maint · 8.0% mgmt
Financing live
Cash to close
- Down payment
- $30,000
- Closing costs
- $3,600
- Reserves months
- —
- Total cash needed
- —
Loan-product check · same deal, 3 products live
Conventional
25% down · 7.5% · 30yr
- Down + closing
- —
- Monthly P&I
- —
- Monthly cashflow
- —
- DSCR
- —
- Eligible?
- —
Personal DTI + credit; lowest rate.
DSCR
20% down · 8.5% · 30yr
- Down + closing
- —
- Monthly P&I
- —
- Monthly cashflow
- —
- DSCR
- —
- Eligible?
- —
No personal income docs; deal must DSCR.
Hard money
10% down · 12.0% · 12mo
- Down + closing
- —
- Monthly P&I
- —
- Monthly cashflow
- —
- DSCR
- —
- Eligible?
- —
Short-term bridge; refi at stabilization.
Rent comps 40 comps
| Address | Beds | Baths | Sqft | Rent | $/sqft | DOM | Units | Dist |
|---|---|---|---|---|---|---|---|---|
| 1524 Lakeview Rd Clearwater, FL | 2.0 | 2.0 | 1100 | $1,395 | $1.27 | 25d | 1 | 0.14mi |
| 1520 Jeffords St Clearwater, FL | 1.0–2.0 | 1.0 | 645 | $1,500 | $2.33 | 25d | 1 | 0.14mi |
| 1432 Lotus Path Clearwater, FL | 2.0 | 1.0 | 900 | $1,750 | $1.94 | 12d | 1 | 0.26mi |
| 1009 Chester Dr Clearwater, FL | 3.0 | 2.0 | 1105 | $2,500 | $2.26 | 13d | 1 | 0.39mi |
| 1416 Druid Rd E Clearwater, FL | 2.0 | 1.0 | 864 | $2,150 | $2.49 | 5d | 1 | 0.42mi |
| 618 S Crest Ave Clearwater, FL | 3.0 | 1.0 | 997 | $2,500 | $2.51 | 5d | 1 | 0.45mi |
| 1319 Boylan Ave Clearwater, FL | 2.0 | 1.0 | 800 | $1,550 | $1.94 | 25d | 1 | 0.57mi |
| 1406 Lemon St Clearwater, FL | 2.0 | 1.5 | 1020 | $1,990 | $1.95 | 25d | 1 | 0.59mi |
| 533 Yelvington Ave Clearwater, FL | 1.0 | 1.0 | 812 | $1,550 | $1.91 | 25d | 1 | 0.60mi |
| 1719 Turner St Clearwater, FL | 2.0 | 2.0 | 900 | $2,200 | $2.44 | 21d | 1 | 0.71mi |
| 600 S Betty Ln Apt 7 Clearwater, FL | 1.0 | 1.0 | 680 | $1,225 | $1.80 | 25d | 1 | 0.73mi |
| 612 Sally Ln S Unit 14 Clearwater, FL | 1.0 | 1.0 | 750 | $1,500 | $2.00 | 25d | 1 | 0.73mi |
| 711 S Lincoln Ave Clearwater, FL | 1.0–2.0 | 1.0 | 860 | $1,660 | $1.93 | 3d | 8 | 0.80mi |
| 1216 S Missouri Ave Clearwater, FL | 1.0–2.0 | 1.0–2.0 | 835 | $2,000 | $2.40 | 3d | 6 | 0.80mi |
| 1216 S Missouri Ave Clearwater, FL | 1.0–2.0 | 1.0–2.0 | 835 | $2,100 | $2.51 | 25d | 5 | 0.80mi |
| 1477 Pierce St Clearwater, FL | 2.0 | 1.0 | 650 | $1,575 | $2.42 | 25d | 1 | 0.82mi |
| 1224 S Missouri Ave #903 Clearwater, FL | 1.0 | 1.0 | 730 | $2,250 | $3.08 | 25d | 1 | 0.84mi |
| 518 Florida Ave Clearwater, FL | 3.0 | 1.0 | 990 | $1,795 | $1.81 | 5d | 1 | 0.87mi |
| 1221 Court St Unit 1 Clearwater, FL | 2.0 | 1.0 | 1000 | $1,800 | $1.80 | 25d | 1 | 0.90mi |
| 1119 Tuskawilla Dr Clearwater, FL | 2.0 | 1.0 | 603 | $1,500 | $2.49 | 3d | 23 | 0.91mi |
| 1485 Cleveland St Clearwater, FL | 3.0 | 1.0 | 978 | $2,200 | $2.25 | 5d | 1 | 0.92mi |
| 1482 Cleveland St Clearwater, FL | 3.0 | 2.0 | 1110 | $2,750 | $2.48 | 5d | 1 | 0.95mi |
| 1458 Cleveland St Clearwater, FL | 1.0 | 1.0 | 750 | $1,300 | $1.73 | 5d | 1 | 0.96mi |
| 1458 Cleveland St Clearwater, FL | 1.0 | 1.0 | 750 | $1,300 | $1.73 | 4d | 1 | 0.96mi |
| 701 S Madison Ave Clearwater, FL | 2.0 | 2.0 | 965 | $1,998 | $2.07 | 4d | 6 | 0.96mi |
| 1245 S Martin Luther King Jr Ave #104 Clearwater, FL | 2.0 | 2.0 | 1120 | $1,495 | $1.33 | 5d | 1 | 0.98mi |
| 106 S Fredrica Ave Clearwater, FL | 2.0 | 1.0 | 836 | $1,350 | $1.61 | 23d | 1 | 0.99mi |
| 100 Waverly Way #403 Clearwater, FL | 2.0 | 2.0 | 900 | $1,600 | $1.78 | 19d | 1 | 1.01mi |
| 27 N San Remo Ave Unit A Clearwater, FL | 2.0 | 1.0 | 625 | $1,297 | $2.08 | 4d | 1 | 1.03mi |
| 1458 Grove St Clearwater, FL | 1.0 | 1.0 | 625 | $1,295 | $2.07 | 23d | 1 | 1.07mi |
| 1562 S Jefferson Ave Clearwater, FL | 1.0 | 1.0 | 870 | $1,250 | $1.44 | 18d | 1 | 1.09mi |
| 117 N Evergreen Ave Clearwater, FL | 1.0 | 1.0 | 808 | $1,135 | $1.40 | 25d | 2 | 1.11mi |
| 117 N Evergreen Ave Clearwater, FL | 1.0 | 1.0 | 800 | $1,275 | $1.59 | 13d | 1 | 1.12mi |
| 1100 Turner St Clearwater, FL | 1.0 | 1.5 | 900 | $1,750 | $1.94 | 4d | 2 | 1.13mi |
| 915 Ewing Ave Clearwater, FL | 2.0 | 1.0 | 752 | $1,400 | $1.86 | 25d | 1 | 1.13mi |
| 941 Lakeview Rd Clearwater, FL | 1.0 | 1.0 | 550 | $1,199 | $2.18 | 19d | 1 | 1.13mi |
| 1260 Cleveland St Clearwater, FL | 1.0 | 1.0 | 617 | $1,432 | $2.32 | 4d | 2 | 1.14mi |
| 1365 Drew St #102 Clearwater, FL | 2.0 | 1.0 | 850 | $1,400 | $1.65 | 25d | 1 | 1.14mi |
| 1345 Drew St #16 Clearwater, FL | 2.0 | 1.0 | 925 | $1,500 | $1.62 | 25d | 1 | 1.16mi |
| 1329 Drew St #6 Clearwater, FL | 2.0 | 1.0 | 850 | $1,495 | $1.76 | 5d | 1 | 1.16mi |
HOA detail condo
- Monthly dues
- $638 · $7,656/yr
- Likely covers
- water
- Assessments
- None detected in remarks — confirm with the listing agent.
Listing history 34 events
-
2026-06-18days on market $120,000 Active 138 DOM
-
2026-06-17days on market $120,000 Active 137 DOM
-
2026-06-16days on market $120,000 Active 136 DOM
-
2026-06-15days on market $120,000 Active 135 DOM
-
2026-06-13days on market $120,000 Active 133 DOM
-
2026-06-09days on market $120,000 Active 129 DOM
-
2026-06-08days on market $120,000 Active 128 DOM
-
2026-06-07days on market $120,000 Active 127 DOM
-
2026-06-04days on market $120,000 Active 124 DOM
-
2026-06-03days on market $120,000 Active 123 DOM
-
2026-06-01days on market $120,000 Active 121 DOM
-
2026-05-31days on market $120,000 Active 120 DOM
-
2026-04-16price $120,000
-
2026-03-05price $125,000
-
2026-01-31$129,000 Active
-
2025-04-24historical
-
2025-01-08price $169,900
-
2024-08-21$174,500 Active
-
2024-08-14historical
-
2024-06-27price $175,500
-
2024-06-10price $179,500
-
2024-05-04$187,500 Active
-
2018-05-17soldstatus $71,900
-
2018-05-16soldstatus $71,900 Sold
-
2018-05-07status Pending
-
2018-04-09status Active
-
2018-03-24status Pending
-
2018-03-22status Pending
-
2018-03-16status Pending
-
2018-03-03$75,900 Active
-
2016-09-22soldstatus $45,000
-
2016-08-29soldstatus $45,000 Sold
-
2016-07-15historical Contingent - Inspections
-
2016-06-21$50,000 Active
ⓘ Source: listings_history table (triggers on properties + properties_extension) + one-shot
backfill from property_details.listing_events for pre-trigger history.
Tax reassessment forecast FL · Resets to sale price
- Current annual tax
- $2,044 · $170/mo
- Projected year-2 tax
- $2,044 · $170/mo
- Expected delta
- $0/yr ($0/mo · 0.0%)
ⓘ Screening estimate from a state-policy table — verify with the county assessor before closing.
Climate risk First Street
- Flood 1/10 Low FEMA zone X (unshaded) · 0% chance over 30 yrs
- Wildfire 1/10 Low
- Heat 10/10 Extreme 7 d/yr ≥107°F today · 27 d/yr by 30 yrs out
- Wind 10/10 Extreme 99% chance of damaging wind over 30 yrs
- Air quality 3/10 Moderate 2 unhealthy d/yr today · 3 by 30 yrs out
Nearby sold comps map
Loading sold comps map…
Walkable amenities ~0.75 mi
Loading nearby amenities…
Taxation est. · year 1
- Rental income
- $21,071
- − Mortgage interest
- −$6,722
- − Property taxes
- −$2,044
- − Insurance
- −$600
- − Repairs & maintenance
- −$1,686
- − Management
- −$1,686
- − HOA
- −$7,656
- − Depreciation
- −$3,491
- Taxable loss
- −$2,813
- Est. tax savings @ 24.0%
- +$675
- After-tax cash flow
- $-530/yr
For passive investors: Depreciation is non-cash, so a rental often shows a tax loss while cash-flowing — sheltering income. Rental losses are passive: they offset passive income freely, and up to $25,000/yr can offset ordinary (W-2) income if you actively participate and your MAGI is under $100k (phasing out to $0 by $150k); unused losses carry forward. On sale, claimed depreciation is recaptured at up to 25%, and gains may owe capital-gains tax (a 1031 exchange can defer both). Figures are a year-1 estimate at your 24.0% rate — not tax advice; consult a CPA.
Schools (NCES district)
- District
- Pinellas
- NCES district ID
- 1201560
- Math proficiency
- 51% ▼ -5.00%
- Reading proficiency
- 51% ▼ -3.00%
- Median HH income
- $46,270
- Composite
- 43.27/100
- National rank
- #3046
- State rank
- #31 of 73 in FL
Livability — Clearwater
- Score
- 82/100
- State rank
- #60
- US rank
- #988
Category grades
Schools grade is shown separately in the Schools card above.
Census & demographics
- Census place
- Clearwater, FL
- County
- Pinellas County · 939,478 people
- City population
- 170,933
- Metro
- Tampa-St. Petersburg-Clearwater, FL
- Population (ZIP)
- 32,201
- Household income
- $61,872
- Rent vs Own
- Severe rent burden
- 1868.0
Population outlook (Pinellas County) Hauer SSP2
- Today (2025)
- 1,027,532 people
- By 2030
- 1,063,586 · +3.5%
- By 2040
- 1,125,020 · +9.5%
- By 2050
- 1,168,637 · +13.7%
- By 2075
- 1,265,188 · +23.1%
- By 2100
- 1,260,357 · +22.7%
Race, ethnicity, and origin ACS 2023
- Neighborhood character
- Majority White (64%)
- Race & ethnicity
- White 64% Hispanic / Latino 18% Black 11% Two or more races 9% Asian 3%
- Hispanic origin (detail)
- Mexican 8% Puerto Rican 5%
- Common ancestry
- Romanian 3% Lithuanian 2% Slovak 2%
- Foreign-born
- 16% · Canada
- Languages at home
- 79% English-only · Spanish 14% Other Indo-European 2% Russian/Polish/Slavic 2%
Political lean MEDSL · Pinellas
- 2024 margin
- Lean R (+5.2) · D 46.9% · R 52.1%
- 2008→2024 swing
- -13.5pp toward R · 2008: 8.3pp · 2024: -5.2pp
- All cycles
- 2024: R+5.2 2020: D+0.2 2016: R+1.1 2012: D+5.6 2008: D+8.3
Not yet ingested
- Civics
- —
Market trends
- HPI YoY
- ▼ -438.74%
- Current HPI
- 354.6792
- Rent YoY
- ▼ -2.22%
- Metro
- Tampa-St. Petersburg-Clearwater, FL
- State GDP YoY
- ▲ 3.28%
- F500 in state
- 36
Industry mix (Fortune 500 HQ in FL)
| Industry | F500 HQs | Revenue |
|---|---|---|
| Industrial Technology | 2 | $29B |
|
||
| Insurance | 2 | $17B |
|
||
| Retail | 1 | $60B |
|
||
| Technology Distribution | 1 | $58B |
|
||
| Homebuilding | 1 | $35B |
|
||
| Technology Manufacturing | 1 | $35B |
|
||
Price history
+140.0% since first listed22 events — show timeline
- 2026-04-16 Price Changed $120,000 Stellar MLS as Distributed by MLS Grid
- 2026-03-05 Price Changed $125,000 Stellar MLS as Distributed by MLS Grid
- 2026-01-31 Listed $129,000 Stellar MLS as Distributed by MLS Grid
- 2025-04-24 Listing Removed — Stellar MLS as Distributed by MLS Grid
- 2025-01-08 Price Changed $169,900 Stellar MLS as Distributed by MLS Grid
- 2024-08-21 Listed $174,500 Stellar MLS as Distributed by MLS Grid
- 2024-08-14 Listing Removed — Stellar MLS as Distributed by MLS Grid
- 2024-06-27 Price Changed $175,500 Stellar MLS as Distributed by MLS Grid
- 2024-06-10 Price Changed $179,500 Stellar MLS as Distributed by MLS Grid
- 2024-05-04 Listed $187,500 Stellar MLS as Distributed by MLS Grid
- 2018-05-17 Sold (Public Records) $71,900 Public Records
- 2018-05-16 Sold (MLS) $71,900 Stellar MLS as Distributed by MLS Grid
- 2018-05-07 Pending — Stellar MLS as Distributed by MLS Grid
- 2018-04-09 Relisted — Stellar MLS as Distributed by MLS Grid
- 2018-03-24 Pending — Stellar MLS as Distributed by MLS Grid
- 2018-03-22 Pending — Stellar MLS as Distributed by MLS Grid
- 2018-03-16 Pending — Stellar MLS as Distributed by MLS Grid
- 2018-03-03 Listed $75,900 Stellar MLS as Distributed by MLS Grid
- 2016-09-22 Sold (Public Records) $45,000 Public Records
- 2016-08-29 Sold (MLS) $45,000 Stellar MLS as Distributed by MLS Grid
- 2016-07-15 Contingent — Stellar MLS as Distributed by MLS Grid
- 2016-06-21 Listed $50,000 Stellar MLS as Distributed by MLS Grid
Property tax history
+8.8%/yrLatest (2025): $2,044 · +5.5% YoY. Source: county tax records.
Cash-flow waterfall
monthlySold comps — $/sqft
last 12 mo · ≤1 miLoading sold comps…