9444 Harbour Point Dr #264 · Elk Grove, CA
Flood risk No data
- FEMA flood zone
- —
- Chance of flooding over 30 yrs
- —
- Est. flood insurance / yr
- —
Fire risk No data
- Est. fire insurance / yr
- —
Heat risk No data
- Hot days now (above threshold)
- —
- Hot days in 30 yrs
- —
Wind risk No data
- Chance of severe wind over 30 yrs
- —
Air-quality risk No data
- Unhealthy air days now
- —
- Unhealthy air days in 30 yrs
- —
Risk factors via First Street. Map © Google.
Why this score? — see what drove the D- grade
The composite is a weighted blend of 9 inputs, each scored 0–100. Each bar is that input's sub-score; the figure is the points it added to the 100-point composite (weight × sub-score).
- ARV discount +14.9/15.0
- Cash flow +7.3/30.0
- Schools +4.1/10.0
- Livability +3.6/5.0
- Rent growth +2.9/5.0
- 1% rule +2.5/10.0
- Condition / age +2.5/5.0
- DSCR +1.4/10.0
- Appreciation +0.0/10.0
$284,999
🖨 Deal sheet (PDF) 📄 Offer letter ✓ Due diligence
Listing remarks
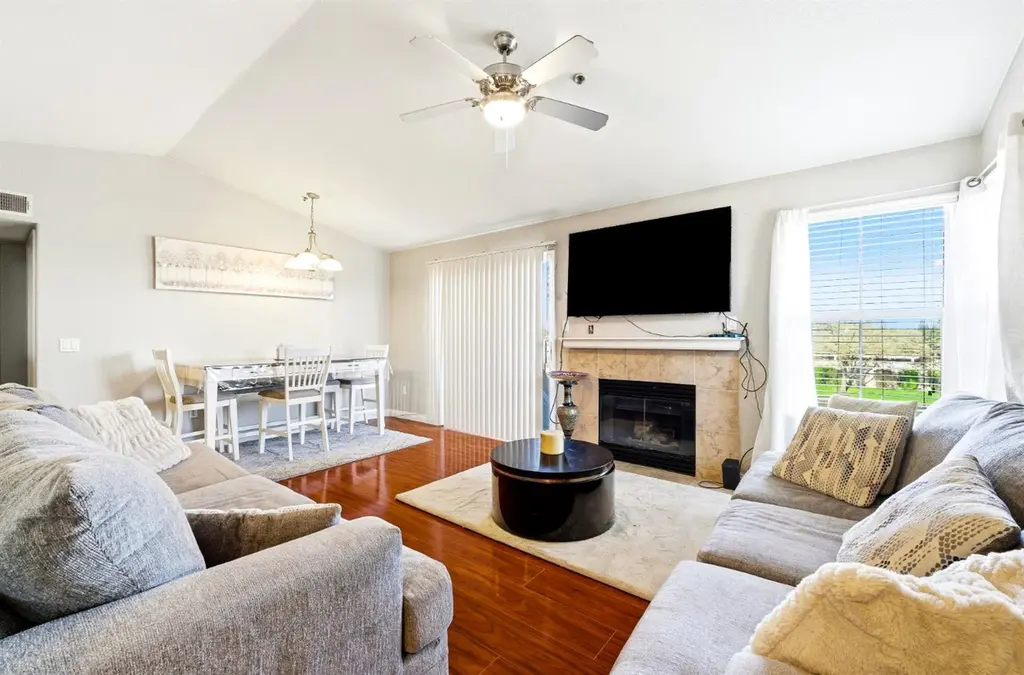
Welcome to Somerfield at Lakeside, a gated community in Elk Grove's Laguna area. This upstairs 1 bedroom, 1 bathroom condo offers 767 sq ft with a functional layout and no neighbors above. Open living area, well-designed kitchen, and dedicated indoor laundry area. Clean, simple, and easy to maintain. Conveniently located near I-5, shopping, dining, parks, and Elk Grove schools. Community amenities include pool, fitness center, clubhouse, and maintained grounds. A great opportunity for a buyer ready to transition from renting to ownership.
Key facts
- Gated community
- Fitness center
- Clubhouse
Tags
Neighborhood map
What this means for you Summary
Snapshot
- This is a 1-bed/1.0-bath condo listed at $285k.
Deal economics
- At list price, monthly cash flow is $-385 ($-5k/yr) — negative.
- To cash-flow at today's rent, offer at most $217k (23.9% below list).
- To meet the 1% rule (rent ≥ 1% of price), the offer needs to be $214k (24.9% below list).
- Recommended offer: $214k (24.9% below list) — sets the bar for 1% rule.
- Cap rate 4.7% vs local median 2.8% in Elk Grove — top-decile yield for the area; either an underpriced asset or a hidden risk that comps aren't pricing in. Stress-test before assuming the spread holds.
Location & tenants
- Location reads 71/100 on livability (#212 in CA) — a middle-class / working-renter tenant base. Strengths: employment A+, housing A+, crime B+; Watch: commute F, cost of living F.
- Elk Grove Unified (suburban): math 40% / reading 51% proficiency, ranked #165 of 517 in CA (top 32%) — families likely to look elsewhere, expect single-tenant / working-renter base with shorter leases.
- Market conditions: Rents rising (+1.6%/yr); 184 active listings in the ZIP; 4 comparable units currently listed for rent nearby; rentals leasing fast (median 3d on market — plan ~1-2 weeks tenant-placement turnaround); high-income renter base; 6,825 units permitted in Sacramento County in 2024 (1,752 in 5+ unit buildings).
Forward outlook
- Local home prices are declining (-3.0%/yr); year-one equity from $2k of loan paydown is wiped out by about $9k of value loss. Plan a longer hold.
- Sacramento County population projected at +17% by 2050 — long-run rental-demand tailwind backs the buy-and-hold thesis.
Negotiation context
- It's been on market 73 days — a 6% lower offer ($268k) is reasonable based on typical stale-listing flexibility.
Questions for the listing agent
- What do current leases actually rent for vs. the listed asking? Can we see a recent rent roll and the last 12 months of T-12 income?
- It's been on market 73 days. Have you received any prior offers? Is the seller open to a 25% concession, seller financing, or rate buy-down credit?
- What does the HOA fee cover, when was the last increase, and are there any pending special assessments or reserve-fund shortfalls?
- Any open or pending special assessments — roof, HVAC, plumbing, elevator, façade? What's the per-unit balance and payoff schedule, and is the seller paying it off at close or rolling it to the buyer?
- Why hasn't it sold? Are there any deal-killer items the seller is aware of (foundation, flood, title, zoning, code violations)?
- Is there a deadline driving the sale (1031 exchange, divorce, estate, relocation)? That informs how much negotiation room exists.
- Schools are B-rated — typically a magnet for longer-tenancy family renters. What's the average tenant stay here, and is there a school-zone premium baked into asking?
- The area grade is low — what's the realistic commute time and amenity access for the typical tenant pool here? Any planned neighborhood developments (good or bad) we should know about?
- What's the average days-on-market for RENTAL listings here right now (not sales)? A rising rental-DOM trend means longer vacancies and softer asking-rent achievability than the comps imply.
- What's the recent tenant-quality profile in this submarket — average credit score on applications, eviction rate, late-payment / NSF rate, and stable-employment percentage? A property-management company in the area should have these aggregated.
- How much new apartment / multifamily construction is in the pipeline within 1–3 miles? Heavy new supply (>2% of stock underway) typically softens rents 12–24 months out; light construction supports rent growth.
Investment metrics
- 1% rule
- 0.75% ✗
- Cap rate
- 4.67%
- Cash-on-cash
- -5.79%
- DSCR
- 0.74
- GRM
- 11.1
CMA / ARV
- ARV (median comp)
- $341,305
- List price
- $284,999
- Delta
- -16.50%
- Verdict
- UNDERPRICED
- Comps
- 6 within 1.0 mi
Projected returns pro-forma
-3.0% appreciation · 1.59% rent growth · sell at horizon
- IRR
- -27.9%
- Equity multiple
- 0.08×
- Total profit
- $-73,605
- Equity at exit
- $42,494
- IRR
- -32.9%
- Equity multiple
- -0.34×
- Total profit
- $-107,222
- Equity at exit
- $24,642
Cash invested: $79,800 (down + closing). Projections, not guarantees.
Landlord ↔ Tenant lean methodology
- Overall (STATE)
- 18 Strongly Tenant-Friendly
- State California
- 18 Strongly Tenant-Friendly · D+13
- County
- — inherits STATE
- City
- — inherits STATE
ZIP-level market 95758
- Home prices YoY
- -23.5%
- Rents YoY
- 1.6%
- Active inventory
- 184
- Price-to-rent
- 11.1×
Monthly cashflow live
- Estimated rent
- $2,140 medium interval (Pro) →
- Mortgage (P&I)
- −$1,495
- Tax from tax record
- −$282 /mo · $3,388/yr
- Insurance
- −$119
- HOA
- −$180
- Vacancy / Maint / Mgmt
- −$449
- Net cashflow
- $-385
Break-even live
Sensitivity live
| Price | -10% $-224 | -5% $-304 | +0% $-385 | +5% $-466 | +10% $-546 |
|---|---|---|---|---|---|
| Rent | -10% $-554 | -5% $-470 | +0% $-385 | +5% $-301 | +10% $-216 |
| Rate | -1.0pp $-242 | -0.5pp $-313 | base $-385 | +0.5pp $-459 | +1.0pp $-534 |
UW: 25.0% down · 7.5% · 30yr · 1.5% tax · 5.0% vac · 8.0% maint · 8.0% mgmt
Financing live
Cash to close
- Down payment
- $71,250
- Closing costs
- $8,550
- Reserves months
- —
- Total cash needed
- —
Loan-product check · same deal, 3 products live
Conventional
25% down · 7.5% · 30yr
- Down + closing
- —
- Monthly P&I
- —
- Monthly cashflow
- —
- DSCR
- —
- Eligible?
- —
Personal DTI + credit; lowest rate.
DSCR
20% down · 8.5% · 30yr
- Down + closing
- —
- Monthly P&I
- —
- Monthly cashflow
- —
- DSCR
- —
- Eligible?
- —
No personal income docs; deal must DSCR.
Hard money
10% down · 12.0% · 12mo
- Down + closing
- —
- Monthly P&I
- —
- Monthly cashflow
- —
- DSCR
- —
- Eligible?
- —
Short-term bridge; refi at stabilization.
Rent comps 4 comps
| Address | Beds | Baths | Sqft | Rent | $/sqft | DOM | Units | Dist |
|---|---|---|---|---|---|---|---|---|
| 9444 Harbour Point Dr Elk Grove, CA | 1.0–3.0 | 1.0–2.0 | 1003 | $2,224 | $2.22 | 2d | 10 | 0.01mi |
| 9130 Nolan St Elk Grove, CA | 1.0–3.0 | 1.0–2.0 | 980 | $1,965 | $2.00 | 2d | 4 | 0.88mi |
| 3300 Renwick Ave Elk Grove, CA | 1.0–3.0 | 1.0–2.0 | 980 | $1,909 | $1.95 | 3d | 2 | 1.06mi |
| 10270 E Taron Dr Elk Grove, CA | 1.0–3.0 | 1.0–2.0 | 1006 | $2,133 | $2.12 | 2d | 16 | 1.13mi |
HOA detail condo
- Monthly dues
- $180 · $2,160/yr
- Likely covers
- landscapingpoolgymsecurity
- Assessments
- None detected in remarks — confirm with the listing agent.
Listing history 9 events
-
2026-06-13statusdays on market $284,999 Pending 73 DOM
-
2026-06-09days on market $284,999 Active 71 DOM
-
2026-06-08days on market $284,999 Active 70 DOM
-
2026-06-07pricedays on market $284,999 Active 69 DOM
-
2026-06-05days on market $289,999 Active 66 DOM
-
2026-06-03days on market $289,999 Active 65 DOM
-
2026-06-02days on market $289,999 Active 64 DOM
-
2026-06-01days on market $289,999 Active 63 DOM
-
2026-05-31days on market $289,999 Active 62 DOM
ⓘ Source: listings_history table (triggers on properties + properties_extension) + one-shot
backfill from property_details.listing_events for pre-trigger history.
Tax reassessment forecast CA · Resets to sale price
- Current annual tax
- $3,388 · $282/mo
- Projected year-2 tax
- $3,387 · $282/mo
- Expected delta
- $0/yr ($0/mo · -0.0%)
ⓘ Screening estimate from a state-policy table — verify with the county assessor before closing.
Nearby sold comps map
Loading sold comps map…
Walkable amenities ~0.75 mi
Loading nearby amenities…
Taxation est. · year 1
- Rental income
- $25,679
- − Mortgage interest
- −$15,964
- − Property taxes
- −$3,388
- − Insurance
- −$1,425
- − Repairs & maintenance
- −$2,054
- − Management
- −$2,054
- − HOA
- −$2,160
- − Depreciation
- −$8,291
- Taxable loss
- −$9,658
- Est. tax savings @ 24.0%
- +$2,318
- After-tax cash flow
- $-2,303/yr
For passive investors: Depreciation is non-cash, so a rental often shows a tax loss while cash-flowing — sheltering income. Rental losses are passive: they offset passive income freely, and up to $25,000/yr can offset ordinary (W-2) income if you actively participate and your MAGI is under $100k (phasing out to $0 by $150k); unused losses carry forward. On sale, claimed depreciation is recaptured at up to 25%, and gains may owe capital-gains tax (a 1031 exchange can defer both). Figures are a year-1 estimate at your 24.0% rate — not tax advice; consult a CPA.
Schools (NCES district)
- District
- Elk Grove Unified
- NCES district ID
- 0612330
- Math proficiency
- 40% ▼ -5.00%
- Reading proficiency
- 51% ▼ -5.00%
- Median HH income
- $67,860
- Composite
- 40.72/100
- National rank
- #3658
- State rank
- #165 of 517 in CA
Livability — Elk Grove
- Score
- 71/100
- State rank
- #212
- US rank
- #6681
Category grades
Schools grade is shown separately in the Schools card above.
Census & demographics
- Census place
- Elk Grove, CA
- County
- Sacramento County · 1,539,646 people
- City population
- 190,119
- Metro
- Sacramento-Roseville-Folsom, CA
- Population (ZIP)
- 65,725
- Household income
- $117,017
- Rent vs Own
- Severe rent burden
- 1653.0
Population outlook (Sacramento County) Hauer SSP2
- Today (2025)
- 1,660,763 people
- By 2030
- 1,732,990 · +4.3%
- By 2040
- 1,855,755 · +11.7%
- By 2050
- 1,941,335 · +16.9%
- By 2075
- 2,046,162 · +23.2%
- By 2100
- 1,961,444 · +18.1%
Race, ethnicity, and origin ACS 2023
- Neighborhood character
- Highly diverse neighborhood (Simpson 0.77)
- Race & ethnicity
- White 32% Asian 27% Hispanic / Latino 19% Two or more races 14% Black 12% Pacific Islander 2%
- Hispanic origin (detail)
- Mexican 15%
- Common ancestry
- Russian 2% Romanian 1% Italian 1%
- Foreign-born
- 25% · Canada, China, Vietnam
- Languages at home
- 64% English-only · Spanish 10% Chinese 6% Other Indo-European 6%
Political lean MEDSL · Sacramento
- 2024 margin
- D (+19.7) · D 58.1% · R 38.4% · Other 3.5%
- 2008→2024 swing
- +0.7pp no change · 2008: 19.0pp · 2024: 19.7pp
- All cycles
- 2024: D+19.7 2020: D+25.3 2016: D+23.7 2012: D+16.3 2008: D+19.0
Not yet ingested
- Civics
- —
Market trends
- HPI YoY
- ▼ -95.00%
- Current HPI
- 309.0545
- Rent YoY
- ▲ 1.59%
- Metro
- Sacramento-Roseville-Folsom, CA
- State GDP YoY
- ▲ 3.21%
- F500 in state
- 116
Industry mix (Fortune 500 HQ in CA)
| Industry | F500 HQs | Revenue |
|---|---|---|
| Technology | 27 | $1,492B |
|
||
| Financial Services | 3 | $174B |
|
||
| Retail | 3 | $44B |
|
||
| Insurance | 3 | $26B |
|
||
| Media / Entertainment | 2 | $115B |
|
||
| Pharmaceuticals / Biotech | 2 | $62B |
|
||
Property tax history
+2.8%/yrLatest (2025): $3,388 · -0.2% YoY. Source: county tax records.
Cash-flow waterfall
monthlySold comps — $/sqft
last 12 mo · ≤1 miLoading sold comps…