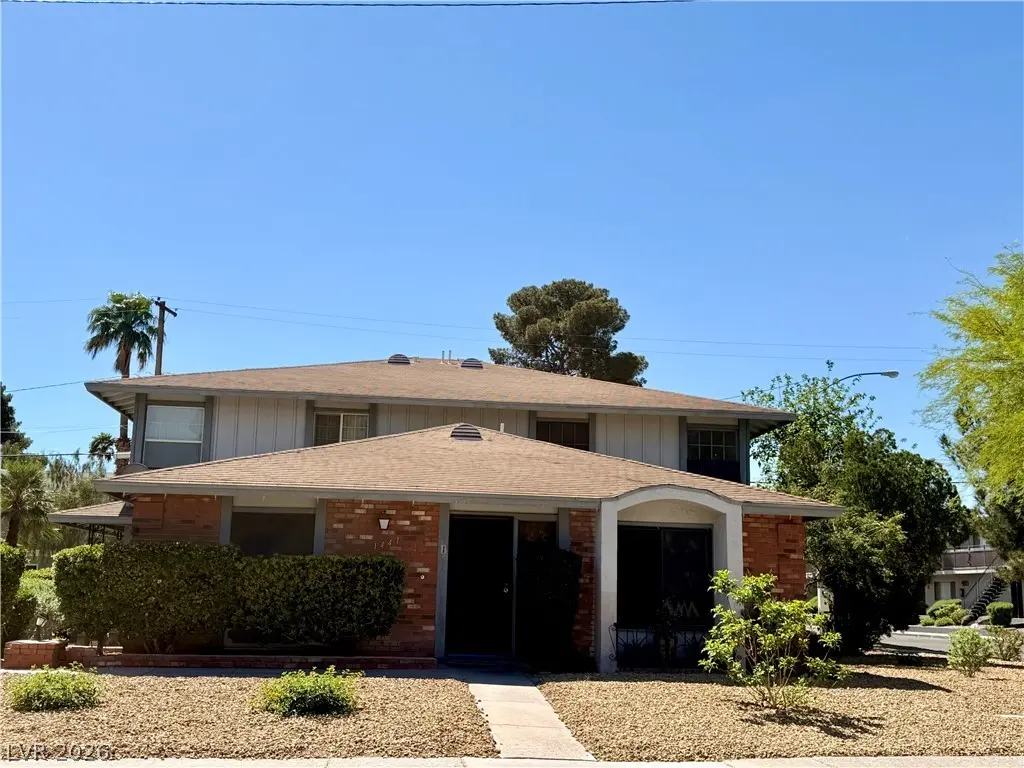
1441 Dorothy Ave #2 · Paradise, NV
Flood risk 1/10 · Minimal
- FEMA flood zone
- X (unshaded)
- Chance of flooding over 30 yrs
- 0.0%
- Est. flood insurance / yr
- $507 – $1,088
Fire risk 1/10 · Minimal
- Est. fire insurance / yr
- $490 – $910
Heat risk 8/10 · Major
- Hot days now (above 107°F)
- 7 days/yr
- Hot days in 30 yrs
- 17 days/yr
Wind risk 1/10 · Minimal
- Chance of severe wind over 30 yrs
- —
Air-quality risk 3/10 · Minor
- Unhealthy air days now
- 3 days/yr
- Unhealthy air days in 30 yrs
- 4 days/yr
Risk factors via First Street. Map © Google.
Why this score? — see what drove the D grade
The composite is a weighted blend of 9 inputs, each scored 0–100. Each bar is that input's sub-score; the figure is the points it added to the 100-point composite (weight × sub-score).
- Cash flow +13.8/30.0
- ARV discount +7.5/15.0
- 1% rule +5.1/10.0
- DSCR +4.2/10.0
- Livability +3.8/5.0
- Schools +2.6/10.0
- Condition / age +2.5/5.0
- Rent growth +2.0/5.0
- Appreciation +0.0/10.0
$159,000
🖨 Deal sheet (PDF) 📄 Offer letter ✓ Due diligence
Listing remarks MLS
Beautiful and clean two story, two bedroom condo across from UNLV. Ideally located within the community, this unit sits across from the pool and park! Home features upgraded tile throughout, upgraded tile in bath and shower, newer carpet, appliances, windows, blinds, paint and air conditioner/heater.
Key facts
- Fresh paint
- Two story condo
- Newer water heater
Tags
Property features AI
Finance
- Other: Annual tax amount reported
- Financial info: Lease in place: $1,250 monthly, lease expires 2027-02-01
- HOA & community: Homeowners association (University Crest); Monthly association fee of $300; HOA covers association management, grounds maintenance, and sewer; Community amenities include clubhouse, playground, pool, and tennis courts
Exterior
- Parking: Assigned covered parking; Detached carport; 1 carport space
- Utilities: Public water; Public sewer; Underground utilities; No photovoltaics; Electric service
- Home design: Multi-family property; North-facing; 2 stories; Resale unit; Has attached property
- Construction: Pitched roof; Resale construction
- Exterior features: Landscaped; Community pool; No additional exterior structures listed
Interior
- Kitchen: Breakfast bar/counter; Laminate countertops; Tile flooring; Dishwasher; Electric range; Disposal; Refrigerator
- Bedrooms: 2 possible bedrooms; Bedroom features include ceiling fan, ceiling light, and closet
- Flooring: Carpet; Ceramic tile
- Bathrooms: 1 full bathroom
- Heating & cooling: Central heating (electric); Central air conditioning (electric)
- Interior features: Ceiling fans; Window treatments and blinds; Double-pane windows; Unfurnished
- Laundry & utility: Washer and dryer included; Electric dryer hookup; Laundry closet on upper level
Neighborhood map
What this means for you Summary
Snapshot
- This is a 2-bed/1.0-bath condo listed at $159k.
Deal economics
- At list price, monthly cash flow is $16 ($191/yr) — positive.
- The deal already cash-flows at list — no discount required.
- Meets the 1% rule at list price ($2k rent vs $159k).
- Recommended offer: $149k (6.0% below list) — sets the bar for market timing.
Location & tenants
- Location reads 76/100 on livability (#10 in NV, #3,494 nationally) — a middle-class / working-renter tenant base. Strengths: commute A+, housing A-, cost of living B; Watch: employment D+, crime D-.
- Clark County School District (urban): math 21% / reading 39% proficiency, ranked #11 of 17 in NV (top 65%) — families likely to look elsewhere, expect single-tenant / working-renter base with shorter leases.
- Zoned schools: Rowe Lewis E Es (math 17% / reading 32%, grade F, #237 of 402 statewide, top 63%, 588 students, 100% FRL); Orr William E Ms (math 5% / reading 18%, grade F, #103 of 109 statewide, top 95%, 815 students, 100% FRL); Del Sol Academy of Performing Arts Hs (math 10% / reading 33%, grade F, #91 of 131 statewide, top 70%, 2,511 students, 100% FRL) — zoned schools average 100% FRL vs 52% district-wide (48 pts higher); higher-poverty schools than district average — tighter screening recommended.
- Market conditions: Rents soft (-1.8%/yr); 200 active listings in the ZIP; 31 comparable units currently listed for rent nearby; rentals at typical pace (median 26d on market — plan ~3-4 weeks tenant-placement turnaround); 14,754 units permitted in Clark County in 2024 (2,301 in 5+ unit buildings).
- This rent runs 41% of the median local income ($47k/yr) — at the standard rent-burdened threshold; future hikes will face affordability resistance.
Forward outlook
- Local home prices are declining (-3.0%/yr); year-one equity from $1k of loan paydown is wiped out by about $5k of value loss. Plan a longer hold.
- Clark County population projected at +36% by 2050 — long-run rental-demand tailwind backs the buy-and-hold thesis.
Negotiation context
- It's been on market 62 days — a 6% lower offer ($149k) is reasonable based on typical stale-listing flexibility.
- 9 sale attempts since 16y ago with the ask held roughly flat each time — persistent listings suggest the price (not the market) is what's stuck; bring a comps-based counter.
- Current owner paid $125k; 27% above their basis — modest negotiation headroom, anchor on the comps not their cost.
Risks & watch-outs
- Climate carrying-cost: extreme-heat days projected 7→17/yr by 2055 (HVAC capex compounding) — expect insurance premiums to compound above CPI over the hold.
Questions for the listing agent
- It's been on market 62 days. Have you received any prior offers? Is the seller open to a 6% concession, seller financing, or rate buy-down credit?
- Built in 1972 — when were the roof, HVAC, electrical panel, plumbing, and water heater last replaced?
- What does the HOA fee cover, when was the last increase, and are there any pending special assessments or reserve-fund shortfalls?
- Any open or pending special assessments — roof, HVAC, plumbing, elevator, façade? What's the per-unit balance and payoff schedule, and is the seller paying it off at close or rolling it to the buyer?
- Why hasn't it sold? Are there any deal-killer items the seller is aware of (foundation, flood, title, zoning, code violations)?
- Is there a deadline driving the sale (1031 exchange, divorce, estate, relocation)? That informs how much negotiation room exists.
- Schools are F-rated, which usually means shorter tenancies and higher turnover. Who's the typical renter profile here, and what's been the actual vacancy rate?
- Crime grade is D in this area — have there been break-ins, vandalism, or insurance claims at this property in the last 3 years? What carrier currently insures it and at what premium?
- The area grade is low — what's the realistic commute time and amenity access for the typical tenant pool here? Any planned neighborhood developments (good or bad) we should know about?
- What's the average days-on-market for RENTAL listings here right now (not sales)? A rising rental-DOM trend means longer vacancies and softer asking-rent achievability than the comps imply.
- What's the recent tenant-quality profile in this submarket — average credit score on applications, eviction rate, late-payment / NSF rate, and stable-employment percentage? A property-management company in the area should have these aggregated.
- How much new apartment / multifamily construction is in the pipeline within 1–3 miles? Heavy new supply (>2% of stock underway) typically softens rents 12–24 months out; light construction supports rent growth.
Investment metrics
- 1% rule
- 1.01% ✓
- Cap rate
- 6.41%
- Cash-on-cash
- 0.43%
- DSCR
- 1.02
- GRM
- 8.3
CMA / ARV
No comps found within radius.
Projected returns pro-forma
-3.0% appreciation · 0.0% rent growth · sell at horizon
- IRR
- -19.4%
- Equity multiple
- 0.34×
- Total profit
- $-29,333
- Equity at exit
- $23,707
- IRR
- -21.6%
- Equity multiple
- 0.06×
- Total profit
- $-41,921
- Equity at exit
- $13,747
Cash invested: $44,520 (down + closing). Projections, not guarantees.
Landlord ↔ Tenant lean methodology
- Overall (STATE)
- 71 Landlord-Friendly
- State Nevada
- 71 Landlord-Friendly · R+1
- County
- — inherits STATE
- City
- — inherits STATE
ZIP-level market 89119
- Rents YoY
- -1.8%
- Active inventory
- 200
- Price-to-rent
- 8.3×
Monthly cashflow live
- Estimated rent
- $1,604 high interval (Pro) →
- Mortgage (P&I)
- −$834
- Tax from tax record
- −$51 /mo · $612/yr
- Insurance
- −$66
- HOA
- −$300
- Lot rent
- −$0
- Vacancy / Maint / Mgmt
- −$337
- Net cashflow
- $16
Break-even live
Sensitivity live
| Price | -10% $106 | -5% $61 | +0% $16 | +5% $-29 | +10% $-74 |
|---|---|---|---|---|---|
| Rent | -10% $-111 | -5% $-47 | +0% $16 | +5% $79 | +10% $143 |
| Rate | -1.0pp $96 | -0.5pp $56 | base $16 | +0.5pp $-25 | +1.0pp $-67 |
UW: 25.0% down · 7.5% · 30yr · 1.5% tax · 5.0% vac · 8.0% maint · 8.0% mgmt
Financing live
Cash to close
- Down payment
- $39,750
- Closing costs
- $4,770
- Reserves months
- —
- Total cash needed
- —
Loan-product check · same deal, 3 products live
Conventional
25% down · 7.5% · 30yr
- Down + closing
- —
- Monthly P&I
- —
- Monthly cashflow
- —
- DSCR
- —
- Eligible?
- —
Personal DTI + credit; lowest rate.
DSCR
20% down · 8.5% · 30yr
- Down + closing
- —
- Monthly P&I
- —
- Monthly cashflow
- —
- DSCR
- —
- Eligible?
- —
No personal income docs; deal must DSCR.
Hard money
10% down · 12.0% · 12mo
- Down + closing
- —
- Monthly P&I
- —
- Monthly cashflow
- —
- DSCR
- —
- Eligible?
- —
Short-term bridge; refi at stabilization.
Rent comps 31 comps
| Address | Beds | Baths | Sqft | Rent | $/sqft | DOM | Units | Dist |
|---|---|---|---|---|---|---|---|---|
| 1481 Lorilyn Ave #4 Las Vegas, NV | 1.0 | 1.0 | 792 | $1,835 | $2.32 | 46d | 1 | 0.05mi |
| 1577 Elizabeth Ave #1 Las Vegas, NV | 2.0 | 2.0 | 1064 | $1,600 | $1.50 | 46d | 1 | 0.12mi |
| 4801 Spencer St Las Vegas, NV | 1.0–3.0 | 1.0–2.0 | 1072 | $1,548 | $1.44 | 46d | 14 | 0.21mi |
| 4700 S Maryland Pkwy Las Vegas, NV | 1.0 | 1.0 | 409 | $1,382 | $3.37 | 46d | 48 | 0.22mi |
| 1635 E Tropicana Ave Las Vegas, NV | 3.0 | 1.0–3.0 | 832 | $2,085 | $2.50 | 0d | 68 | 0.24mi |
| 5045 Spencer St Unit B Las Vegas, NV | 2.0 | 1.5 | 828 | $1,610 | $1.94 | 46d | 1 | 0.46mi |
| 5187 Caliente St #96 Las Vegas, NV | 2.0 | 2.0 | 994 | $1,595 | $1.60 | 46d | 1 | 0.55mi |
| 2220 Pine Breeze Ln #101 Las Vegas, NV | 1.0 | 1.0 | 758 | $1,100 | $1.45 | 10d | 1 | 0.72mi |
| 5055 Jeffreys St Las Vegas, NV | 1.0–2.0 | 1.0–2.0 | 750 | $1,646 | $2.19 | 1d | 15 | 0.74mi |
| 4330 Channel 10 Dr Las Vegas, NV | 1.0–2.0 | 1.0–2.0 | 807 | $1,850 | $2.29 | 1d | 27 | 0.83mi |
| 5064 Jeffreys St #201 Las Vegas, NV | 2.0 | 2.0 | 1000 | $1,300 | $1.30 | 26d | 1 | 0.84mi |
| 1061 E Flamingo Rd Las Vegas, NV | 1.0–2.0 | 1.0–2.0 | 967 | $2,203 | $2.28 | 17d | 35 | 0.85mi |
| 4255 Channel 10 Dr Las Vegas, NV | 1.0–3.0 | 1.0–2.0 | 899 | $1,488 | $1.66 | 5d | 7 | 0.87mi |
| 4330 S Eastern Ave Las Vegas, NV | 3.0 | 1.0–2.0 | 802 | $1,491 | $1.86 | 1d | 6 | 0.95mi |
| 4150 Channel 10 Dr Las Vegas, NV | 1.0 | 1.0 | 600 | $1,245 | $2.08 | 4d | 2 | 0.96mi |
| 4775 Topaz St Las Vegas, NV | 1.0–3.0 | 1.0–2.0 | 1022 | $1,284 | $1.26 | 1d | 9 | 0.98mi |
| 4770 Topaz St #6 Las Vegas, NV | 2.0 | 1.5 | 928 | $1,350 | $1.45 | 26d | 1 | 1.05mi |
| 4770 Topaz St #37 Las Vegas, NV | 2.0 | 2.5 | 928 | $1,395 | $1.50 | 6d | 1 | 1.06mi |
| 4770 S Topaz St Las Vegas, NV | 2.0 | 1.5 | 986 | $1,785 | $1.81 | 26d | 1 | 1.07mi |
| 2568 Paradise Village Way Las Vegas, NV | 2.0 | 1.0 | 920 | $1,275 | $1.39 | 7d | 1 | 1.08mi |
| 4770 Topaz St #50 Las Vegas, NV | 2.0 | 2.0 | 928 | $1,300 | $1.40 | 26d | 1 | 1.09mi |
| 1700 E Viking Rd Las Vegas, NV | 2.0 | 2.0 | 1085 | $1,662 | $1.53 | 46d | 3 | 1.12mi |
| 818 E Flamingo Rd Las Vegas, NV | 1.0–2.0 | 1.0–2.5 | 1158 | $2,895 | $2.50 | 1d | 33 | 1.15mi |
| 1601 E Katie Ave Las Vegas, NV | 1.0–2.0 | 1.0–2.0 | 809 | $1,852 | $2.29 | 46d | 13 | 1.16mi |
| 3930 University Center Dr Las Vegas, NV | 2.0 | 2.0–3.0 | 1200 | $1,725 | $1.44 | 46d | 2 | 1.20mi |
| 4960 Harrison Dr #107 Las Vegas, NV | 1.0 | 1.0 | 616 | $1,200 | $1.95 | 10d | 1 | 1.23mi |
| 4050 Pacific Harbors Dr Las Vegas, NV | 2.0 | 2.0 | 991 | $1,642 | $1.66 | 46d | 2 | 1.31mi |
| 4050 Pacific Harbors Dr Las Vegas, NV | 2.0 | 2.0 | 987 | $1,475 | $1.49 | 1d | 4 | 1.31mi |
| 5150 Mandalay Springs Dr #203 Las Vegas, NV | 2.0 | 2.0 | 1020 | $1,294 | $1.27 | 26d | 1 | 1.42mi |
| 3035 Casey Dr #201 Las Vegas, NV | 2.0 | 2.0 | 987 | $1,350 | $1.37 | 1d | 1 | 1.47mi |
| 3047 Casey Dr #103 Las Vegas, NV | 2.0 | 2.0 | 987 | $1,550 | $1.57 | 46d | 1 | 1.48mi |
HOA detail condo
- Monthly dues
- $300 · $3,600/yr
- Likely covers
- pool
- Assessments
- None detected in remarks — confirm with the listing agent.
Listing history 43 events
-
2026-06-22days on market $159,000 Active 62 DOM
-
2026-06-21days on market $159,000 Active 61 DOM
-
2026-06-18days on market $159,000 Active 58 DOM
-
2026-06-17days on market $159,000 Active 57 DOM
-
2026-06-16days on market $159,000 Active 56 DOM
-
2026-06-15days on market $159,000 Active 55 DOM
-
2026-06-13days on market $159,000 Active 53 DOM
-
2026-06-09days on market $159,000 Active 49 DOM
-
2026-06-08days on market $159,000 Active 48 DOM
-
2026-06-07days on market $159,000 Active 47 DOM
-
2026-06-03days on market $159,000 Active 43 DOM
-
2026-06-02days on market $159,000 Active 42 DOM
-
2026-06-01days on market $159,000 Active 41 DOM
-
2026-05-31days on market $159,000 Active 40 DOM
-
2026-04-21$159,000 Active 938-char remark
-
2026-02-06historical $1,250
-
2025-12-05price $1,250
-
2025-09-17$1,400
-
2023-12-11historical $1,200
-
2023-12-03price $1,200
-
2023-11-16$1,250
-
2023-09-27status Pending
-
2023-09-27historical
-
2023-09-19price $190,000
-
2023-08-16status Active
-
2023-08-11status Pending
-
2023-07-17$192,500 Active
-
2019-05-21soldstatus $125,000 Sold
Show marketing remark (301 chars)
Beautiful and clean two story, two bedroom condo across from UNLV. Ideally located within the community, this unit sits across from the pool and park! Home features upgraded tile throughout, upgraded tile in bath and shower, newer carpet, appliances, windows, blinds, paint and air conditioner/heater.
-
2019-05-20soldstatus $125,000
-
2019-04-01status Pending
Show marketing remark (301 chars)
Beautiful and clean two story, two bedroom condo across from UNLV. Ideally located within the community, this unit sits across from the pool and park! Home features upgraded tile throughout, upgraded tile in bath and shower, newer carpet, appliances, windows, blinds, paint and air conditioner/heater.
-
2019-03-06status Active
Show marketing remark (301 chars)
Beautiful and clean two story, two bedroom condo across from UNLV. Ideally located within the community, this unit sits across from the pool and park! Home features upgraded tile throughout, upgraded tile in bath and shower, newer carpet, appliances, windows, blinds, paint and air conditioner/heater.
-
2019-02-28status Pending
Show marketing remark (301 chars)
Beautiful and clean two story, two bedroom condo across from UNLV. Ideally located within the community, this unit sits across from the pool and park! Home features upgraded tile throughout, upgraded tile in bath and shower, newer carpet, appliances, windows, blinds, paint and air conditioner/heater.
-
2019-02-07$129,900 Active
Show marketing remark (301 chars)
Beautiful and clean two story, two bedroom condo across from UNLV. Ideally located within the community, this unit sits across from the pool and park! Home features upgraded tile throughout, upgraded tile in bath and shower, newer carpet, appliances, windows, blinds, paint and air conditioner/heater.
-
2010-10-20soldstatus $50,000
-
2010-10-20historical
-
2010-08-20$49,500
-
2010-04-25historical
-
2010-01-13$54,000
-
2002-01-31soldstatus $64,000
-
1995-09-19soldstatus $49,500
-
1990-02-14soldstatus $49,500
-
1986-11-07soldstatus $18,500
-
1986-02-10soldstatus $12,913
ⓘ Source: listings_history table (triggers on properties + properties_extension) + one-shot
backfill from property_details.listing_events for pre-trigger history.
Tax reassessment forecast NV · Resets to sale price
- Current annual tax
- $612 · $51/mo
- Projected year-2 tax
- $938 · $78/mo
- Expected delta
- +$326/yr (+$27/mo · 53.3%)
ⓘ Screening estimate from a state-policy table — verify with the county assessor before closing.
Climate risk First Street
- Flood 1/10 Low FEMA zone X (unshaded) · 0% chance over 30 yrs
- Wildfire 1/10 Low
- Heat 8/10 Severe 7 d/yr ≥107°F today · 17 d/yr by 30 yrs out
- Wind 1/10 Low
- Air quality 3/10 Moderate 3 unhealthy d/yr today · 4 by 30 yrs out
Nearby sold comps map
Loading sold comps map…
Walkable amenities ~0.75 mi
Loading nearby amenities…
Taxation est. · year 1
- Rental income
- $19,245
- − Mortgage interest
- −$8,906
- − Property taxes
- −$612
- − Insurance
- −$795
- − Repairs & maintenance
- −$1,540
- − Management
- −$1,540
- − HOA
- −$3,600
- − Depreciation
- −$4,625
- Taxable loss
- −$2,373
- Est. tax savings @ 24.0%
- +$569
- After-tax cash flow
- $761/yr
For passive investors: Depreciation is non-cash, so a rental often shows a tax loss while cash-flowing — sheltering income. Rental losses are passive: they offset passive income freely, and up to $25,000/yr can offset ordinary (W-2) income if you actively participate and your MAGI is under $100k (phasing out to $0 by $150k); unused losses carry forward. On sale, claimed depreciation is recaptured at up to 25%, and gains may owe capital-gains tax (a 1031 exchange can defer both). Figures are a year-1 estimate at your 24.0% rate — not tax advice; consult a CPA.
Schools (NCES district)
- District
- Clark County School District
- NCES district ID
- 3200060
- Math proficiency
- 21% ▼ -13.00%
- Reading proficiency
- 39% ▼ -8.00%
- Median HH income
- $53,611
- Composite
- 26.48/100
- National rank
- #7211
- State rank
- #11 of 17 in NV
Livability — Paradise
- Score
- 76/100
- State rank
- #10
- US rank
- #3494
Category grades
Schools grade is shown separately in the Schools card above.
Census & demographics
- Census place
- Paradise, NV
- County
- Clark County · 2,306,105 people
- City population
- 227,885
- Metro
- Las Vegas-Henderson-Paradise, NV
- Population (ZIP)
- 50,196
- Household income
- $46,960
- Rent vs Own
- Severe rent burden
- 4678.0
Population outlook (Clark County) Hauer SSP2
- Today (2025)
- 2,504,101 people
- By 2030
- 2,693,770 · +7.6%
- By 2040
- 3,061,208 · +22.2%
- By 2050
- 3,400,072 · +35.8%
- By 2075
- 4,139,522 · +65.3%
- By 2100
- 4,596,916 · +83.6%
Race, ethnicity, and origin ACS 2023
- Neighborhood character
- Highly diverse neighborhood (Simpson 0.74)
- Race & ethnicity
- Hispanic / Latino 38% White 29% Two or more races 18% Black 13% Asian 11%
- Hispanic origin (detail)
- Mexican 23% Puerto Rican 1% Cuban 4%
- Common ancestry
- Romanian 2% Lithuanian 1% Scotch-Irish 1%
- Foreign-born
- 31% · Canada, China, Jamaica
- Languages at home
- 57% English-only · Spanish 29% Tagalog/Filipino 6% Other Indo-European 3%
Political lean MEDSL · Clark
- 2024 margin
- Toss-up / Even · D 50.4% · R 47.8% · Other 1.7%
- 2008→2024 swing
- -16.5pp toward R · 2008: 19.1pp · 2024: 2.6pp
- All cycles
- 2024: D+2.6 2020: D+9.3 2016: D+10.7 2012: D+14.5 2008: D+19.1
Not yet ingested
- Civics
- —
Market trends
- HPI YoY
- ▼ -221.72%
- Current HPI
- 266.4892
- Rent YoY
- ▼ -1.81%
- Metro
- Las Vegas-Henderson-Paradise, NV
- State GDP YoY
- ▲ 3.08%
- F500 in state
- 6
Industry mix (Fortune 500 HQ in NV)
| Industry | F500 HQs | Revenue |
|---|---|---|
| Hotels / Casinos | 3 | $36B |
|
||
Price history
+1131.3% since first listed29 events — show timeline
- 2026-04-21 Listed $159,000 GLVAR
- 2026-02-06 Rental Removed $1,250 GLVAR
- 2025-12-05 Price Changed $1,250 GLVAR
- 2025-09-17 Listed for Rent $1,400 GLVAR
- 2023-12-11 Rental Removed $1,200 GLVAR
- 2023-12-03 Price Changed $1,200 GLVAR
- 2023-11-16 Listed for Rent $1,250 GLVAR
- 2023-09-27 Pending — GLVAR
- 2023-09-27 Listing Removed — GLVAR
- 2023-09-19 Price Changed $190,000 GLVAR
- 2023-08-16 Relisted — GLVAR
- 2023-08-11 Pending — GLVAR
- 2023-07-17 Listed $192,500 GLVAR
- 2019-05-21 Sold (MLS) $125,000 GLVAR
- 2019-05-20 Sold (Public Records) $125,000 Public Records
- 2019-04-01 Pending — GLVAR
- 2019-03-06 Relisted — GLVAR
- 2019-02-28 Pending — GLVAR
- 2019-02-07 Listed $129,900 GLVAR
- 2010-10-20 Listing Removed — GLVAR
- 2010-10-20 Sold (MLS) $50,000 GLVAR
- 2010-08-20 Listed $49,500 GLVAR
- 2010-04-25 Listing Removed — GLVAR
- 2010-01-13 Listed $54,000 GLVAR
- 2002-01-31 Sold (Public Records) $64,000 Public Records
- 1995-09-19 Sold (Public Records) $49,500 Public Records
- 1990-02-14 Sold (Public Records) $49,500 Public Records
- 1986-11-07 Sold (Public Records) $18,500 Public Records
- 1986-02-10 Sold (Public Records) $12,913 Public Records
Property tax history
-0.2%/yrLatest (2025): $612 · +7.5% YoY. Source: county tax records.
Cash-flow waterfall
monthlySold comps — $/sqft
last 12 mo · ≤1 miLoading sold comps…