 🏗️ New Construction
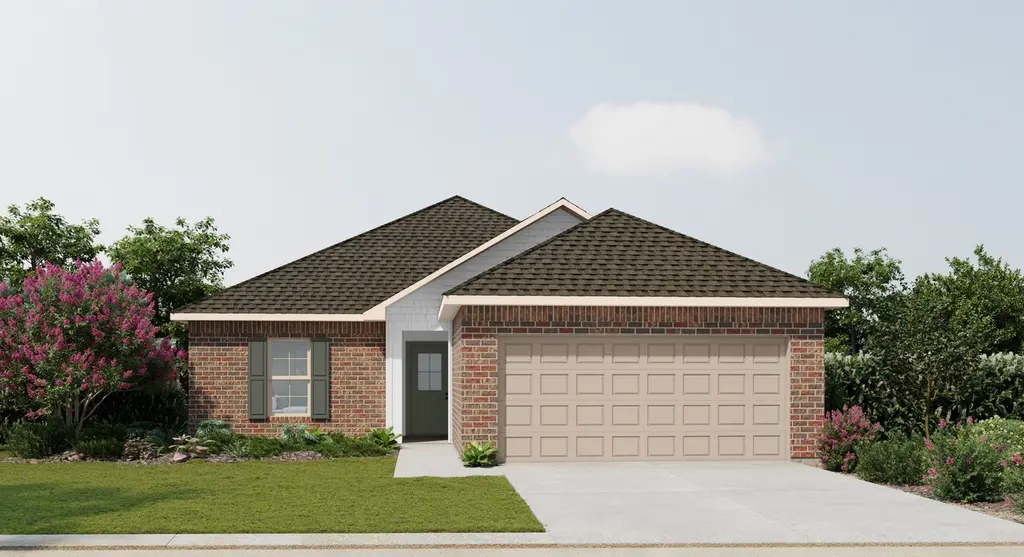
Plymouth IV H - Garden Lot Plan · Youngsville, LA
Flood risk No data
- FEMA flood zone
- —
- Chance of flooding over 30 yrs
- —
- Est. flood insurance / yr
- —
Fire risk No data
- Est. fire insurance / yr
- —
Heat risk No data
- Hot days now (above threshold)
- —
- Hot days in 30 yrs
- —
Wind risk No data
- Chance of severe wind over 30 yrs
- —
Air-quality risk No data
- Unhealthy air days now
- —
- Unhealthy air days in 30 yrs
- —
Risk factors via First Street. Map © Google.
Why this score? — see what drove the D- grade
The composite is a weighted blend of 9 inputs, each scored 0–100. Each bar is that input's sub-score; the figure is the points it added to the 100-point composite (weight × sub-score).
- Cash flow +12.1/30.0
- ARV discount +7.5/15.0
- Livability +3.9/5.0
- DSCR +3.6/10.0
- Schools +3.6/10.0
- 1% rule +3.5/10.0
- Rent growth +2.9/5.0
- Condition / age +1.0/5.0
- Appreciation +0.0/10.0
$229,990
🖨 Deal sheet 📄 Offer letter ✓ Due diligence
Listing remarks MLS
- Open Floor Plan - Three Bedroom, Two Baths - Two Car Garage - Brick & Vinyl Exterior - Walk-In Master Closet - Walk-In Pantry - Optional Fireplace
Key facts
- Upgraded cabinetry
- Under mount sinks
- 2 garage spots
Tags
Neighborhood map
What this means for you Summary
Snapshot
- This is a 3-bed/2.0-bath single-family listed at $230k. Condition is rated poor.
Deal economics
- At list price, monthly cash flow is $-55 ($-659/yr) — negative.
- The deal already cash-flows at list — no discount required.
- To meet the 1% rule (rent ≥ 1% of price), the offer needs to be $221k (4.0% below list).
- Recommended offer: $202k (12.0% below list) — sets the bar for market timing.
- Cap rate 6.0% vs local median 4.8% in Youngsville — meaningfully above typical; check what's discounted (condition, days-on-market, listing class) to confirm the premium yield is real.
Location & tenants
- Location reads 78/100 on livability (#8 in LA, #2,614 nationally) — a middle-class / working-renter tenant base. Strengths: schools A+, employment A+, housing A+; Watch: amenities F, commute F.
- Lafayette Parish (urban): math 38% / reading 46% proficiency, ranked #19 of 98 in LA (top 19%) — families likely to look elsewhere, expect single-tenant / working-renter base with shorter leases.
- Market conditions: Rents rising (+1.6%/yr); 675 active listings in the ZIP; 2 comparable units currently listed for rent nearby; solid renter incomes; 1,585 units permitted in Lafayette Parish in 2024 (10 in 5+ unit buildings).
Forward outlook
- Local home prices are declining (-3.0%/yr); year-one equity from $2k of loan paydown is wiped out by about $8k of value loss. Plan a longer hold.
- Lafayette County population projected at +34% by 2050 — long-run rental-demand tailwind backs the buy-and-hold thesis.
Negotiation context
- It's been on market 506 days — a 12% lower offer ($202k) is reasonable based on typical stale-listing flexibility.
Questions for the listing agent
- What do current leases actually rent for vs. the listed asking? Can we see a recent rent roll and the last 12 months of T-12 income?
- It's been on market 506 days. Have you received any prior offers? Is the seller open to a 12% concession, seller financing, or rate buy-down credit?
- Have any recent inspections been done? Can we get a copy of the seller's disclosures and any deferred-maintenance estimates?
- Why hasn't it sold? Are there any deal-killer items the seller is aware of (foundation, flood, title, zoning, code violations)?
- Is there a deadline driving the sale (1031 exchange, divorce, estate, relocation)? That informs how much negotiation room exists.
- Schools are A-rated — typically a magnet for longer-tenancy family renters. What's the average tenant stay here, and is there a school-zone premium baked into asking?
- The area grade is low — what's the realistic commute time and amenity access for the typical tenant pool here? Any planned neighborhood developments (good or bad) we should know about?
- What's the average days-on-market for RENTAL listings here right now (not sales)? A rising rental-DOM trend means longer vacancies and softer asking-rent achievability than the comps imply.
- What's the recent tenant-quality profile in this submarket — average credit score on applications, eviction rate, late-payment / NSF rate, and stable-employment percentage? A property-management company in the area should have these aggregated.
- How much new for-sale + rental construction is in the pipeline within 1–3 miles? Heavy new supply typically softens prices + rents 12–24 months out; constrained supply supports both.
Investment metrics
- 1% rule
- 0.85% ✗
- Cap rate
- 6.04%
- Cash-on-cash
- -0.90%
- DSCR
- 0.96
- GRM
- 9.8
CMA / ARV
- ARV (median comp)
- $260,328
- List price
- $229,990
- Delta
- -11.65%
- Verdict
- UNDERPRICED
- Comps
- 20 within 1.0 mi
Show comp detail 12 sales within ~0.75 mi
| Address | Dist | Beds/Ba | Sqft | Sold | Price | $/sf | Match |
|---|---|---|---|---|---|---|---|
| 229 Tatum Ln | 0.15mi | 3/2.0 | 1,456 (0%) | 1mo | $230,000 | $158 | 92 |
| 227 Tatum Ln | 0.15mi | 3/2.0 | 1,463 (+0%) | 4mo | $233,025 | $159 | 89 |
| 145 Ridley Ln | 0.03mi | 4/2.0 (+1) | 1,581 (+9%) | 3mo | $256,663 | $162 | 77 |
| 141 Ridley Ln | 0.03mi | 3/2.0 | 1,656 (+14%) | 5mo | $251,990 | $152 | 71 |
| 219 Tatum Ln | 0.17mi | 3/2.0 | 1,629 (+12%) | 1mo | $241,448 | $148 | 71 |
| 214 Tatum Ln | 0.21mi | 4/2.0 (+1) | 1,568 (+8%) | 2mo | $241,367 | $154 | 71 |
| 139 Ridley Ln | 0.04mi | 3/2.0 | 1,656 (+14%) | 7mo | $260,095 | $157 | 70 |
| 234 Tatum Ln | 0.18mi | 4/2.0 (+1) | 1,568 (+8%) | 5mo | $238,358 | $152 | 69 |
| 135 Ridley Ln | 0.05mi | 3/2.0 | 1,656 (+14%) | 7mo | $260,365 | $157 | 69 |
| 118 Ridley Ln | 0.13mi | 3/2.0 | 1,642 (+13%) | 5mo | $256,679 | $156 | 69 |
| 221 Tatum Ln | 0.17mi | 3/2.0 | 1,629 (+12%) | 6mo | $244,916 | $150 | 68 |
| 210 Tatum Ln | 0.22mi | 3/2.0 | 1,659 (+14%) | 1mo | $250,752 | $151 | 66 |
Match score weights: distance 35% · size 25% · config 20% · recency 20%. Top-matched comps best support the ARV.
Projected returns pro-forma
-3.0% appreciation · 1.65% rent growth · sell at horizon
- IRR
- -19.3%
- Equity multiple
- 0.33×
- Total profit
- $-48,610
- Equity at exit
- $38,816
- IRR
- -15.0%
- Equity multiple
- 0.20×
- Total profit
- $-58,518
- Equity at exit
- $22,508
Cash invested: $72,892 (down + closing). Projections, not guarantees.
Landlord ↔ Tenant lean methodology
- Overall (STATE)
- 90 Strongly Landlord-Friendly
- State Louisiana
- 90 Strongly Landlord-Friendly · R+12
- County
- — inherits STATE
- City
- — inherits STATE
ZIP-level market 70592
- Home prices YoY
- -23.4%
- Rents YoY
- 1.6%
- Active inventory
- 675
- Price-to-rent
- 8.7×
Monthly cashflow live
- Estimated rent
- $2,208 medium interval (Pro) →
- Mortgage (P&I)
- −$1,365
- Tax est. 1.5%
- −$325 /mo · $3,905/yr
- Insurance
- −$108
- HOA
- −$0
- Vacancy / Maint / Mgmt
- −$464
- Net cashflow
- $-55
Break-even live
UW: 25.0% down · 7.5% · 30yr · 1.5% tax · 5.0% vac · 8.0% maint · 8.0% mgmt
Financing live
Cash to close
- Down payment
- $65,082
- Closing costs
- $7,810
- Reserves months
- —
- Total cash needed
- —
Loan-product check · same deal, 3 products live
Conventional
25% down · 7.5% · 30yr
- Down + closing
- —
- Monthly P&I
- —
- Monthly cashflow
- —
- DSCR
- —
- Eligible?
- —
Personal DTI + credit; lowest rate.
DSCR
20% down · 8.5% · 30yr
- Down + closing
- —
- Monthly P&I
- —
- Monthly cashflow
- —
- DSCR
- —
- Eligible?
- —
No personal income docs; deal must DSCR.
Hard money
10% down · 12.0% · 12mo
- Down + closing
- —
- Monthly P&I
- —
- Monthly cashflow
- —
- DSCR
- —
- Eligible?
- —
Short-term bridge; refi at stabilization.
Rent comps 2 comps
| Address | Beds | Baths | Sqft | Rent | $/sqft | DOM | Units | Dist |
|---|---|---|---|---|---|---|---|---|
| 141 Ridley Ln Youngsville, LA | 3.0 | 2.0 | 1656 | $2,000 | $1.21 | 13d | 1 | 0.03mi |
| 4400 Chemin Metairie Pkwy Youngsville, LA | 2.0–3.0 | 2.0 | 1200 | $2,330 | $1.94 | 13d | 32 | 0.31mi |
Listing history 18 events
-
2026-06-18days on market $229,990 Active 506 DOM
-
2026-06-17days on market $229,990 Active 505 DOM
-
2026-06-16days on market $229,990 Active 504 DOM
-
2026-06-15days on market $229,990 Active 503 DOM
-
2026-06-14days on market $229,990 Active 501 DOM
-
2026-06-13days on market $229,990 Active 500 DOM
-
2026-06-10days on market $229,990 Active 498 DOM
-
2026-06-09days on market $229,990 Active 497 DOM
-
2026-06-08days on market $229,990 Active 496 DOM
-
2026-06-07days on market $229,990 Active 495 DOM
-
2026-06-05days on market $229,990 Active 492 DOM
-
2026-06-03days on market $229,990 Active 491 DOM
-
2026-06-02days on market $229,990 Active 490 DOM
-
2026-06-01days on market $229,990 Active 489 DOM
-
2026-05-31days on market $229,990 Active 488 DOM
-
2026-05-30days on market $229,990 Active 487 DOM
-
2026-03-23price $229,990 159-char remark
Show marketing remark (159 chars)
- Open Floor Plan - Three Bedroom, Two Baths - Two Car Garage - Brick & Vinyl Exterior - Walk-In Master Closet - Walk-In Pantry - Optional Fireplace
-
2025-01-28$224,990 Active 159-char remark
Show marketing remark (159 chars)
- Open Floor Plan - Three Bedroom, Two Baths - Two Car Garage - Brick & Vinyl Exterior - Walk-In Master Closet - Walk-In Pantry - Optional Fireplace
ⓘ Source: listings_history table (triggers on properties + properties_extension) + one-shot
backfill from property_details.listing_events for pre-trigger history.
Nearby sold comps map
Loading sold comps map…
Walkable amenities ~0.75 mi
Loading nearby amenities…
Taxation est. · year 1
- Rental income
- $26,493
- − Mortgage interest
- −$14,582
- − Property taxes
- −$3,905
- − Insurance
- −$1,302
- − Repairs & maintenance
- −$2,119
- − Management
- −$2,119
- − Depreciation
- −$7,573
- Taxable loss
- −$5,108
- Est. tax savings @ 24.0%
- +$1,226
- After-tax cash flow
- $567/yr
For passive investors: Depreciation is non-cash, so a rental often shows a tax loss while cash-flowing — sheltering income. Rental losses are passive: they offset passive income freely, and up to $25,000/yr can offset ordinary (W-2) income if you actively participate and your MAGI is under $100k (phasing out to $0 by $150k); unused losses carry forward. On sale, claimed depreciation is recaptured at up to 25%, and gains may owe capital-gains tax (a 1031 exchange can defer both). Figures are a year-1 estimate at your 24.0% rate — not tax advice; consult a CPA.
Condition & rehab AI · 2 photos
This property requires extensive exterior and interior renovations, including a new roof, siding, and flooring. Significant repairs are needed to the exterior and interior systems, and updates to the HVAC and plumbing are also required. Landscaping and painting will also improve the property's curb appeal and value.
Repairs flagged
- Major siding — Significant damage to the exterior siding is visible.
- Major brickwork — Significant damage to the brickwork is visible.
- Major roof — Significant damage to the roof is visible.
- Major flooring — The exterior suggests a need for replacement of flooring, which is not visible in the photos.
- Major interior systems — The exterior suggests a need for updates to the HVAC and plumbing systems, which are not visible in the photos.
Value-add opportunities
- Both exterior renovation — A new exterior will significantly improve the curb appeal and overall value of the property.
- Both interior renovation — A new interior will improve the living experience and increase the property's value.
- Both HVAC and plumbing updates — Upgrading these systems will improve the comfort and functionality of the home, increasing its value.
- Both landscaping — A well-maintained landscape will enhance the curb appeal and increase the property's value.
- Both paint — Fresh paint will improve the appearance of the home and increase its value.
Renovation cost estimate screening
| Repair item | Severity | Est. cost |
|---|---|---|
| siding · Significant damage to the exterior siding is visible. | Major | $15,000–50,000 |
| brickwork · Significant damage to the brickwork is visible. | Major | $15,000–50,000 |
| roof · Significant damage to the roof is visible. | Major | $15,000–50,000 |
| flooring · The exterior suggests a need for replacement of flooring, which is not visible in the photos. | Major | $15,000–50,000 |
| interior systems · The exterior suggests a need for updates to the HVAC and plumbing systems, which are not visible in the photos. | Major | $15,000–50,000 |
| Total estimated repair cost · 5 items | $75,000–250,000 |
Value-add ROI direction
- Both exterior renovation — A new exterior will significantly improve the curb appeal and overall value of the property. ↑
- Both interior renovation — A new interior will improve the living experience and increase the property's value. ↑
- Both HVAC and plumbing updates — Upgrading these systems will improve the comfort and functionality of the home, increasing its value. ↑
- Both landscaping — A well-maintained landscape will enhance the curb appeal and increase the property's value. ↑
- Both paint — Fresh paint will improve the appearance of the home and increase its value. ↑
ⓘ Cost ranges are severity-bucket heuristics (US national rule-of-thumb). Get contractor quotes + a written scope before underwriting a rehab budget.
Schools (NCES district)
- District
- Lafayette Parish
- NCES district ID
- 2200870
- Math proficiency
- 38% ▼ -32.00%
- Reading proficiency
- 46% ▼ -24.00%
- Median HH income
- $50,238
- Composite
- 36.15/100
- National rank
- #4741
- State rank
- #19 of 98 in LA
Livability — Youngsville
- Score
- 78/100
- State rank
- #8
- US rank
- #2614
Category grades
Schools grade is shown separately in the Schools card above.
Census & demographics
- Census place
- Youngsville, LA
- County
- Lafayette Parish · 207,544 people
- City population
- 158,114
- Metro
- Lafayette, LA
- Population (ZIP)
- 32,167
- Household income
- $93,204
- Rent vs Own
- Severe rent burden
- 424.0
Population outlook (Lafayette County) Hauer SSP2
- Today (2025)
- 280,930 people
- By 2030
- 301,092 · +7.2%
- By 2040
- 339,456 · +20.8%
- By 2050
- 375,156 · +33.5%
- By 2075
- 451,672 · +60.8%
- By 2100
- 497,203 · +77.0%
Race, ethnicity, and origin ACS 2023
- Neighborhood character
- Predominantly White (82%)
- Race & ethnicity
- White 82% Black 10% Two or more races 5% Hispanic / Latino 4% Asian 1%
- Common ancestry
- Lithuanian 24% Romanian 3% Italian 1%
- Foreign-born
- 3% · Canada
- Languages at home
- 94% English-only · French/Haitian/Cajun 3% Spanish 2%
Political lean MEDSL · Lafayette
- 2024 margin
- Solid R (+31.4) · D 33.5% · R 64.8% · Other 1.7%
- 2008→2024 swing
- -0.1pp no change · 2008: -31.3pp · 2024: -31.4pp
- All cycles
- 2024: R+31.4 2020: R+28.7 2016: R+33.6 2012: R+33.7 2008: R+31.3
Not yet ingested
- Civics
- —
Market trends
- HPI YoY
- ▼ -41.24%
- Current HPI
- 135.2825
- Rent YoY
- ▲ 1.65%
- Metro
- Lafayette, LA
- State GDP YoY
- ▲ 3.29%
- F500 in state
- 10
Industry mix (Fortune 500 HQ in LA)
| Industry | F500 HQs | Revenue |
|---|---|---|
| Telecommunications | 2 | $23B |
|
||
| Utilities | 1 | $12B |
|
||
| Wholesale / Distribution | 1 | $5B |
|
||
| Advertising | 1 | $2B |
|
||
Price history
+2.2% since first listed2 events — show timeline
- 2026-03-23 Price Changed $229,990 Zillow
- 2025-01-28 Listed $224,990 Zillow
Cash-flow waterfall
monthlySold comps — $/sqft
last 12 mo · ≤1 miLoading sold comps…