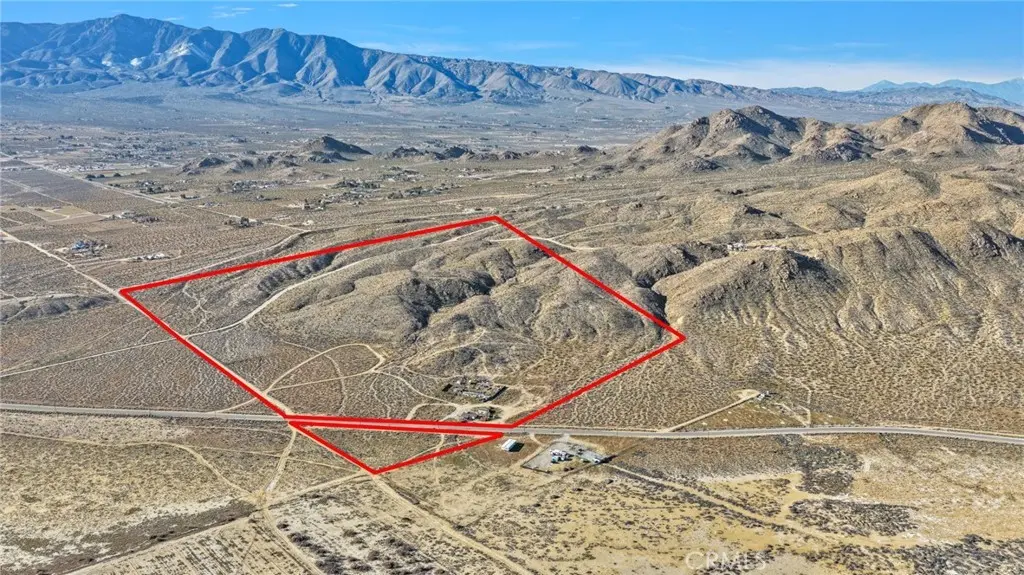
11805 Cove · Lucerne Valley, CA
Flood risk 1/10 · Minimal
- FEMA flood zone
- D
- Chance of flooding over 30 yrs
- 0.0%
- Est. flood insurance / yr
- $544 – $1,084
Fire risk 5/10 · Moderate
- Est. fire insurance / yr
- $659 – $1,223
Heat risk 7/10 · Major
- Hot days now (above 102°F)
- 6 days/yr
- Hot days in 30 yrs
- 17 days/yr
Wind risk 1/10 · Minimal
- Chance of severe wind over 30 yrs
- —
Air-quality risk 10/10 · Severe
- Unhealthy air days now
- 24 days/yr
- Unhealthy air days in 30 yrs
- 31 days/yr
Risk factors via First Street. Map © Google.
Why this score? — see what drove the B grade
The composite is a weighted blend of 9 inputs, each scored 0–100. Each bar is that input's sub-score; the figure is the points it added to the 100-point composite (weight × sub-score).
- Cash flow +23.6/30.0
- ARV discount +15.0/15.0
- Appreciation +10.0/10.0
- DSCR +7.6/10.0
- 1% rule +5.2/10.0
- Rent growth +2.5/5.0
- Schools +2.5/10.0
- Condition / age +2.5/5.0
- Livability +2.1/5.0
$190,000
🖨 Deal sheet (PDF) 📄 Offer letter ✓ Due diligence
Listing remarks MLS
42.92 acres of opportunity!! ?Two parcels totaling 42.92 acres—one parcel is 41.08 acres and the second is 1.84 acres. The property includes a 2-bedroom, 1-bath home, a 4-car detached garage/shop, and a chicken coop/barn. There are two water wells, one of which is approximately 5 years old. Endless possibilities for ranching, farming, or creating your own private retreat. Priced to sell, won’t last long. Call today for more information or to schedule a showing.
Key facts
- Two parcels
- Water wells
- Chicken coop
Tags
Neighborhood map
What this means for you Summary
Snapshot
- This is a 2-bed/1.0-bath single-family listed at $190k.
Deal economics
- At list price, monthly cash flow is $357 ($4k/yr) — positive.
- The deal already cash-flows at list — no discount required.
- Meets the 1% rule at list price ($2k rent vs $190k).
- Recommended offer: $167k (12.0% below list) — sets the bar for market timing.
- Cap rate 8.5% vs local median 4.7% in Lucerne Valley — top-decile yield for the area; either an underpriced asset or a hidden risk that comps aren't pricing in. Stress-test before assuming the spread holds.
Location & tenants
- Location reads 42/100 on livability (#1,358 in CA) — a working-class tenant base; expect higher turnover. Strengths: housing A+; Watch: cost of living C-, schools F, crime F.
- Lucerne Valley Unified (rural): math 22% / reading 33% proficiency, ranked #1,155 of 1,400 in CA (top 82%) — low school quality limits family demand, transient renter base, plan for 1-2y turnover; 78% free/reduced lunch — lower-income household profile, screen leases tightly.
- Market conditions: 366 active listings in the ZIP; 5,458 units permitted in San Bernardino County in 2024 (1,500 in 5+ unit buildings).
Forward outlook
- In year one you build about $20k of equity ($1k loan paydown + $19k appreciation (10.0% local appreciation)).
- San Bernardino County population projected at +15% by 2050 — modest demand growth; plan on rents tracking national, not racing it.
- At projected returns (10.0% appreciation + 3.0% rent growth), your $53k cash investment doubles in ~3 years — after that, you're playing with house money.
- By year 2, paydown + projected appreciation supports a ~$33k cash-out refi (75% LTV) — recoverable capital for the next deal without selling this one.
Negotiation context
- It's been on market 129 days — a 12% lower offer ($167k) is reasonable based on typical stale-listing flexibility.
Risks & watch-outs
- Watch-outs: built in 1952 — expect roof / HVAC / electrical / plumbing capex.
- Climate carrying-cost: moderate wildfire risk; extreme-heat days projected 6→17/yr by 2055 (HVAC capex compounding) — expect insurance premiums to compound above CPI over the hold.
Questions for the listing agent
- It's been on market 129 days. Have you received any prior offers? Is the seller open to a 12% concession, seller financing, or rate buy-down credit?
- Built in 1952 — when were the roof, HVAC, electrical panel, plumbing, and water heater last replaced?
- Why hasn't it sold? Are there any deal-killer items the seller is aware of (foundation, flood, title, zoning, code violations)?
- Is there a deadline driving the sale (1031 exchange, divorce, estate, relocation)? That informs how much negotiation room exists.
- Schools are F-rated, which usually means shorter tenancies and higher turnover. Who's the typical renter profile here, and what's been the actual vacancy rate?
- Crime grade is F in this area — have there been break-ins, vandalism, or insurance claims at this property in the last 3 years? What carrier currently insures it and at what premium?
- What's the average days-on-market for RENTAL listings here right now (not sales)? A rising rental-DOM trend means longer vacancies and softer asking-rent achievability than the comps imply.
- What's the recent tenant-quality profile in this submarket — average credit score on applications, eviction rate, late-payment / NSF rate, and stable-employment percentage? A property-management company in the area should have these aggregated.
- How much new for-sale + rental construction is in the pipeline within 1–3 miles? Heavy new supply typically softens prices + rents 12–24 months out; constrained supply supports both.
Investment metrics
- 1% rule
- 1.02% ✓
- Cap rate
- 8.55%
- Cash-on-cash
- 8.05%
- DSCR
- 1.36
- GRM
- 8.2
CMA / ARV
- ARV (median comp)
- $330,049
- List price
- $190,000
- Delta
- -42.43%
- Verdict
- UNDERPRICED
- Comps
- 3 within 2.0 mi
Projected returns pro-forma
10.0% appreciation · 3.0% rent growth · sell at horizon
- IRR
- 30.1%
- Equity multiple
- 3.37×
- Total profit
- $126,147
- Equity at exit
- $171,167
- IRR
- 26.1%
- Equity multiple
- 7.64×
- Total profit
- $353,506
- Equity at exit
- $369,128
Cash invested: $53,200 (down + closing). Projections, not guarantees.
Landlord ↔ Tenant lean methodology
- Overall (STATE)
- 18 Strongly Tenant-Friendly
- State California
- 18 Strongly Tenant-Friendly · D+13
- County
- — inherits STATE
- City
- — inherits STATE
ZIP-level market 92356
- Home prices YoY
- 20.6%
- Active inventory
- 366
- Price-to-rent
- 8.2×
Monthly cashflow live
- Estimated rent
- $1,942 medium interval (Pro) →
- Mortgage (P&I)
- −$996
- Tax from tax record
- −$102 /mo · $1,221/yr
- Insurance
- −$79
- HOA
- −$0
- Vacancy / Maint / Mgmt
- −$408
- Net cashflow
- $357
Break-even live
Sensitivity live
| Price | -10% $464 | -5% $411 | +0% $357 | +5% $303 | +10% $249 |
|---|---|---|---|---|---|
| Rent | -10% $203 | -5% $280 | +0% $357 | +5% $433 | +10% $510 |
| Rate | -1.0pp $452 | -0.5pp $405 | base $357 | +0.5pp $308 | +1.0pp $257 |
UW: 25.0% down · 7.5% · 30yr · 1.5% tax · 5.0% vac · 8.0% maint · 8.0% mgmt
Financing live
Cash to close
- Down payment
- $47,500
- Closing costs
- $5,700
- Reserves months
- —
- Total cash needed
- —
Loan-product check · same deal, 3 products live
Conventional
25% down · 7.5% · 30yr
- Down + closing
- —
- Monthly P&I
- —
- Monthly cashflow
- —
- DSCR
- —
- Eligible?
- —
Personal DTI + credit; lowest rate.
DSCR
20% down · 8.5% · 30yr
- Down + closing
- —
- Monthly P&I
- —
- Monthly cashflow
- —
- DSCR
- —
- Eligible?
- —
No personal income docs; deal must DSCR.
Hard money
10% down · 12.0% · 12mo
- Down + closing
- —
- Monthly P&I
- —
- Monthly cashflow
- —
- DSCR
- —
- Eligible?
- —
Short-term bridge; refi at stabilization.
Listing history 17 events
-
2026-06-18days on market $190,000 Active 129 DOM
-
2026-06-17days on market $190,000 Active 128 DOM
-
2026-06-16days on market $190,000 Active 127 DOM
-
2026-06-15days on market $190,000 Active 126 DOM
-
2026-06-13days on market $190,000 Active 124 DOM
-
2026-06-13days on market $190,000 Active 123 DOM
-
2026-06-09days on market $190,000 Active 120 DOM
-
2026-06-08days on market $190,000 Active 119 DOM
-
2026-06-07days on market $190,000 Active 118 DOM
-
2026-06-04days on market $190,000 Active 115 DOM
-
2026-06-03days on market $190,000 Active 114 DOM
-
2026-06-02days on market $190,000 Active 113 DOM
-
2026-06-01days on market $190,000 Active 112 DOM
-
2026-05-31days on market $190,000 Active 111 DOM
-
2026-05-15price $190,000 477-char remark
Show marketing remark (477 chars)
42.92 acres of opportunity!! ?Two parcels totaling 42.92 acres—one parcel is 41.08 acres and the second is 1.84 acres. The property includes a 2-bedroom, 1-bath home, a 4-car detached garage/shop, and a chicken coop/barn. There are two water wells, one of which is approximately 5 years old. Endless possibilities for ranching, farming, or creating your own private retreat. Priced to sell, won’t last long. Call today for more information or to schedule a showing.
-
2026-03-18price $210,000 477-char remark
Show marketing remark (477 chars)
42.92 acres of opportunity!! ?Two parcels totaling 42.92 acres—one parcel is 41.08 acres and the second is 1.84 acres. The property includes a 2-bedroom, 1-bath home, a 4-car detached garage/shop, and a chicken coop/barn. There are two water wells, one of which is approximately 5 years old. Endless possibilities for ranching, farming, or creating your own private retreat. Priced to sell, won’t last long. Call today for more information or to schedule a showing.
-
2026-02-09$225,000 Active 477-char remark
Show marketing remark (477 chars)
42.92 acres of opportunity!! ?Two parcels totaling 42.92 acres—one parcel is 41.08 acres and the second is 1.84 acres. The property includes a 2-bedroom, 1-bath home, a 4-car detached garage/shop, and a chicken coop/barn. There are two water wells, one of which is approximately 5 years old. Endless possibilities for ranching, farming, or creating your own private retreat. Priced to sell, won’t last long. Call today for more information or to schedule a showing.
ⓘ Source: listings_history table (triggers on properties + properties_extension) + one-shot
backfill from property_details.listing_events for pre-trigger history.
Tax reassessment forecast CA · Resets to sale price
- Current annual tax
- $1,221 · $102/mo
- Projected year-2 tax
- $1,444 · $120/mo
- Expected delta
- +$223/yr (+$19/mo · 18.3%)
ⓘ Screening estimate from a state-policy table — verify with the county assessor before closing.
Climate risk First Street
- Flood 1/10 Low FEMA zone D · 0% chance over 30 yrs
- Wildfire 5/10 Major
- Heat 7/10 Severe 6 d/yr ≥102°F today · 17 d/yr by 30 yrs out
- Wind 1/10 Low
- Air quality 10/10 Extreme 24 unhealthy d/yr today · 31 by 30 yrs out
Nearby sold comps map
Loading sold comps map…
Walkable amenities ~0.75 mi
Loading nearby amenities…
Taxation est. · year 1
- Rental income
- $23,302
- − Mortgage interest
- −$10,643
- − Property taxes
- −$1,221
- − Insurance
- −$950
- − Repairs & maintenance
- −$1,864
- − Management
- −$1,864
- − Depreciation
- −$5,527
- Taxable income
- $1,232
- Est. tax owed @ 24.0%
- −$296
- After-tax cash flow
- $3,985/yr
For passive investors: Depreciation is non-cash, so a rental often shows a tax loss while cash-flowing — sheltering income. Rental losses are passive: they offset passive income freely, and up to $25,000/yr can offset ordinary (W-2) income if you actively participate and your MAGI is under $100k (phasing out to $0 by $150k); unused losses carry forward. On sale, claimed depreciation is recaptured at up to 25%, and gains may owe capital-gains tax (a 1031 exchange can defer both). Figures are a year-1 estimate at your 24.0% rate — not tax advice; consult a CPA.
Schools (NCES district)
- District
- Lucerne Valley Unified
- NCES district ID
- 0600015
- Math proficiency
- 22% ▲ 6.00%
- Reading proficiency
- 33% ▲ 1.00%
- Median HH income
- $28,341
- Composite
- 24.98/100
- National rank
- #12969
- State rank
- #1155 of 1400 in CA
Livability — Lucerne Valley
- Score
- 42/100
- State rank
- #1358
- US rank
- #26994
Category grades
Schools grade is shown separately in the Schools card above.
Census & demographics
- Census place
- Lucerne Valley, CA
- Population (ZIP)
- 6,665
Population outlook (San Bernardino County) Hauer SSP2
- Today (2025)
- 2,300,329 people
- By 2030
- 2,378,907 · +3.4%
- By 2040
- 2,523,137 · +9.7%
- By 2050
- 2,642,388 · +14.9%
- By 2075
- 2,880,769 · +25.2%
- By 2100
- 2,909,436 · +26.5%
Race, ethnicity, and origin ACS 2023
- Neighborhood character
- Diverse neighborhood (Simpson 0.58)
- Race & ethnicity
- White 56% Hispanic / Latino 32% Two or more races 17% Asian 3% Black 3% Native American 2%
- Hispanic origin (detail)
- Mexican 28% Cuban 2%
- Common ancestry
- Italian 4% Lithuanian 2% Romanian 2%
- Foreign-born
- 18% · Canada, South Korea
- Languages at home
- 70% English-only · Spanish 26% Korean 3% Tagalog/Filipino 1%
Political lean MEDSL · San Bernardino
- 2024 margin
- Toss-up / Even · D 47.5% · R 49.7% · Other 2.8%
- 2008→2024 swing
- -8.5pp toward R · 2008: 6.3pp · 2024: -2.1pp
- All cycles
- 2024: R+2.1 2020: D+10.7 2016: D+9.8 2012: D+5.4 2008: D+6.3
Not yet ingested
- Civics
- —
Market trends
- HPI YoY
- ▲ 75.34%
- Current HPI
- 440.6077
- Rent YoY
- —
- Metro
- —
- State GDP YoY
- ▲ 3.21%
- F500 in state
- 116
Industry mix (Fortune 500 HQ in CA)
| Industry | F500 HQs | Revenue |
|---|---|---|
| Technology | 27 | $1,492B |
|
||
| Financial Services | 3 | $174B |
|
||
| Retail | 3 | $44B |
|
||
| Insurance | 3 | $26B |
|
||
| Media / Entertainment | 2 | $115B |
|
||
| Pharmaceuticals / Biotech | 2 | $62B |
|
||
Price history
-15.6% since first listed3 events — show timeline
- 2026-05-15 Price Changed $190,000 CRMLS
- 2026-03-18 Price Changed $210,000 CRMLS
- 2026-02-09 Listed $225,000 CRMLS
Property tax history
+2.5%/yrLatest (2025): $1,221 · +2.3% YoY. Source: county tax records.
Cash-flow waterfall
monthlySold comps — $/sqft
last 12 mo · ≤1 miLoading sold comps…