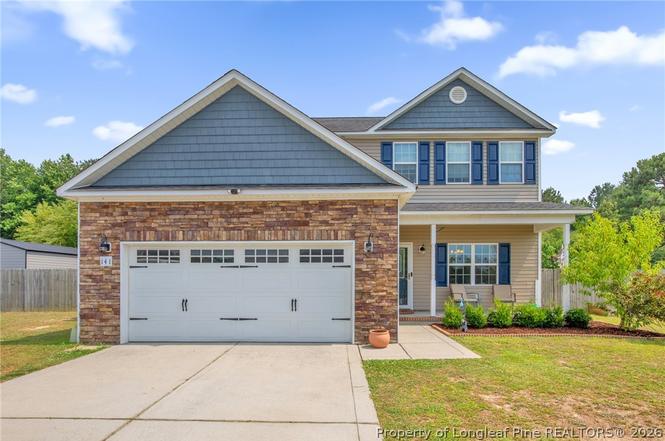
141 Rainmaker St · Fayetteville, NC
Flood risk 1/10 · Minimal
- FEMA flood zone
- X (unshaded)
- Chance of flooding over 30 yrs
- 0.0%
- Est. flood insurance / yr
- $507 – $1,088
Fire risk 7/10 · Major
- Est. fire insurance / yr
- $906 – $1,684
Heat risk 7/10 · Major
- Hot days now (above 107°F)
- 7 days/yr
- Hot days in 30 yrs
- 16 days/yr
Wind risk 6/10 · Moderate
- Chance of severe wind over 30 yrs
- 64.0%
Air-quality risk 2/10 · Minimal
- Unhealthy air days now
- 1 days/yr
- Unhealthy air days in 30 yrs
- 1 days/yr
Risk factors via First Street. Map © Google.
Why this score? — see what drove the D- grade
The composite is a weighted blend of 9 inputs, each scored 0–100. Each bar is that input's sub-score; the figure is the points it added to the 100-point composite (weight × sub-score).
- Appreciation +10.0/10.0
- ARV discount +7.7/15.0
- Cash flow +7.2/30.0
- Livability +3.8/5.0
- Schools +3.0/10.0
- Rent growth +2.5/5.0
- Condition / age +2.5/5.0
- DSCR +1.3/10.0
- 1% rule +1.0/10.0
$310,000
🖨 Deal sheet (PDF) 📄 Offer letter ✓ Due diligence
Listing remarks MLS
3 Bedroom 2 1/2 Bath with Loft area! This home offers nice country living with a large yard. .. Downstairs you will find a spacious living room, formal dining room, 1/2 bath and kitchen with tons of cabinet space, granite and SS appliances. Great space for coming together as a family or to entertain guest. Upstairs is your private living space offering all bedrooms, laundry and a cozy loft space! Master bedroom has trey ceilings. .. large WIC. .. double vanity. .. garden tub and separate shower.
Key facts
- Double vanity
- Formal dining room
- No rear neighbors
Tags
Property features AI
Finance
- Other: GPS-friendly directions
- HOA & community: Homeowners association with an annual fee of $125 (about $10.42/month)
Exterior
- Parking: Attached garage with 2 covered spaces
- Utilities: Public water; Septic system / holding tank
- Home design: Single-family residence; Two levels; Located in the Sweetwater subdivision
- Construction: Vinyl siding; Block foundation
- Exterior features: Porch; Patio; Back yard fencing
Interior
- Kitchen: Dishwasher; Microwave; Range; Eat-in kitchen with granite counters
- Bedrooms: Total rooms: 6
- Flooring: Carpet; Tile; Vinyl
- Bathrooms: 2 full baths; 1 half bath
- Heating & cooling: Heat pump; Central electric air conditioning
- Interior features: Double vanity; Eat-in kitchen; Granite counters; Window coverings and blinds; Factory-built fireplace (1)
- Laundry & utility: Washer hookup on upper level
Neighborhood map
What this means for you Summary
Snapshot
- This is a 3-bed/2.5-bath single-family listed at $310k.
Deal economics
- At list price, monthly cash flow is $-432 ($-5k/yr) — negative.
- To cash-flow at today's rent, offer at most $234k (24.6% below list).
- To meet the 1% rule (rent ≥ 1% of price), the offer needs to be $188k (39.5% below list).
- Recommended offer: $188k (39.5% below list) — sets the bar for 1% rule.
Location & tenants
- Location reads 75/100 on livability (#45 in NC, #4,031 nationally) — a middle-class / working-renter tenant base. Strengths: commute A+, cost of living A+, housing A+; Watch: crime F, employment D-.
- Harnett County Schools (rural): math 31% / reading 39% proficiency, ranked #130 of 178 in NC (top 73%) — families likely to look elsewhere, expect single-tenant / working-renter base with shorter leases.
- Zoned schools: Anderson Creek Primary (582 students, 61% FRL); Overhills Middle (math 29% / reading 40%, grade F, #292 of 475 statewide, top 62%, 799 students, 61% FRL); Overhills High (math 52% / reading 63%, grade C, #245 of 535 statewide, top 46%, 1,971 students, 47% FRL).
- Market conditions: 59 active listings in the ZIP; 2,080 units permitted in Harnett County in 2024 (12 in 5+ unit buildings).
Forward outlook
- In year one you build about $33k of equity ($2k loan paydown + $31k appreciation (10.0% local appreciation)).
- Harnett County population projected at +42% by 2050 — long-run rental-demand tailwind backs the buy-and-hold thesis.
- By year 2, paydown + projected appreciation supports a ~$53k cash-out refi (75% LTV) — recoverable capital for the next deal without selling this one.
Negotiation context
- Only 10 days on market — expect competitive offers; lowballing is unlikely to land.
- 6 sale attempts since 12y ago with the ask held roughly flat each time — persistent listings suggest the price (not the market) is what's stuck; bring a comps-based counter.
- Current owner paid $256k; 21% above their basis — modest negotiation headroom, anchor on the comps not their cost.
Risks & watch-outs
- Climate carrying-cost: major wind risk, 64% chance of damaging wind over 30y; major wildfire risk; extreme-heat days projected 7→16/yr by 2055 (HVAC capex compounding) — expect insurance premiums to compound above CPI over the hold.
Questions for the listing agent
- What do current leases actually rent for vs. the listed asking? Can we see a recent rent roll and the last 12 months of T-12 income?
- What does the HOA fee cover, when was the last increase, and are there any pending special assessments or reserve-fund shortfalls?
- Is there a deadline driving the sale (1031 exchange, divorce, estate, relocation)? That informs how much negotiation room exists.
- Crime grade is F in this area — have there been break-ins, vandalism, or insurance claims at this property in the last 3 years? What carrier currently insures it and at what premium?
- The area grade is low — what's the realistic commute time and amenity access for the typical tenant pool here? Any planned neighborhood developments (good or bad) we should know about?
- What's the average days-on-market for RENTAL listings here right now (not sales)? A rising rental-DOM trend means longer vacancies and softer asking-rent achievability than the comps imply.
- What's the recent tenant-quality profile in this submarket — average credit score on applications, eviction rate, late-payment / NSF rate, and stable-employment percentage? A property-management company in the area should have these aggregated.
- How much new for-sale + rental construction is in the pipeline within 1–3 miles? Heavy new supply typically softens prices + rents 12–24 months out; constrained supply supports both.
Investment metrics
- 1% rule
- 0.60% ✗
- Cap rate
- 4.62%
- Cash-on-cash
- -5.97%
- DSCR
- 0.73
- GRM
- 13.8
CMA / ARV
- ARV (on-the-fly)
- $311,664
- Comps found
- 8
Show comp detail 8 sales within ~0.75 mi
| Address | Dist | Beds/Ba | Sqft | Sold | Price | $/sf | Match |
|---|---|---|---|---|---|---|---|
| 64 Hybrid Ln | 0.12mi | 3/2.5 | 2,042 (-1%) | 8mo | $226,000 | $111 | 86 |
| 18 Harvest Cts | 0.19mi | 3/2.5 | 2,197 (+6%) | 11mo | $320,000 | $146 | 71 |
| 51 Folly Ct | 0.16mi | 4/2.5 (+1) | 2,230 (+8%) | 8mo | $317,000 | $142 | 68 |
| 11 Rainmaker St | 0.15mi | 3/2.5 | 1,954 (-5%) | 20mo | $310,000 | $159 | 68 |
| 379 Rainmaker St | 0.24mi | 4/2.5 (+1) | 2,020 (-2%) | 15mo | $305,000 | $151 | 68 |
| 237 Rainmaker St | 0.09mi | 3/2.5 | 1,953 (-5%) | 23mo | $295,000 | $151 | 68 |
| 66 Harvest Ct | 0.20mi | 3/2.5 | 1,977 (-4%) | 20mo | $305,000 | $154 | 67 |
| 58 Harvest Ct | 0.19mi | 4/2.5 (+1) | 2,212 (+7%) | 12mo | $311,000 | $141 | 64 |
Match score weights: distance 35% · size 25% · config 20% · recency 20%. Top-matched comps best support the ARV.
Projected returns pro-forma
10.0% appreciation · 3.0% rent growth · sell at horizon
- IRR
- 20.0%
- Equity multiple
- 2.63×
- Total profit
- $141,222
- Equity at exit
- $279,273
- IRR
- 18.3%
- Equity multiple
- 6.04×
- Total profit
- $437,277
- Equity at exit
- $602,262
Cash invested: $86,800 (down + closing). Projections, not guarantees.
Landlord ↔ Tenant lean methodology
- Overall (STATE)
- 85 Strongly Landlord-Friendly
- State North Carolina
- 85 Strongly Landlord-Friendly · R+3
- County
- — inherits STATE
- City
- — inherits STATE
ZIP-level market 28356
- Home prices YoY
- 16.1%
- Active inventory
- 59
- Price-to-rent
- 13.8×
Monthly cashflow live
- Estimated rent
- $1,875 medium interval (Pro) →
- Mortgage (P&I)
- −$1,626
- Tax from tax record
- −$148 /mo · $1,781/yr
- Insurance
- −$129
- HOA
- −$10
- Vacancy / Maint / Mgmt
- −$394
- Net cashflow
- $-432
Break-even live
Sensitivity live
| Price | -10% $-256 | -5% $-344 | +0% $-432 | +5% $-520 | +10% $-607 |
|---|---|---|---|---|---|
| Rent | -10% $-580 | -5% $-506 | +0% $-432 | +5% $-358 | +10% $-284 |
| Rate | -1.0pp $-276 | -0.5pp $-353 | base $-432 | +0.5pp $-512 | +1.0pp $-594 |
UW: 25.0% down · 7.5% · 30yr · 1.5% tax · 5.0% vac · 8.0% maint · 8.0% mgmt
Financing live
Cash to close
- Down payment
- $77,500
- Closing costs
- $9,300
- Reserves months
- —
- Total cash needed
- —
Loan-product check · same deal, 3 products live
Conventional
25% down · 7.5% · 30yr
- Down + closing
- —
- Monthly P&I
- —
- Monthly cashflow
- —
- DSCR
- —
- Eligible?
- —
Personal DTI + credit; lowest rate.
DSCR
20% down · 8.5% · 30yr
- Down + closing
- —
- Monthly P&I
- —
- Monthly cashflow
- —
- DSCR
- —
- Eligible?
- —
No personal income docs; deal must DSCR.
Hard money
10% down · 12.0% · 12mo
- Down + closing
- —
- Monthly P&I
- —
- Monthly cashflow
- —
- DSCR
- —
- Eligible?
- —
Short-term bridge; refi at stabilization.
HOA detail
- Monthly dues
- $10 · $120/yr
Listing history 7 events
-
2026-06-21days on market $310,000 Active 10 DOM
-
2026-06-18days on market $310,000 Active 7 DOM
-
2026-06-17days on market $310,000 Active 6 DOM
-
2026-06-16days on market $310,000 Active 5 DOM
-
2026-06-15days on market $310,000 Active 4 DOM
-
2026-06-14remarks 660-char remark
-
2026-06-14$310,000 Active 2 DOM
ⓘ Source: listings_history table (triggers on properties + properties_extension) + one-shot
backfill from property_details.listing_events for pre-trigger history.
Tax reassessment forecast NC · Resets to sale price
- Current annual tax
- $1,781 · $148/mo
- Projected year-2 tax
- $2,542 · $212/mo
- Expected delta
- +$761/yr (+$63/mo · 42.7%)
ⓘ Screening estimate from a state-policy table — verify with the county assessor before closing.
Climate risk First Street
- Flood 1/10 Low FEMA zone X (unshaded) · 0% chance over 30 yrs
- Wildfire 7/10 Severe
- Heat 7/10 Severe 7 d/yr ≥107°F today · 16 d/yr by 30 yrs out
- Wind 6/10 Major 64% chance of damaging wind over 30 yrs
- Air quality 2/10 Low 1 unhealthy d/yr today · 1 by 30 yrs out
Nearby sold comps map
Loading sold comps map…
Walkable amenities ~0.75 mi
Loading nearby amenities…
Taxation est. · year 1
- Rental income
- $22,504
- − Mortgage interest
- −$17,365
- − Property taxes
- −$1,781
- − Insurance
- −$1,550
- − Repairs & maintenance
- −$1,800
- − Management
- −$1,800
- − HOA
- −$120
- − Depreciation
- −$9,018
- Taxable loss
- −$10,931
- Est. tax savings @ 24.0%
- +$2,623
- After-tax cash flow
- $-2,558/yr
For passive investors: Depreciation is non-cash, so a rental often shows a tax loss while cash-flowing — sheltering income. Rental losses are passive: they offset passive income freely, and up to $25,000/yr can offset ordinary (W-2) income if you actively participate and your MAGI is under $100k (phasing out to $0 by $150k); unused losses carry forward. On sale, claimed depreciation is recaptured at up to 25%, and gains may owe capital-gains tax (a 1031 exchange can defer both). Figures are a year-1 estimate at your 24.0% rate — not tax advice; consult a CPA.
Schools (NCES district)
- District
- Harnett County Schools
- NCES district ID
- 3702010
- Math proficiency
- 31% ▼ -2.00%
- Reading proficiency
- 39% ▼ -1.00%
- Median HH income
- $45,400
- Composite
- 29.88/100
- National rank
- #6397
- State rank
- #130 of 178 in NC
Livability — Fayetteville
- Score
- 75/100
- State rank
- #45
- US rank
- #4031
Category grades
Schools grade is shown separately in the Schools card above.
Census & demographics
- City population
- 226,118
- Population (ZIP)
- 5,747
Population outlook (Harnett County) Hauer SSP2
- Today (2025)
- 153,758 people
- By 2030
- 166,581 · +8.3%
- By 2040
- 192,741 · +25.4%
- By 2050
- 218,332 · +42.0%
- By 2075
- 275,422 · +79.1%
- By 2100
- 313,511 · +103.9%
Race, ethnicity, and origin ACS 2023
- Neighborhood character
- Majority White (64%)
- Race & ethnicity
- White 64% Black 19% Hispanic / Latino 11% Two or more races 7% Native American 1% Asian 1%
- Hispanic origin (detail)
- Mexican 2% Puerto Rican 4%
- Common ancestry
- Lithuanian 3% Italian 2% Serbian 2%
- Foreign-born
- 3% · Canada, Jamaica
- Languages at home
- 90% English-only · Spanish 7% Other Indo-European 1% Russian/Polish/Slavic 1%
Political lean MEDSL · Harnett
- 2024 margin
- Strong R (+25.1) · D 36.9% · R 62.0% · Other 1.1%
- 2008→2024 swing
- -8.4pp toward R · 2008: -16.7pp · 2024: -25.1pp
- All cycles
- 2024: R+25.1 2020: R+22.4 2016: R+24.1 2012: R+19.4 2008: R+16.7
Not yet ingested
- Civics
- —
Market trends
- HPI YoY
- ▲ 40.02%
- Current HPI
- 289.2973
- Rent YoY
- —
- Metro
- —
- State GDP YoY
- ▲ 3.28%
- F500 in state
- 26
Industry mix (Fortune 500 HQ in NC)
| Industry | F500 HQs | Revenue |
|---|---|---|
| Financial Services | 2 | $213B |
|
||
| Retail | 2 | $95B |
|
||
| Industrial Conglomerate | 1 | $38B |
|
||
| Metals / Steel | 1 | $35B |
|
||
| Utilities | 1 | $30B |
|
||
| Industrial Machinery | 1 | $19B |
|
||
Price history
+78.3% since first listed13 events — show timeline
- 2026-06-11 Listed $310,000 LPRMLS
- 2021-11-17 Sold (Public Records) $256,000 Public Records
- 2020-10-26 Sold (Public Records) $198,500 Public Records
- 2020-10-26 Sold (MLS) $198,500 LPRMLS
- 2020-09-17 Listed $198,500 LPRMLS
- 2015-06-12 Sold (MLS) $173,900 TMLS
- 2015-06-12 Sold (MLS) $173,900 LPRMLS
- 2015-06-12 Sold (MLS) $173,000 AMLSNC
- 2015-06-12 Sold (MLS) $173,000 TMLS
- 2014-08-21 Listed $173,900 TMLS
- 2014-08-21 Listed $173,900 LPRMLS
- 2014-08-21 Listed $173,900 AMLSNC
- 2014-08-21 Listed $173,900 TMLS
Property tax history
+21.3%/yrLatest (2025): $1,781 · +0.0% YoY. Source: county tax records.
Cash-flow waterfall
monthlySold comps — $/sqft
last 12 mo · ≤1 miLoading sold comps…