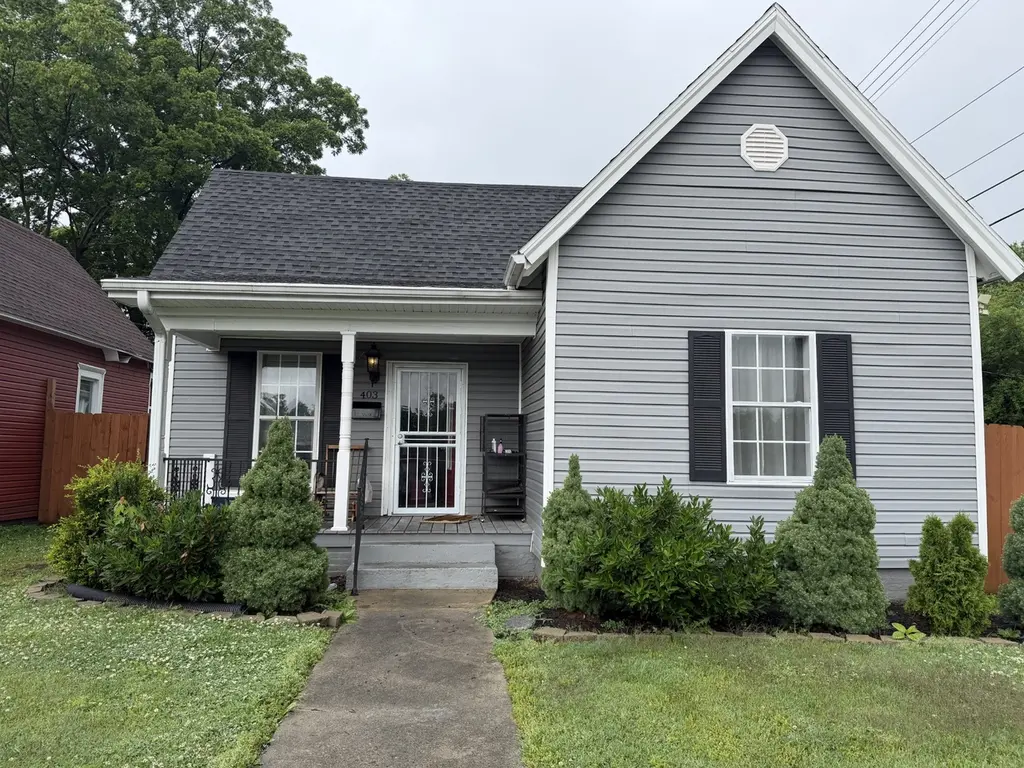
403 S Cleveland Ave · Hopkinsville, KY
Flood risk 1/10 · Minimal
- FEMA flood zone
- X (unshaded)
- Chance of flooding over 30 yrs
- 0.0%
- Est. flood insurance / yr
- $507 – $1,088
Fire risk 1/10 · Minimal
- Est. fire insurance / yr
- $839 – $1,559
Heat risk 5/10 · Moderate
- Hot days now (above 108°F)
- 7 days/yr
- Hot days in 30 yrs
- 21 days/yr
Wind risk 3/10 · Minor
- Chance of severe wind over 30 yrs
- 7.0%
Air-quality risk 2/10 · Minimal
- Unhealthy air days now
- 0 days/yr
- Unhealthy air days in 30 yrs
- 1 days/yr
Risk factors via First Street. Map © Google.
Why this score? — see what drove the D- grade
The composite is a weighted blend of 9 inputs, each scored 0–100. Each bar is that input's sub-score; the figure is the points it added to the 100-point composite (weight × sub-score).
- Cash flow +13.2/30.0
- ARV discount +7.5/15.0
- Rent growth +4.2/5.0
- DSCR +4.0/10.0
- Livability +3.2/5.0
- 1% rule +2.8/10.0
- Schools +2.7/10.0
- Condition / age +2.5/5.0
- Appreciation +0.0/10.0
$129,900
🖨 Deal sheet (PDF) 📄 Offer letter ✓ Due diligence
Listing remarks MLS
Beautifully remodeled inside and out! You are going to love this doll house with beautiful laminate and tile flooring throughout. New hickory kitchen cabinets, countertops. Bathroom with lovely tile flooring , new vanity, and tiled surrounding bathtub. New siding, roof, light fixtures. Updated windows, fenced back yard. A must see!
Key facts
- 6,969 sq ft lot
- Built 1950
- Listed 16 days
Property features AI
Finance
- HOA & community: Pets allowed
Exterior
- Parking: No covered parking; No designated parking spaces reported
- Security: Smoke detector(s)
- Utilities: Public water; Public sewer; Electricity available
- Home design: Single-family residence; One level
- Construction: Vinyl siding; Shingle roof; Block foundation; Existing (year built not specified)
- Exterior features: Privacy fencing; Lot about 0.16 acre
Interior
- Kitchen: Electric oven and range; Dishwasher; Microwave; Refrigerator
- Bedrooms: 3 bedrooms (all on the main level)
- Flooring: Laminate
- Bathrooms: 1 full bathroom
- Heating & cooling: Central heating; Heat pump; Central air (electric)
- Interior features: Electric oven and electric range; Dishwasher; Microwave; Refrigerator; Laminate flooring; Crawl space basement; Smoke detectors
- Laundry & utility: Washer hookup; Electric dryer hookup
Neighborhood map
What this means for you Summary
Snapshot
- This is a 2-bed/1.0-bath single-family listed at $130k.
Deal economics
- At list price, monthly cash flow is $-2 ($-30/yr) — negative.
- To cash-flow at today's rent, offer at most $129k (0.3% below list).
- To meet the 1% rule (rent ≥ 1% of price), the offer needs to be $101k (22.4% below list).
- Recommended offer: $101k (22.4% below list) — sets the bar for 1% rule.
- Cap rate 6.3% vs local median 4.3% in Hopkinsville — top-decile yield for the area; either an underpriced asset or a hidden risk that comps aren't pricing in. Stress-test before assuming the spread holds.
Location & tenants
- Location reads 64/100 on livability (#305 in KY) — a middle-class / working-renter tenant base. Strengths: cost of living A+, housing A, health & safety B+; Watch: crime F, amenities F, commute F.
- Christian County (town): math 30% / reading 34% proficiency, ranked #93 of 165 in KY (top 56%) — families likely to look elsewhere, expect single-tenant / working-renter base with shorter leases; 61% free/reduced lunch — lower-income household profile, screen leases tightly.
- Zoned schools: Martin Luther King Jr. Elementary School (math 20% / reading 19%, grade F, #572 of 676 statewide, top 88%, 580 students, 80% FRL); Christian County Middle School (math 21% / reading 40%, grade F, #143 of 217 statewide, top 67%, 650 students, 69% FRL); Christian County High School (math 20% / reading 36%, grade F, #151 of 254 statewide, top 61%, 1,187 students, 67% FRL).
- Market conditions: Rents rising fast (+6.6%/yr); 255 active listings in the ZIP; 30 comparable units currently listed for rent nearby; rentals at typical pace (median 23d on market — plan ~3-4 weeks tenant-placement turnaround); 193 units permitted in Christian County in 2024 (66 in 5+ unit buildings).
Forward outlook
- Local home prices are declining (-3.0%/yr); year-one equity from $898 of loan paydown is wiped out by about $4k of value loss. Plan a longer hold.
- Christian County population projected at -20% by 2050 — secular population decline; favor cash flow + early exit over multi-decade hold.
Negotiation context
- It's been on market 17 days — a 2% lower offer ($128k) is reasonable based on typical stale-listing flexibility.
- Current owner paid $105k; 24% above their basis — modest negotiation headroom, anchor on the comps not their cost.
Risks & watch-outs
- Watch-outs: built in 1950 — expect roof / HVAC / electrical / plumbing capex.
- Climate carrying-cost: extreme-heat days projected 7→21/yr by 2055 (HVAC capex compounding) — expect insurance premiums to compound above CPI over the hold.
Questions for the listing agent
- What do current leases actually rent for vs. the listed asking? Can we see a recent rent roll and the last 12 months of T-12 income?
- Built in 1950 — when were the roof, HVAC, electrical panel, plumbing, and water heater last replaced?
- Is there a deadline driving the sale (1031 exchange, divorce, estate, relocation)? That informs how much negotiation room exists.
- Schools are D-rated, which usually means shorter tenancies and higher turnover. Who's the typical renter profile here, and what's been the actual vacancy rate?
- Crime grade is F in this area — have there been break-ins, vandalism, or insurance claims at this property in the last 3 years? What carrier currently insures it and at what premium?
- The area grade is low — what's the realistic commute time and amenity access for the typical tenant pool here? Any planned neighborhood developments (good or bad) we should know about?
- What's the average days-on-market for RENTAL listings here right now (not sales)? A rising rental-DOM trend means longer vacancies and softer asking-rent achievability than the comps imply.
- What's the recent tenant-quality profile in this submarket — average credit score on applications, eviction rate, late-payment / NSF rate, and stable-employment percentage? A property-management company in the area should have these aggregated.
- How much new for-sale + rental construction is in the pipeline within 1–3 miles? Heavy new supply typically softens prices + rents 12–24 months out; constrained supply supports both.
Investment metrics
- 1% rule
- 0.78% ✗
- Cap rate
- 6.27%
- Cash-on-cash
- -0.08%
- DSCR
- 1.00
- GRM
- 10.7
CMA / ARV
- ARV (on-the-fly)
- $72,996
- Comps found
- 9
Show comp detail 9 sales within ~0.75 mi
| Address | Dist | Beds/Ba | Sqft | Sold | Price | $/sf | Match |
|---|---|---|---|---|---|---|---|
| 116 N Jessup Ave | 0.23mi | 3/1.5 (+1) | 1,120 (+1%) | 15mo | $135,000 | $121 | 68 |
| 125 Sarah Ave | 0.40mi | 2/1.0 | 1,008 (-9%) | 1mo | $60,000 | $60 | 66 |
| 111 N Kentucky Ave | 0.29mi | 2/1.0 | 1,031 (-7%) | 15mo | $54,000 | $52 | 63 |
| 1701 Tennessee Ave | 0.56mi | 3/2.0 (+1) | 1,110 (+0%) | 14mo | $169,000 | $152 | 53 |
| 814 E 4th St | 0.70mi | 3/2.0 (+1) | 1,152 (+4%) | 2mo | $153,000 | $133 | 49 |
| 308 E 14th St | 0.50mi | 1/1.0 (-1) | 1,056 (-4%) | 19mo | $70,000 | $66 | 48 |
| 1309 Phelps Ave | 0.36mi | 3/2.0 (+1) | 1,201 (+9%) | 15mo | $162,000 | $135 | 47 |
| 1604 S Clay St | 0.60mi | 2/2.0 | 1,128 (+2%) | 21mo | $33,000 | $29 | 47 |
| 119 S Kentucky Ave | 0.25mi | 2/1.0 | 942 (-15%) | 21mo | $50,000 | $53 | 46 |
Match score weights: distance 35% · size 25% · config 20% · recency 20%. Top-matched comps best support the ARV.
Projected returns pro-forma
-3.0% appreciation · 6.61% rent growth · sell at horizon
- IRR
- -12.9%
- Equity multiple
- 0.52×
- Total profit
- $-17,460
- Equity at exit
- $19,369
- IRR
- 0.4%
- Equity multiple
- 1.03×
- Total profit
- $1,172
- Equity at exit
- $11,231
Cash invested: $36,372 (down + closing). Projections, not guarantees.
Landlord ↔ Tenant lean methodology
- Overall (STATE)
- 83 Strongly Landlord-Friendly
- State Kentucky
- 83 Strongly Landlord-Friendly · R+16
- County
- — inherits STATE
- City
- — inherits STATE
ZIP-level market 42240
- Home prices YoY
- -17.5%
- Rents YoY
- 6.6%
- Active inventory
- 255
- Price-to-rent
- 10.7×
Monthly cashflow live
- Estimated rent
- $1,008 high interval (Pro) →
- Mortgage (P&I)
- −$681
- Tax from tax record
- −$63 /mo · $758/yr
- Insurance
- −$54
- HOA
- −$0
- Vacancy / Maint / Mgmt
- −$212
- Net cashflow
- $-2
Break-even live
Sensitivity live
| Price | -10% $71 | -5% $34 | +0% $-2 | +5% $-39 | +10% $-76 |
|---|---|---|---|---|---|
| Rent | -10% $-82 | -5% $-42 | +0% $-2 | +5% $37 | +10% $77 |
| Rate | -1.0pp $63 | -0.5pp $31 | base $-2 | +0.5pp $-36 | +1.0pp $-70 |
UW: 25.0% down · 7.5% · 30yr · 1.5% tax · 5.0% vac · 8.0% maint · 8.0% mgmt
Financing live
Cash to close
- Down payment
- $32,475
- Closing costs
- $3,897
- Reserves months
- —
- Total cash needed
- —
Loan-product check · same deal, 3 products live
Conventional
25% down · 7.5% · 30yr
- Down + closing
- —
- Monthly P&I
- —
- Monthly cashflow
- —
- DSCR
- —
- Eligible?
- —
Personal DTI + credit; lowest rate.
DSCR
20% down · 8.5% · 30yr
- Down + closing
- —
- Monthly P&I
- —
- Monthly cashflow
- —
- DSCR
- —
- Eligible?
- —
No personal income docs; deal must DSCR.
Hard money
10% down · 12.0% · 12mo
- Down + closing
- —
- Monthly P&I
- —
- Monthly cashflow
- —
- DSCR
- —
- Eligible?
- —
Short-term bridge; refi at stabilization.
Rent comps 30 comps
| Address | Beds | Baths | Sqft | Rent | $/sqft | DOM | Units | Dist |
|---|---|---|---|---|---|---|---|---|
| 707 Sylvia St Hopkinsville, KY | 2.0 | 1.0 | 768 | $800 | $1.04 | 15d | 1 | 0.26mi |
| 200 E 9th St Apt 1 Hopkinsville, KY | 2.0 | 1.0 | 900 | $795 | $0.88 | 23d | 1 | 0.32mi |
| 117 B S Fowler Ave Unit A Hopkinsville, KY | 2.0 | 1.0 | 700 | $850 | $1.21 | 15d | 1 | 0.41mi |
| 1611 S Main St Unit 6 Hopkinsville, KY | 2.0 | 1.0 | 900 | $900 | $1.00 | 45d | 1 | 0.52mi |
| 1611 S Main St Ste 1 Hopkinsville, KY | 1.0 | 1.0 | 700 | $750 | $1.07 | 15d | 1 | 0.52mi |
| 1810 S Main St Hopkinsville, KY | 2.0 | 1.5 | 1000 | $900 | $0.90 | 23d | 1 | 0.68mi |
| 312 Twyman Sq Hopkinsville, KY | 2.0 | 1.0 | 900 | $900 | $1.00 | 45d | 1 | 0.75mi |
| 1937 High St Hopkinsville, KY | 2.0 | 1.0 | 850 | $950 | $1.12 | 45d | 1 | 0.78mi |
| 1937 High St Unit 1 Hopkinsville, KY | 2.0 | 1.0 | 850 | $950 | $1.12 | 23d | 1 | 0.78mi |
| 1935 High St Hopkinsville, KY | 2.0 | 1.0 | 850 | $850 | $1.00 | 45d | 1 | 0.80mi |
| 201 Thornton Ct Hopkinsville, KY | 1.0–2.0 | 1.0 | 800 | $1,000 | $1.25 | 23d | 2 | 0.85mi |
| 100 Croft St Hopkinsville, KY | 1.0–2.0 | 1.0 | 790 | $856 | $1.08 | 23d | 4 | 0.90mi |
| 1202 Cates St Hopkinsville, KY | 3.0 | 1.0 | 1000 | $995 | $0.99 | 23d | 1 | 0.97mi |
| 600 A Colonelette Dr Unit 600 Hopkinsville, KY | 2.0 | 2.0 | 980 | $1,020 | $1.04 | 23d | 1 | 1.02mi |
| 600 A Colonelette Dr Unit 600 Hopkinsville, KY | 2.0 | 2.0 | 980 | $1,020 | $1.04 | 45d | 1 | 1.02mi |
| 600 A Colonelette Dr Unit A Hopkinsville, KY | 2.0 | 2.0 | 980 | $1,050 | $1.07 | 45d | 1 | 1.02mi |
| 600 A Colonelette Dr Unit A Hopkinsville, KY | 2.0 | 2.0 | 980 | $1,020 | $1.04 | 23d | 1 | 1.02mi |
| 101 Talbert Dr Hopkinsville, KY | 2.0 | 1.0 | 900 | $950 | $1.06 | 15d | 1 | 1.04mi |
| 605 Colonette Dr Hopkinsville, KY | 3.0 | 2.0 | 1060 | $1,625 | $1.53 | 23d | 1 | 1.05mi |
| 607 Colonette Dr Hopkinsville, KY | 3.0 | 2.0 | 1060 | $1,600 | $1.51 | 45d | 1 | 1.06mi |
| 2323 S Virginia St Unit STREETA1 Hopkinsville, KY | 2.0 | 1.0 | 964 | $700 | $0.73 | 23d | 1 | 1.17mi |
| 2019 Oak St Hopkinsville, KY | 2.0 | 1.0 | 900 | $915 | $1.02 | 45d | 1 | 1.20mi |
| 836 E 21st St Unit A Hopkinsville, KY | 2.0 | 1.0 | 850 | $1,025 | $1.21 | 45d | 1 | 1.22mi |
| 1050 Denzil Dr Hopkinsville, KY | 2.0 | 1.0–2.0 | 1105 | $1,138 | $1.03 | 15d | 21 | 1.27mi |
| 115 A Holley Dr Unit B Hopkinsville, KY | 3.0 | 2.0 | 1235 | $1,195 | $0.97 | 45d | 1 | 1.28mi |
| 115 A Holley Dr Unit B Hopkinsville, KY | 3.0 | 2.0 | 1235 | $1,195 | $0.97 | 23d | 1 | 1.28mi |
| 202 Morningside Dr Hopkinsville, KY | 3.0 | 2.0 | 1188 | $1,400 | $1.18 | 23d | 1 | 1.32mi |
| 601 Moores Dr Hopkinsville, KY | 3.0 | 2.0 | 1498 | $1,400 | $0.93 | 23d | 1 | 1.39mi |
| 405 S Wooldridge Rd Hopkinsville, KY | 2.0 | 1.0 | 1020 | $900 | $0.88 | 23d | 1 | 1.40mi |
| 1704 E 7th St Unit Na Hopkinsville, KY | 3.0 | 2.0 | 1321 | $1,550 | $1.17 | 15d | 1 | 1.40mi |
Listing history 19 events
-
2026-06-21days on market $129,900 Active 17 DOM
-
2026-06-18days on market $129,900 Active 14 DOM
-
2026-06-17days on market $129,900 Active 13 DOM
-
2026-06-16days on market $129,900 Active 12 DOM
-
2026-06-15days on market $129,900 Active 11 DOM
-
2026-06-14days on market $129,900 Active 9 DOM
-
2026-06-13days on market $129,900 Active 8 DOM
-
2026-06-10days on market $129,900 Active 6 DOM
-
2026-06-09days on market $129,900 Active 5 DOM
-
2026-06-08days on market $129,900 Active 4 DOM
-
2026-06-07remarks 509-char remark
-
2026-06-07statusdays on market $129,900 Active 3 DOM
-
2026-06-02days on market $129,900 Coming Soon 9 DOM
-
2026-06-01days on market $129,900 Coming Soon 8 DOM
-
2026-05-31days on market $129,900 Coming Soon 7 DOM
-
2026-05-30days on market $129,900 Coming Soon 6 DOM
-
2026-05-24historical $129,900
-
2021-12-30soldstatus $105,000 334-char remark
Show marketing remark (334 chars)
Beautifully remodeled inside and out! You are going to love this doll house with beautiful laminate and tile flooring throughout. New hickory kitchen cabinets, countertops. Bathroom with lovely tile flooring , new vanity, and tiled surrounding bathtub. New siding, roof, light fixtures. Updated windows, fenced back yard. A must see!
-
2021-12-08$119,000 334-char remark
Show marketing remark (334 chars)
Beautifully remodeled inside and out! You are going to love this doll house with beautiful laminate and tile flooring throughout. New hickory kitchen cabinets, countertops. Bathroom with lovely tile flooring , new vanity, and tiled surrounding bathtub. New siding, roof, light fixtures. Updated windows, fenced back yard. A must see!
ⓘ Source: listings_history table (triggers on properties + properties_extension) + one-shot
backfill from property_details.listing_events for pre-trigger history.
Tax reassessment forecast KY · Resets to sale price
- Current annual tax
- $758 · $63/mo
- Projected year-2 tax
- $1,117 · $93/mo
- Expected delta
- +$359/yr (+$30/mo · 47.4%)
ⓘ Screening estimate from a state-policy table — verify with the county assessor before closing.
Climate risk First Street
- Flood 1/10 Low FEMA zone X (unshaded) · 0% chance over 30 yrs
- Wildfire 1/10 Low
- Heat 5/10 Major 7 d/yr ≥108°F today · 21 d/yr by 30 yrs out
- Wind 3/10 Moderate 7% chance of damaging wind over 30 yrs
- Air quality 2/10 Low 0 unhealthy d/yr today · 1 by 30 yrs out
Nearby sold comps map
Loading sold comps map…
Walkable amenities ~0.75 mi
Loading nearby amenities…
Taxation est. · year 1
- Rental income
- $12,092
- − Mortgage interest
- −$7,276
- − Property taxes
- −$758
- − Insurance
- −$650
- − Repairs & maintenance
- −$967
- − Management
- −$967
- − Depreciation
- −$3,779
- Taxable loss
- −$2,306
- Est. tax savings @ 24.0%
- +$553
- After-tax cash flow
- $524/yr
For passive investors: Depreciation is non-cash, so a rental often shows a tax loss while cash-flowing — sheltering income. Rental losses are passive: they offset passive income freely, and up to $25,000/yr can offset ordinary (W-2) income if you actively participate and your MAGI is under $100k (phasing out to $0 by $150k); unused losses carry forward. On sale, claimed depreciation is recaptured at up to 25%, and gains may owe capital-gains tax (a 1031 exchange can defer both). Figures are a year-1 estimate at your 24.0% rate — not tax advice; consult a CPA.
Schools (NCES district)
- District
- Christian County
- NCES district ID
- 2101150
- Math proficiency
- 30% ▼ -9.00%
- Reading proficiency
- 34% ▼ -10.00%
- Median HH income
- $38,961
- Composite
- 26.8/100
- National rank
- #7118
- State rank
- #93 of 165 in KY
Livability — Hopkinsville
- Score
- 64/100
- State rank
- #305
- US rank
- #14474
Category grades
Schools grade is shown separately in the Schools card above.
Census & demographics
- Census place
- Hopkinsville, KY
- County
- Christian County · 51,080 people
- City population
- 41,415
- Metro
- Clarksville, TN-KY
- Population (ZIP)
- 41,415
- Household income
- $51,534
- Rent vs Own
- Severe rent burden
- 1475.0
Population outlook (Christian County) Hauer SSP2
- Today (2025)
- 67,861 people
- By 2030
- 65,808 · -3.0%
- By 2040
- 60,090 · -11.5%
- By 2050
- 54,561 · -19.6%
- By 2075
- 45,859 · -32.4%
- By 2100
- 38,310 · -43.5%
Race, ethnicity, and origin ACS 2023
- Neighborhood character
- Majority White (65%)
- Race & ethnicity
- White 65% Black 23% Two or more races 7% Hispanic / Latino 4%
- Common ancestry
- Slovak 3% Italian 1% Romanian 1%
- Foreign-born
- 3% · Canada
- Languages at home
- 95% English-only · Spanish 3% German/W. Germanic 1%
Political lean MEDSL · Christian
- 2024 margin
- Solid R (+33.6) · D 32.6% · R 66.1% · Other 1.3%
- 2008→2024 swing
- -12.4pp toward R · 2008: -21.2pp · 2024: -33.6pp
- All cycles
- 2024: R+33.6 2020: R+28.4 2016: R+31.4 2012: R+23.8 2008: R+21.2
Not yet ingested
- Civics
- —
Market trends
- HPI YoY
- ▼ -49.36%
- Current HPI
- 233.3958
- Rent YoY
- ▲ 6.61%
- Metro
- Clarksville, TN-KY
- State GDP YoY
- ▲ 1.81%
- F500 in state
- 4
Industry mix (Fortune 500 HQ in KY)
| Industry | F500 HQs | Revenue |
|---|---|---|
| Healthcare | 1 | $118B |
|
||
| Food / Beverage | 1 | $7B |
|
||
Price history
+9.2% since first listed3 events — show timeline
- 2026-05-24 Coming Soon $129,900 REALTRACS as Distributed by MLS Grid
- 2021-12-30 Sold (MLS) $105,000 HCTCBOR
- 2021-12-08 Listed $119,000 HCTCBOR
Property tax history
+13.4%/yrLatest (2025): $758 · -4.4% YoY. Source: county tax records.
Cash-flow waterfall
monthlySold comps — $/sqft
last 12 mo · ≤1 miLoading sold comps…