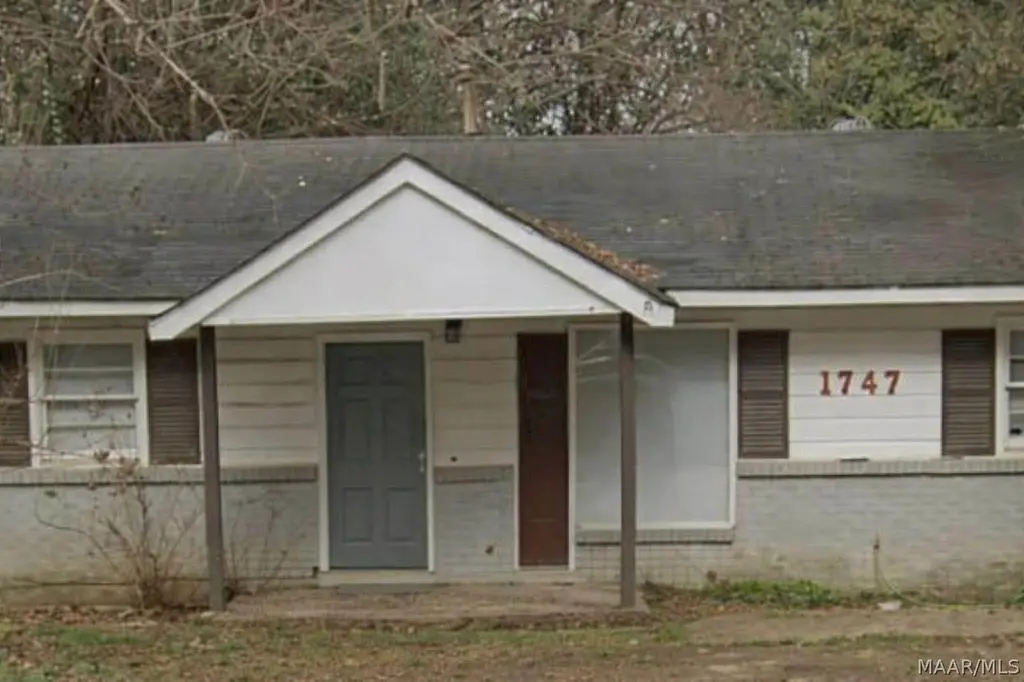
1747 Champion St · Montgomery, AL
Flood risk 1/10 · Minimal
- FEMA flood zone
- X (unshaded)
- Chance of flooding over 30 yrs
- 0.0%
- Est. flood insurance / yr
- $507 – $1,088
Fire risk 3/10 · Minor
- Est. fire insurance / yr
- $916 – $1,700
Heat risk 7/10 · Major
- Hot days now (above 107°F)
- 7 days/yr
- Hot days in 30 yrs
- 20 days/yr
Wind risk 8/10 · Major
- Chance of severe wind over 30 yrs
- 80.0%
Air-quality risk 3/10 · Minor
- Unhealthy air days now
- 4 days/yr
- Unhealthy air days in 30 yrs
- 4 days/yr
Risk factors via First Street. Map © Google.
Why this score? — see what drove the C grade
The composite is a weighted blend of 9 inputs, each scored 0–100. Each bar is that input's sub-score; the figure is the points it added to the 100-point composite (weight × sub-score).
- Cash flow +30.0/30.0
- 1% rule +10.0/10.0
- DSCR +10.0/10.0
- Livability +3.2/5.0
- Rent growth +2.5/5.0
- Condition / age +2.5/5.0
- Schools +1.7/10.0
- ARV discount +0.0/15.0
- Appreciation +0.0/10.0
$60,000
🖨 Deal sheet 📄 Offer letter ✓ Due diligence
Listing remarks MLS
?? Investment Opportunity – 1747 Champion St, Montgomery, AL Great opportunity to add to your rental portfolio! This property is located in an established area of Montgomery with strong rental demand. Ideal for investors seeking a cash-flowing asset or a value-add project. Featuring a functional layout and solid structure, this home offers plenty of potential with the right updates. Whether you’re looking to renovate and rent, fix and flip, or hold long-term, this property provides flexibility to fit your investment strategy. Conveniently located near major roads, shopping, and local amenities, making it attractive to future tenants. Sold as-is. Bring all offers!
Key facts
- Strong rental demand
- Near major roads
- Functional layout
Tags
Neighborhood map
What this means for you Summary
Snapshot
- This is a 3-bed/1.0-bath single-family listed at $60k.
Deal economics
- At list price, monthly cash flow is $450 ($5k/yr) — positive.
- The deal already cash-flows at list — no discount required.
- Meets the 1% rule at list price ($1k rent vs $60k).
- Recommended offer: $56k (6.0% below list) — sets the bar for market timing.
- Cap rate 15.3% vs local median 6.0% in Montgomery — top-decile yield for the area; either an underpriced asset or a hidden risk that comps aren't pricing in. Stress-test before assuming the spread holds.
Location & tenants
- Location reads 65/100 on livability (#138 in AL) — a middle-class / working-renter tenant base. Strengths: cost of living A+, housing A+; Watch: schools C-, employment D, crime F.
- Montgomery County (urban): math 9% / reading 31% proficiency, ranked #106 of 129 in AL (top 82%) — low school quality limits family demand, transient renter base, plan for 1-2y turnover; 70% free/reduced lunch — lower-income household profile, screen leases tightly.
- Market conditions: 62 active listings in the ZIP; 29 comparable units currently listed for rent nearby; rentals lingering (median 44d on market — plan ~5-8 weeks vacancy on turnover, expect pricing pressure); 69% of comp listings sitting > 30 days — soft ceiling on asking rent; 460 units permitted in Montgomery County in 2024 (37 in 5+ unit buildings).
Forward outlook
- Local home prices are declining (-3.0%/yr); year-one equity from $415 of loan paydown is wiped out by about $2k of value loss. Plan a longer hold.
- Montgomery County population projected to shrink 8% by 2050 — rents likely to lag national; underwrite the cash flow, not the appreciation.
- At projected returns (-3.0% appreciation + 3.0% rent growth), your $17k cash investment doubles in ~4 years — after that, you're playing with house money.
Negotiation context
- It's been on market 69 days — a 6% lower offer ($56k) is reasonable based on typical stale-listing flexibility.
- 5 sale attempts since 25y ago with the ask held roughly flat each time — persistent listings suggest the price (not the market) is what's stuck; bring a comps-based counter.
- Current owner paid $51k; 18% above their basis — modest negotiation headroom, anchor on the comps not their cost.
Risks & watch-outs
- Climate carrying-cost: severe wind risk, 80% chance of damaging wind over 30y; extreme-heat days projected 7→20/yr by 2055 (HVAC capex compounding) — expect insurance premiums to compound above CPI over the hold.
Questions for the listing agent
- It's been on market 69 days. Have you received any prior offers? Is the seller open to a 6% concession, seller financing, or rate buy-down credit?
- Built in 1963 — when were the roof, HVAC, electrical panel, plumbing, and water heater last replaced?
- Why hasn't it sold? Are there any deal-killer items the seller is aware of (foundation, flood, title, zoning, code violations)?
- Is there a deadline driving the sale (1031 exchange, divorce, estate, relocation)? That informs how much negotiation room exists.
- Crime grade is F in this area — have there been break-ins, vandalism, or insurance claims at this property in the last 3 years? What carrier currently insures it and at what premium?
- What's the average days-on-market for RENTAL listings here right now (not sales)? A rising rental-DOM trend means longer vacancies and softer asking-rent achievability than the comps imply.
- What's the recent tenant-quality profile in this submarket — average credit score on applications, eviction rate, late-payment / NSF rate, and stable-employment percentage? A property-management company in the area should have these aggregated.
- How much new for-sale + rental construction is in the pipeline within 1–3 miles? Heavy new supply typically softens prices + rents 12–24 months out; constrained supply supports both.
Investment metrics
- 1% rule
- 1.74% ✓
- Cap rate
- 15.29%
- Cash-on-cash
- 32.15%
- DSCR
- 2.43
- GRM
- 4.8
CMA / ARV
- ARV (median comp)
- $43,935
- List price
- $60,000
- Delta
- 36.57%
- Verdict
- OVERPRICED
- Comps
- 20 within 1.0 mi
Show comp detail 12 sales within ~0.75 mi
| Address | Dist | Beds/Ba | Sqft | Sold | Price | $/sf | Match |
|---|---|---|---|---|---|---|---|
| 1625 Champion St | 0.19mi | 3/1.0 | 840 (-3%) | 0mo | $72,500 | $86 | 86 |
| 298 Broadway St | 0.26mi | 2/1.0 (-1) | 896 (+4%) | 2mo | $36,000 | $40 | 75 |
| 218 Broadway St | 0.17mi | 2/1.0 (-1) | 960 (+11%) | 1mo | $49,000 | $51 | 68 |
| 1848 Gibson St | 0.36mi | 3/1.0 | 925 (+7%) | 7mo | $50,000 | $54 | 66 |
| 3560 Manley Dr | 0.43mi | 3/1.0 | 950 (+10%) | 2mo | $60,000 | $63 | 62 |
| 1818 Austin St | 0.45mi | 3/1.0 | 925 (+7%) | 7mo | $66,980 | $72 | 62 |
| 1825 Texas Ct | 0.48mi | 3/1.0 | 925 (+7%) | 7mo | $50,000 | $54 | 60 |
| 1800 Cotton Ct | 0.39mi | 3/1.0 | 962 (+11%) | 5mo | $62,500 | $65 | 58 |
| 3915 Fairground Rd | 0.56mi | 2/1.0 (-1) | 792 (-8%) | 6mo | $39,500 | $50 | 50 |
| 3123 Fairground Rd | 0.65mi | 3/1.0 | 962 (+11%) | 2mo | $64,000 | $67 | 49 |
| 121 Kiwanis St | 0.56mi | 3/1.0 | 735 (-15%) | 1mo | $27,000 | $37 | 48 |
| 101 Brockway Dr | 0.56mi | 3/1.0 | 980 (+13%) | 6mo | $16,000 | $16 | 46 |
Match score weights: distance 35% · size 25% · config 20% · recency 20%. Top-matched comps best support the ARV.
Projected returns pro-forma
-3.0% appreciation · 3.0% rent growth · sell at horizon
- IRR
- 27.1%
- Equity multiple
- 2.13×
- Total profit
- $18,933
- Equity at exit
- $8,946
- IRR
- 34.7%
- Equity multiple
- 4.18×
- Total profit
- $53,363
- Equity at exit
- $5,188
Cash invested: $16,800 (down + closing). Projections, not guarantees.
Landlord ↔ Tenant lean methodology
- Overall (STATE)
- 90 Strongly Landlord-Friendly
- State Alabama
- 90 Strongly Landlord-Friendly · R+15
- County
- — inherits STATE
- City
- — inherits STATE
ZIP-level market 36110
- Home prices YoY
- -34.8%
- Active inventory
- 62
- Price-to-rent
- 4.8×
Monthly cashflow live
- Estimated rent
- $1,045 high interval (Pro) →
- Mortgage (P&I)
- −$315
- Tax from tax record
- −$36 /mo · $428/yr
- Insurance
- −$25
- HOA
- −$0
- Vacancy / Maint / Mgmt
- −$219
- Net cashflow
- $450
Break-even live
UW: 25.0% down · 7.5% · 30yr · 1.5% tax · 5.0% vac · 8.0% maint · 8.0% mgmt
Financing live
Cash to close
- Down payment
- $15,000
- Closing costs
- $1,800
- Reserves months
- —
- Total cash needed
- —
Loan-product check · same deal, 3 products live
Conventional
25% down · 7.5% · 30yr
- Down + closing
- —
- Monthly P&I
- —
- Monthly cashflow
- —
- DSCR
- —
- Eligible?
- —
Personal DTI + credit; lowest rate.
DSCR
20% down · 8.5% · 30yr
- Down + closing
- —
- Monthly P&I
- —
- Monthly cashflow
- —
- DSCR
- —
- Eligible?
- —
No personal income docs; deal must DSCR.
Hard money
10% down · 12.0% · 12mo
- Down + closing
- —
- Monthly P&I
- —
- Monthly cashflow
- —
- DSCR
- —
- Eligible?
- —
Short-term bridge; refi at stabilization.
Rent comps 29 comps
| Address | Beds | Baths | Sqft | Rent | $/sqft | DOM | Units | Dist |
|---|---|---|---|---|---|---|---|---|
| 3329 Texas St Montgomery, AL | 3.0 | 1.0 | 1000 | $1,100 | $1.10 | 43d | 1 | 0.16mi |
| 218 Broadway St Montgomery, AL | 2.0 | 1.0 | 960 | $895 | $0.93 | 13d | 1 | 0.17mi |
| 216 Gardendale Dr Montgomery, AL | 3.0 | 1.0 | 900 | $850 | $0.94 | 21d | 1 | 0.23mi |
| 298 Broadway St Montgomery, AL | 2.0 | 1.0 | 896 | $900 | $1.00 | 43d | 1 | 0.26mi |
| 341 Chisholm St Montgomery, AL | 3.0 | 1.0 | 756 | $1,195 | $1.58 | 21d | 1 | 0.31mi |
| 3114 Cotton St Montgomery, AL | 3.0 | 1.0 | 888 | $1,100 | $1.24 | 43d | 1 | 0.34mi |
| 2107 Yarbrough Cir Montgomery, AL | 3.0 | 1.0 | 910 | $925 | $1.02 | 43d | 1 | 0.37mi |
| 2111 Yarbrough St Montgomery, AL | 3.0 | 1.0 | 962 | $795 | $0.83 | 43d | 1 | 0.40mi |
| 4010 Vandiver Ct Montgomery, AL | 2.0 | 2.0 | 630 | $1,050 | $1.67 | 43d | 1 | 0.42mi |
| 3042 George B Edmondson Dr Montgomery, AL | 3.0 | 1.0 | 900 | $860 | $0.96 | 43d | 1 | 0.47mi |
| 1817 Texas Ct Montgomery, AL | 3.0 | 1.0 | 925 | $1,050 | $1.14 | 21d | 1 | 0.50mi |
| 16 Garden St Montgomery, AL | 3.0 | 1.5 | 1008 | $775 | $0.77 | 44d | 1 | 0.52mi |
| 3613 Erwin Dr Montgomery, AL | 3.0 | 2.0 | 1092 | $1,250 | $1.14 | 43d | 1 | 0.53mi |
| 207 Destin St Montgomery, AL | 3.0 | 1.0 | 966 | $695 | $0.72 | 21d | 1 | 0.54mi |
| 4029 Chelsea Dr Montgomery, AL | 3.0 | 1.0 | 1000 | $1,200 | $1.20 | 43d | 1 | 0.56mi |
| 2056 Midway St Montgomery, AL | 3.0 | 1.0 | 1110 | $985 | $0.89 | 43d | 1 | 0.67mi |
| 2076 Midway St Montgomery, AL | 3.0 | 1.0 | 1068 | $1,000 | $0.94 | 43d | 1 | 0.70mi |
| 429 Edward St Montgomery, AL | 3.0 | 1.0 | 828 | $1,080 | $1.30 | 13d | 1 | 0.77mi |
| 412 Edward St Montgomery, AL | 3.0 | 1.0 | 828 | $800 | $0.97 | 43d | 1 | 0.77mi |
| 142 W Michigan Ave Montgomery, AL | 3.0 | 1.0 | 840 | $995 | $1.18 | 13d | 1 | 0.78mi |
| 2503 Skyline Ave Montgomery, AL | 3.0 | 1.0 | 1015 | $1,150 | $1.13 | 43d | 1 | 1.02mi |
| 105 Dyas Ct Montgomery, AL | 3.0 | 1.0 | 1025 | $1,095 | $1.07 | 43d | 1 | 1.09mi |
| 1324 Federal Dr Montgomery, AL | 2.0 | 1.0 | 1000 | $1,100 | $1.10 | 43d | 1 | 1.12mi |
| 2006 Harmon St Unit 3 Montgomery, AL | 3.0 | 1.0 | 800 | $500 | $0.62 | 43d | 1 | 1.14mi |
| 3024 Tyler Rd Montgomery, AL | 3.0 | 1.0 | 892 | $725 | $0.81 | 21d | 1 | 1.22mi |
| 408 Briarbrook Dr #204 Montgomery, AL | 3.0 | 2.0 | 1025 | $1,000 | $0.98 | 43d | 1 | 1.24mi |
| 408 Briarbrook Dr Montgomery, AL | 3.0 | 2.0 | 1025 | $960 | $0.94 | 21d | 1 | 1.24mi |
| 325 3rd St Montgomery, AL | 2.0 | 1.0 | 925 | $850 | $0.92 | 43d | 1 | 1.27mi |
| 3070 Tremont St Montgomery, AL | 3.0 | 1.0 | 1102 | $1,450 | $1.32 | 43d | 1 | 1.40mi |
Listing history 23 events
-
2026-06-18days on market $60,000 Active 69 DOM
-
2026-06-17days on market $60,000 Active 68 DOM
-
2026-06-16days on market $60,000 Active 67 DOM
-
2026-06-15days on market $60,000 Active 66 DOM
-
2026-06-14days on market $60,000 Active 64 DOM
-
2026-06-13days on market $60,000 Active 63 DOM
-
2026-06-10days on market $60,000 Active 61 DOM
-
2026-06-09days on market $60,000 Active 60 DOM
-
2026-06-08days on market $60,000 Active 59 DOM
-
2026-06-07days on market $60,000 Active 58 DOM
-
2026-06-03days on market $60,000 Active 54 DOM
-
2026-06-02days on market $60,000 Active 53 DOM
-
2026-06-01days on market $60,000 Active 52 DOM
-
2026-05-31days on market $60,000 Active 51 DOM
-
2026-05-30days on market $60,000 Active 50 DOM
-
2026-04-10$60,000 Active 686-char remark
Show marketing remark (686 chars)
?? Investment Opportunity – 1747 Champion St, Montgomery, AL Great opportunity to add to your rental portfolio! This property is located in an established area of Montgomery with strong rental demand. Ideal for investors seeking a cash-flowing asset or a value-add project. Featuring a functional layout and solid structure, this home offers plenty of potential with the right updates. Whether you’re looking to renovate and rent, fix and flip, or hold long-term, this property provides flexibility to fit your investment strategy. Conveniently located near major roads, shopping, and local amenities, making it attractive to future tenants. Sold as-is. Bring all offers!
-
2017-10-18soldstatus $50,750
-
2017-10-10soldstatus $29,000 571-char remark
Show marketing remark (571 chars)
Beauty inside out. Completely remodeled cute house ready to move in NOW. New paint, ceramic tiles in the kitchen and dining nook. Modern laminate flooring with nice wood floor imitation design all over the house. Remodeled bathroom with new tiles. House is wired for a security alarm. Central AC, programmable thermostat. Yard is huge, easy to maintain with plenty of space for your barbecue evening or family gathering. Come and have a look! Mini-blinds, dishwasher and refrigerator will stay, microwave negotiable. MUST CALL AGENT BEFORE SHOWING. IMPORTANT INFORMATION.
-
2017-02-22$36,000 571-char remark
Show marketing remark (571 chars)
Beauty inside out. Completely remodeled cute house ready to move in NOW. New paint, ceramic tiles in the kitchen and dining nook. Modern laminate flooring with nice wood floor imitation design all over the house. Remodeled bathroom with new tiles. House is wired for a security alarm. Central AC, programmable thermostat. Yard is huge, easy to maintain with plenty of space for your barbecue evening or family gathering. Come and have a look! Mini-blinds, dishwasher and refrigerator will stay, microwave negotiable. MUST CALL AGENT BEFORE SHOWING. IMPORTANT INFORMATION.
-
2014-03-12$29,950
-
2003-03-05soldstatus $35,500
-
2002-10-22$39,000
-
2001-09-23$43,500
ⓘ Source: listings_history table (triggers on properties + properties_extension) + one-shot
backfill from property_details.listing_events for pre-trigger history.
Tax reassessment forecast AL · Resets to sale price
- Current annual tax
- $428 · $36/mo
- Projected year-2 tax
- $428 · $36/mo
- Expected delta
- $0/yr ($0/mo · 0.0%)
ⓘ Screening estimate from a state-policy table — verify with the county assessor before closing.
Climate risk First Street
- Flood 1/10 Low FEMA zone X (unshaded) · 0% chance over 30 yrs
- Wildfire 3/10 Moderate
- Heat 7/10 Severe 7 d/yr ≥107°F today · 20 d/yr by 30 yrs out
- Wind 8/10 Severe 80% chance of damaging wind over 30 yrs
- Air quality 3/10 Moderate 4 unhealthy d/yr today · 4 by 30 yrs out
Nearby sold comps map
Loading sold comps map…
Walkable amenities ~0.75 mi
Loading nearby amenities…
Taxation est. · year 1
- Rental income
- $12,537
- − Mortgage interest
- −$3,361
- − Property taxes
- −$428
- − Insurance
- −$300
- − Repairs & maintenance
- −$1,003
- − Management
- −$1,003
- − Depreciation
- −$1,745
- Taxable income
- $4,697
- Est. tax owed @ 24.0%
- −$1,127
- After-tax cash flow
- $4,273/yr
For passive investors: Depreciation is non-cash, so a rental often shows a tax loss while cash-flowing — sheltering income. Rental losses are passive: they offset passive income freely, and up to $25,000/yr can offset ordinary (W-2) income if you actively participate and your MAGI is under $100k (phasing out to $0 by $150k); unused losses carry forward. On sale, claimed depreciation is recaptured at up to 25%, and gains may owe capital-gains tax (a 1031 exchange can defer both). Figures are a year-1 estimate at your 24.0% rate — not tax advice; consult a CPA.
Schools (NCES district)
- District
- Montgomery County
- NCES district ID
- 0102430
- Math proficiency
- 9% ▼ -21.00%
- Reading proficiency
- 31% ▼ -1.00%
- Median HH income
- $43,902
- Composite
- 17.24/100
- National rank
- #9093
- State rank
- #106 of 129 in AL
Livability — Montgomery
- Score
- 65/100
- State rank
- #138
- US rank
- #13416
Category grades
Schools grade is shown separately in the Schools card above.
Census & demographics
- Census place
- Montgomery, AL
- County
- Montgomery County · 190,016 people
- City population
- 175,913
- Metro
- Montgomery, AL
- Population (ZIP)
- 12,102
- Household income
- $47,315
- Rent vs Own
- Severe rent burden
- 753.0
Population outlook (Montgomery County) Hauer SSP2
- Today (2025)
- 224,008 people
- By 2030
- 221,460 · -1.1%
- By 2040
- 214,179 · -4.4%
- By 2050
- 204,912 · -8.5%
- By 2075
- 177,821 · -20.6%
- By 2100
- 145,134 · -35.2%
Race, ethnicity, and origin ACS 2023
- Neighborhood character
- Predominantly Black (83%)
- Race & ethnicity
- Black 83% White 11% Two or more races 3% Asian 2% Hispanic / Latino 1%
- Common ancestry
- Hispanic 1%
- Foreign-born
- 2% · China, Canada
- Languages at home
- 96% English-only · Spanish 2% Other Asian/Pacific 1%
Political lean MEDSL · Montgomery
- 2024 margin
- Solid D (+30.7) · D 64.8% · R 34.1% · Other 1.1%
- 2008→2024 swing
- +11.5pp toward D · 2008: 19.2pp · 2024: 30.7pp
- All cycles
- 2024: D+30.7 2020: D+31.5 2016: D+26.2 2012: D+24.3 2008: D+19.2
Not yet ingested
- Civics
- —
Market trends
- HPI YoY
- ▼ -35.37%
- Current HPI
- 66.3114
- Rent YoY
- —
- Metro
- Montgomery, AL
- State GDP YoY
- ▲ 2.94%
- F500 in state
- 4
Industry mix (Fortune 500 HQ in AL)
| Industry | F500 HQs | Revenue |
|---|---|---|
| Financial Services | 1 | $8B |
|
||
| Healthcare | 1 | $5B |
|
||
Price history
+37.9% since first listed8 events — show timeline
- 2026-04-10 Listed $60,000 MAAR
- 2017-10-18 Sold (Public Records) $50,750 Public Records
- 2017-10-10 Sold (MLS) $29,000 MAAR
- 2017-02-22 Listed $36,000 MAAR
- 2014-03-12 Listed $29,950 MAAR
- 2003-03-05 Sold (MLS) $35,500 MAAR
- 2002-10-22 Listed $39,000 MAAR
- 2001-09-23 Listed $43,500 MAAR
Property tax history
+4.6%/yrLatest (2025): $428 · +1.4% YoY. Source: county tax records.
Cash-flow waterfall
monthlySold comps — $/sqft
last 12 mo · ≤1 miLoading sold comps…