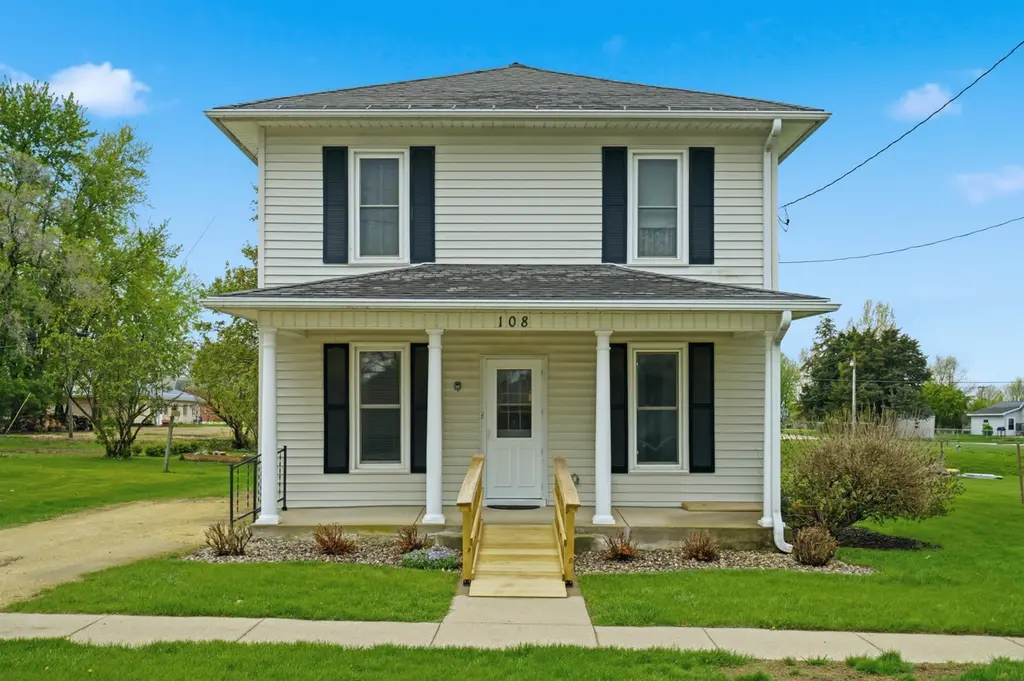
108 W Elm St · Strawberry Point, IA
Flood risk 1/10 · Minimal
- FEMA flood zone
- X (unshaded)
- Chance of flooding over 30 yrs
- 0.0%
- Est. flood insurance / yr
- $473 – $860
Fire risk 3/10 · Minor
- Est. fire insurance / yr
- $902 – $1,676
Heat risk 2/10 · Minimal
- Hot days now (above 100°F)
- 7 days/yr
- Hot days in 30 yrs
- 15 days/yr
Wind risk 2/10 · Minimal
- Chance of severe wind over 30 yrs
- —
Air-quality risk 1/10 · Minimal
- Unhealthy air days now
- 0 days/yr
- Unhealthy air days in 30 yrs
- 0 days/yr
Risk factors via First Street. Map © Google.
Why this score? — see what drove the B- grade
The composite is a weighted blend of 9 inputs, each scored 0–100. Each bar is that input's sub-score; the figure is the points it added to the 100-point composite (weight × sub-score).
- Cash flow +25.2/30.0
- ARV discount +15.0/15.0
- DSCR +8.3/10.0
- 1% rule +5.9/10.0
- Schools +5.5/10.0
- Livability +3.6/5.0
- Rent growth +2.5/5.0
- Condition / age +2.5/5.0
- Appreciation +0.0/10.0
$115,000
🖨 Deal sheet (PDF) 📄 Offer letter ✓ Due diligence
Listing remarks
Step into this comfortable 2-story home offering over 1,500 square feet of living space and plenty of potential to make it your own. The main floor features a spacious layout with a large living room, dedicated dining area and an oversized kitchen with an abundance of cabinetry—plus enough room to add a table or island if desired. You’ll also appreciate the convenience of a main-floor bedroom and ¾ bath. Laundry hookups located in the main-floor bedroom and are also available in the basement for added flexibility. Upstairs, you’ll find three generously sized bedrooms along with a half bath. Enjoy morning coffee on the covered front porch or unwind in the shade of th
Key facts
- Covered front porch
- Rear covered patio
- Main floor bedroom
Tags
Property features AI
Exterior
- Parking: No designated parking
- Utilities: Public water; Public sewer
- Home design: Residential single-family home; R-1 zoning
- Construction: Vinyl siding; Shingle/asphalt roof; Has basement (partially finished)
- Exterior features: Covered patio/porch; Concrete road surface
Interior
- Kitchen: Free-standing range; Refrigerator; Vented exhaust fan
- Bathrooms: One 3/4 bathroom; One half bathroom
- Heating & cooling: Baseboard heating; Steam heating; Natural gas heating; Exhaust fan for ventilation; No central cooling
- Interior features: Eat-in kitchen; Partially finished basement
- Laundry & utility: Washer; Dryer; Laundry on main level and lower level; Electric water heater
Neighborhood map
What this means for you Summary
Snapshot
- This is a 4-bed/1.5-bath single-family listed at $115k.
Deal economics
- At list price, monthly cash flow is $258 ($3k/yr) — positive.
- The deal already cash-flows at list — no discount required.
- Meets the 1% rule at list price ($1k rent vs $115k).
Location & tenants
- Location reads 72/100 on livability (#300 in IA) — a middle-class / working-renter tenant base. Strengths: crime A+, cost of living A+, housing A+; Watch: employment C-, amenities F, commute F.
- Starmont Community School District (rural): math 62% / reading 68% proficiency, ranked #202 of 289 in IA (top 70%) — acceptable for families but not a draw, mixed tenant base, ~2y average lease.
- Zoned schools: Starmont Elementary School (math 67% / reading 67%, grade B+, #273 of 616 statewide, top 51%, 264 students, 39% FRL); Starmont Middle School (math 57% / reading 72%, grade A-, #157 of 246 statewide, top 67%, 129 students, 43% FRL); Starmont High School (math 62% / reading 67%, grade B-, #211 of 336 statewide, top 70%, 191 students, 56% FRL).
- Market conditions: 16 active listings in the ZIP; 48 units permitted in Clayton County in 2024 (0 in 5+ unit buildings).
Forward outlook
- Local home prices are declining (-3.0%/yr); year-one equity from $795 of loan paydown is wiped out by about $3k of value loss. Plan a longer hold.
- Clayton County population projected at -21% by 2050 — secular population decline; favor cash flow + early exit over multi-decade hold.
Negotiation context
- Only 8 days on market — expect competitive offers; lowballing is unlikely to land.
Risks & watch-outs
- Watch-outs: built in 1900 — expect roof / HVAC / electrical / plumbing capex.
Questions for the listing agent
- Built in 1900 — when were the roof, HVAC, electrical panel, plumbing, and water heater last replaced?
- Is there a deadline driving the sale (1031 exchange, divorce, estate, relocation)? That informs how much negotiation room exists.
- Schools are F-rated, which usually means shorter tenancies and higher turnover. Who's the typical renter profile here, and what's been the actual vacancy rate?
- What's the average days-on-market for RENTAL listings here right now (not sales)? A rising rental-DOM trend means longer vacancies and softer asking-rent achievability than the comps imply.
- What's the recent tenant-quality profile in this submarket — average credit score on applications, eviction rate, late-payment / NSF rate, and stable-employment percentage? A property-management company in the area should have these aggregated.
- How much new for-sale + rental construction is in the pipeline within 1–3 miles? Heavy new supply typically softens prices + rents 12–24 months out; constrained supply supports both.
Investment metrics
- 1% rule
- 1.09% ✓
- Cap rate
- 8.98%
- Cash-on-cash
- 9.61%
- DSCR
- 1.43
- GRM
- 7.6
CMA / ARV
- ARV (median comp)
- $138,088
- List price
- $115,000
- Delta
- -16.72%
- Verdict
- UNDERPRICED
- Comps
- 20 within 1.0 mi
Show comp detail 11 sales within ~0.75 mi
| Address | Dist | Beds/Ba | Sqft | Sold | Price | $/sf | Match |
|---|---|---|---|---|---|---|---|
| 204 Commercial St | 0.10mi | 3/1.5 (-1) | 1,493 (-3%) | 8mo | $156,500 | $105 | 79 |
| 505 Commercial St | 0.31mi | 3/2.0 (-1) | 1,540 (+0%) | 14mo | $105,300 | $68 | 66 |
| 210 W Spring St | 0.15mi | 3/1.0 (-1) | 1,483 (-4%) | 18mo | $45,000 | $30 | 65 |
| 409 Commercial St | 0.16mi | 3/2.0 (-1) | 1,365 (-11%) | 10mo | $140,000 | $103 | 59 |
| 302 Buffalo St | 0.20mi | 3/1.5 (-1) | 1,344 (-12%) | 11mo | $93,000 | $69 | 56 |
| 110 Locust St | 0.21mi | 4/2.0 | 1,738 (+13%) | 21mo | $123,000 | $71 | 49 |
| 204 E Mission St | 0.26mi | 3/2.0 (-1) | 1,756 (+14%) | 10mo | $122,500 | $70 | 48 |
| 325 E Elm St | 0.43mi | 3/1.0 (-1) | 1,380 (-10%) | 10mo | $134,000 | $97 | 48 |
| 202 E Mission St | 0.25mi | 3/2.0 (-1) | 1,354 (-12%) | 17mo | $105,000 | $78 | 48 |
| 411 Elkader St | 0.62mi | 3/2.5 (-1) | 1,582 (+3%) | 21mo | $220,000 | $139 | 40 |
| 514 Westwood Ave | 0.33mi | 3/3.0 (-1) | 1,676 (+9%) | 24mo | $214,000 | $128 | 38 |
Match score weights: distance 35% · size 25% · config 20% · recency 20%. Top-matched comps best support the ARV.
Projected returns pro-forma
-3.0% appreciation · 3.0% rent growth · sell at horizon
- IRR
- -1.8%
- Equity multiple
- 0.93×
- Total profit
- $-2,237
- Equity at exit
- $17,147
- IRR
- 7.8%
- Equity multiple
- 1.59×
- Total profit
- $19,116
- Equity at exit
- $9,943
Cash invested: $32,200 (down + closing). Projections, not guarantees.
Landlord ↔ Tenant lean methodology
- Overall (STATE)
- 83 Strongly Landlord-Friendly
- State Iowa
- 83 Strongly Landlord-Friendly · R+6
- County
- — inherits STATE
- City
- — inherits STATE
ZIP-level market 52076
- Home prices YoY
- -6.1%
- Active inventory
- 16
- Price-to-rent
- 7.6×
Monthly cashflow live
- Estimated rent
- $1,255 medium interval (Pro) →
- Mortgage (P&I)
- −$603
- Tax from tax record
- −$83 /mo · $992/yr
- Insurance
- −$48
- HOA
- −$0
- Vacancy / Maint / Mgmt
- −$264
- Net cashflow
- $258
Break-even live
Sensitivity live
| Price | -10% $323 | -5% $290 | +0% $258 | +5% $225 | +10% $193 |
|---|---|---|---|---|---|
| Rent | -10% $159 | -5% $208 | +0% $258 | +5% $307 | +10% $357 |
| Rate | -1.0pp $316 | -0.5pp $287 | base $258 | +0.5pp $228 | +1.0pp $198 |
UW: 25.0% down · 7.5% · 30yr · 1.5% tax · 5.0% vac · 8.0% maint · 8.0% mgmt
Financing live
Cash to close
- Down payment
- $28,750
- Closing costs
- $3,450
- Reserves months
- —
- Total cash needed
- —
Loan-product check · same deal, 3 products live
Conventional
25% down · 7.5% · 30yr
- Down + closing
- —
- Monthly P&I
- —
- Monthly cashflow
- —
- DSCR
- —
- Eligible?
- —
Personal DTI + credit; lowest rate.
DSCR
20% down · 8.5% · 30yr
- Down + closing
- —
- Monthly P&I
- —
- Monthly cashflow
- —
- DSCR
- —
- Eligible?
- —
No personal income docs; deal must DSCR.
Hard money
10% down · 12.0% · 12mo
- Down + closing
- —
- Monthly P&I
- —
- Monthly cashflow
- —
- DSCR
- —
- Eligible?
- —
Short-term bridge; refi at stabilization.
Listing history 2 events
-
2026-05-07status Pending 1012-char remark
-
2026-04-29$115,000 Active 1012-char remark
ⓘ Source: listings_history table (triggers on properties + properties_extension) + one-shot
backfill from property_details.listing_events for pre-trigger history.
Tax reassessment forecast IA · Partial reset (capped growth)
- Current annual tax
- $992 · $83/mo
- Projected year-2 tax
- $1,399 · $117/mo
- Expected delta
- +$407/yr (+$34/mo · 41.0%)
ⓘ Screening estimate from a state-policy table — verify with the county assessor before closing.
Climate risk First Street
- Flood 1/10 Low FEMA zone X (unshaded) · 0% chance over 30 yrs
- Wildfire 3/10 Moderate
- Heat 2/10 Low 7 d/yr ≥100°F today · 15 d/yr by 30 yrs out
- Wind 2/10 Low
- Air quality 1/10 Low 0 unhealthy d/yr today · 0 by 30 yrs out
Nearby sold comps map
Loading sold comps map…
Walkable amenities ~0.75 mi
Loading nearby amenities…
Taxation est. · year 1
- Rental income
- $15,060
- − Mortgage interest
- −$6,442
- − Property taxes
- −$992
- − Insurance
- −$575
- − Repairs & maintenance
- −$1,205
- − Management
- −$1,205
- − Depreciation
- −$3,345
- Taxable income
- $1,296
- Est. tax owed @ 24.0%
- −$311
- After-tax cash flow
- $2,782/yr
For passive investors: Depreciation is non-cash, so a rental often shows a tax loss while cash-flowing — sheltering income. Rental losses are passive: they offset passive income freely, and up to $25,000/yr can offset ordinary (W-2) income if you actively participate and your MAGI is under $100k (phasing out to $0 by $150k); unused losses carry forward. On sale, claimed depreciation is recaptured at up to 25%, and gains may owe capital-gains tax (a 1031 exchange can defer both). Figures are a year-1 estimate at your 24.0% rate — not tax advice; consult a CPA.
Schools (NCES district)
- District
- Starmont Community School District
- NCES district ID
- 1927270
- Math proficiency
- 62% ▼ -8.00%
- Reading proficiency
- 68% ▲ 2.00%
- Median HH income
- $45,213
- Composite
- 54.75/100
- National rank
- #1319
- State rank
- #202 of 289 in IA
Livability — Strawberry Point
- Score
- 72/100
- State rank
- #300
- US rank
- #5806
Category grades
Schools grade is shown separately in the Schools card above.
Census & demographics
- Census place
- Strawberry Point, IA
- Population (ZIP)
- 2,231
Population outlook (Clayton County) Hauer SSP2
- Today (2025)
- 16,656 people
- By 2030
- 15,986 · -4.0%
- By 2040
- 14,554 · -12.6%
- By 2050
- 13,187 · -20.8%
- By 2075
- 11,131 · -33.2%
- By 2100
- 9,733 · -41.6%
Race, ethnicity, and origin ACS 2023
- Neighborhood character
- Predominantly White (96%)
- Race & ethnicity
- White 96% Two or more races 3%
- Common ancestry
- Portuguese 4% Slovak 2% Iranian 2%
- Foreign-born
- 1%
- Languages at home
- 98% English-only · Spanish 1% German/W. Germanic 1%
Political lean MEDSL · Clayton
- 2024 margin
- Solid R (+34.5) · D 32.2% · R 66.7% · Other 1.2%
- 2008→2024 swing
- -51.7pp toward R · 2008: 17.2pp · 2024: -34.5pp
- All cycles
- 2024: R+34.5 2020: R+28.8 2016: R+22.8 2012: D+6.9 2008: D+17.2
Not yet ingested
- Civics
- —
Market trends
- HPI YoY
- ▼ -16.49%
- Current HPI
- 254.78
- Rent YoY
- —
- Metro
- —
- State GDP YoY
- ▲ 2.48%
- F500 in state
- 4
Industry mix (Fortune 500 HQ in IA)
| Industry | F500 HQs | Revenue |
|---|---|---|
| Financial Services | 1 | $16B |
|
||
| Retail / Convenience | 1 | $15B |
|
||
Price history
2 events — show timeline
- 2026-05-07 Pending — NEIRBR as distributed by MLS GRID
- 2026-04-29 Listed $115,000 NEIRBR as distributed by MLS GRID
Property tax history
-0.4%/yrLatest (2025): $992 · -4.4% YoY. Source: county tax records.
Cash-flow waterfall
monthlySold comps — $/sqft
last 12 mo · ≤1 miLoading sold comps…