2240 Mark St · Peck, MI
Flood risk No data
- FEMA flood zone
- —
- Chance of flooding over 30 yrs
- —
- Est. flood insurance / yr
- —
Fire risk No data
- Est. fire insurance / yr
- —
Heat risk No data
- Hot days now (above threshold)
- —
- Hot days in 30 yrs
- —
Wind risk No data
- Chance of severe wind over 30 yrs
- —
Air-quality risk No data
- Unhealthy air days now
- —
- Unhealthy air days in 30 yrs
- —
Risk factors via First Street. Map © Google.
Why this score? — see what drove the B+ grade
The composite is a weighted blend of 9 inputs, each scored 0–100. Each bar is that input's sub-score; the figure is the points it added to the 100-point composite (weight × sub-score).
- Cash flow +30.0/30.0
- ARV discount +15.0/15.0
- 1% rule +10.0/10.0
- DSCR +10.0/10.0
- Schools +3.2/10.0
- Livability +3.2/5.0
- Rent growth +2.5/5.0
- Condition / age +2.5/5.0
- Appreciation +0.0/10.0
$37,000
🖨 Deal sheet (PDF) 📄 Offer letter ✓ Due diligence
Listing remarks MLS
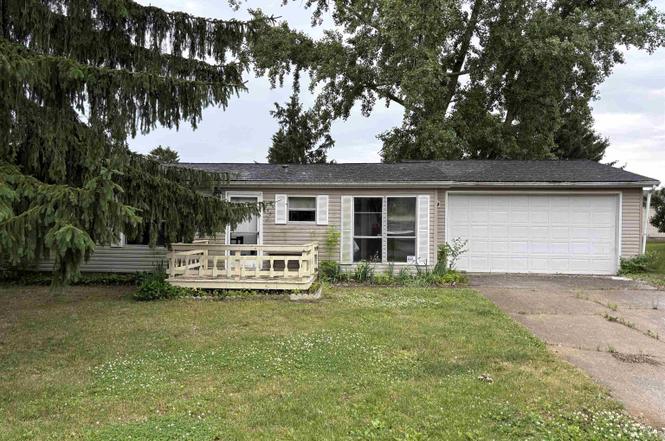
FINANCING AVAILABLE. This is a 3 bed 2 full bath double wide manufactured home. Home is in need of handy work throughout such as flooring, paint, and drywall in one of the bedrooms. Awesome 2 car garage. Close to downtown Lexington and Lake Huron.
Key facts
- 8,000 sq ft lot
- 2 garage spots
- Built 1991
Property features AI
Finance
- Other: On-waterfront location (waterfront features listed); Pets allowed — contact for details
- HOA & community: Homeowners association with a monthly fee of $460
Exterior
- Parking: Attached garage with 2 spaces
- Utilities: Shared well water; Shared septic system
- Home design: Single-family residence; One story
- Construction: Vinyl siding; Pillar/post/pier foundation
- Exterior features: Waterfront property and frontage; Paved road access; Lot dimensions approximately 80 x 100
Interior
- Bathrooms: 2 full bathrooms
- Heating & cooling: Central air conditioning; Forced air heating (natural gas)
- Interior features: Crawl space basement; 3 total rooms
Neighborhood map
What this means for you Summary
Snapshot
- This is a 3-bed/2.0-bath single-family listed at $37k.
Deal economics
- At list price, monthly cash flow is $331 ($4k/yr) — positive.
- The deal already cash-flows at list — no discount required.
- Meets the 1% rule at list price ($1k rent vs $37k).
- Recommended offer: $33k (12.0% below list) — sets the bar for market timing.
Location & tenants
- Location reads 64/100 on livability (#502 in MI) — a middle-class / working-renter tenant base. Strengths: crime A+, cost of living A+, housing A+; Watch: schools D-, amenities F, commute F.
- Croswell-Lexington Community Schools (rural): math 30% / reading 47% proficiency, ranked #239 of 540 in MI (top 44%) — families likely to look elsewhere, expect single-tenant / working-renter base with shorter leases.
- Market conditions: 51 active listings in the ZIP; 63 units permitted in Sanilac County in 2024 (0 in 5+ unit buildings).
Forward outlook
- Local home prices are declining (-3.0%/yr); year-one equity from $256 of loan paydown is wiped out by about $1k of value loss. Plan a longer hold.
- Sanilac County population projected at -31% by 2050 — secular population decline; favor cash flow + early exit over multi-decade hold.
- At projected returns (-3.0% appreciation + 3.0% rent growth), your $10k cash investment doubles in ~4 years — after that, you're playing with house money.
Negotiation context
- It's been on market 357 days — a 12% lower offer ($33k) is reasonable based on typical stale-listing flexibility.
- 5 sale attempts with the ask held roughly flat each time — persistent listings suggest the price (not the market) is what's stuck; bring a comps-based counter.
Risks & watch-outs
- Watch-outs: HOA is 35% of rent.
Questions for the listing agent
- It's been on market 357 days. Have you received any prior offers? Is the seller open to a 12% concession, seller financing, or rate buy-down credit?
- What does the HOA fee cover, when was the last increase, and are there any pending special assessments or reserve-fund shortfalls?
- Why hasn't it sold? Are there any deal-killer items the seller is aware of (foundation, flood, title, zoning, code violations)?
- Is there a deadline driving the sale (1031 exchange, divorce, estate, relocation)? That informs how much negotiation room exists.
- Schools are D-rated, which usually means shorter tenancies and higher turnover. Who's the typical renter profile here, and what's been the actual vacancy rate?
- What's the average days-on-market for RENTAL listings here right now (not sales)? A rising rental-DOM trend means longer vacancies and softer asking-rent achievability than the comps imply.
- What's the recent tenant-quality profile in this submarket — average credit score on applications, eviction rate, late-payment / NSF rate, and stable-employment percentage? A property-management company in the area should have these aggregated.
- How much new for-sale + rental construction is in the pipeline within 1–3 miles? Heavy new supply typically softens prices + rents 12–24 months out; constrained supply supports both.
Investment metrics
- 1% rule
- 3.58% ✓
- Cap rate
- 17.01%
- Cash-on-cash
- 38.28%
- DSCR
- 2.70
- GRM
- 2.3
CMA / ARV
- ARV (on-the-fly)
- $56,000
- Comps found
- 11
Show comp detail 11 sales within ~0.75 mi
| Address | Dist | Beds/Ba | Sqft | Sold | Price | $/sf | Match |
|---|---|---|---|---|---|---|---|
| 2293 Dennis St | 0.11mi | 3/2.0 | 1,400 (0%) | 10mo | $67,000 | $48 | 87 |
| 2276 Mark St | 0.07mi | 3/2.0 | 1,450 (+4%) | 11mo | $48,000 | $33 | 81 |
| 2201 Bart St | 0.12mi | 3/2.0 | 1,400 (0%) | 20mo | $58,500 | $42 | 78 |
| 2326 Mark St | 0.19mi | 3/2.0 | 1,500 (+7%) | 4mo | $65,000 | $43 | 76 |
| 2287 Mark St | 0.10mi | 3/2.0 | 1,450 (+4%) | 16mo | $44,000 | $30 | 76 |
| 2343 Tia St | 0.22mi | 3/2.0 | 1,500 (+7%) | 6mo | $64,900 | $43 | 73 |
| 2285 Brent St | 0.11mi | 3/2.0 | 1,444 (+3%) | 22mo | $59,500 | $41 | 71 |
| 2265 Dennis St | 0.03mi | 3/2.0 | 1,600 (+14%) | 14mo | $55,000 | $34 | 63 |
| 2237 Ranae St | 0.19mi | 3/2.0 | 1,200 (-14%) | 7mo | $20,000 | $17 | 62 |
| 2181 Mark St | 0.10mi | 3/2.0 | 1,600 (+14%) | 15mo | $50,000 | $31 | 59 |
| 2299 Bart St | 0.10mi | 2/2.0 (-1) | 1,200 (-14%) | 9mo | $48,000 | $40 | 59 |
Match score weights: distance 35% · size 25% · config 20% · recency 20%. Top-matched comps best support the ARV.
Projected returns pro-forma
-3.0% appreciation · 3.0% rent growth · sell at horizon
- IRR
- 34.8%
- Equity multiple
- 2.48×
- Total profit
- $15,358
- Equity at exit
- $5,517
- IRR
- 41.9%
- Equity multiple
- 5.03×
- Total profit
- $41,710
- Equity at exit
- $3,199
Cash invested: $10,360 (down + closing). Projections, not guarantees.
Landlord ↔ Tenant lean methodology
- Overall (STATE)
- 62 Landlord-Friendly
- State Michigan
- 62 Landlord-Friendly · EVEN
- County
- — inherits STATE
- City
- — inherits STATE
ZIP-level market 48422
- Home prices YoY
- -10.2%
- Active inventory
- 51
- Price-to-rent
- 2.3×
Monthly cashflow live
- Estimated rent
- $1,324 medium interval (Pro) →
- Mortgage (P&I)
- −$194
- Tax est. 1.5%
- −$46 /mo · $555/yr
- Insurance
- −$15
- HOA
- −$460
- Vacancy / Maint / Mgmt
- −$278
- Net cashflow
- $331
Break-even live
Sensitivity live
| Price | -10% $356 | -5% $343 | +0% $331 | +5% $318 | +10% $305 |
|---|---|---|---|---|---|
| Rent | -10% $226 | -5% $278 | +0% $331 | +5% $383 | +10% $435 |
| Rate | -1.0pp $349 | -0.5pp $340 | base $331 | +0.5pp $321 | +1.0pp $311 |
UW: 25.0% down · 7.5% · 30yr · 1.5% tax · 5.0% vac · 8.0% maint · 8.0% mgmt
Financing live
Cash to close
- Down payment
- $9,250
- Closing costs
- $1,110
- Reserves months
- —
- Total cash needed
- —
Loan-product check · same deal, 3 products live
Conventional
25% down · 7.5% · 30yr
- Down + closing
- —
- Monthly P&I
- —
- Monthly cashflow
- —
- DSCR
- —
- Eligible?
- —
Personal DTI + credit; lowest rate.
DSCR
20% down · 8.5% · 30yr
- Down + closing
- —
- Monthly P&I
- —
- Monthly cashflow
- —
- DSCR
- —
- Eligible?
- —
No personal income docs; deal must DSCR.
Hard money
10% down · 12.0% · 12mo
- Down + closing
- —
- Monthly P&I
- —
- Monthly cashflow
- —
- DSCR
- —
- Eligible?
- —
Short-term bridge; refi at stabilization.
HOA detail
- Monthly dues
- $460 · $5,520/yr
Listing history 23 events
-
2026-06-21days on market $37,000 Active 357 DOM
-
2026-06-18days on market $37,000 Active 354 DOM
-
2026-06-17days on market $37,000 Active 353 DOM
-
2026-06-16days on market $37,000 Active 352 DOM
-
2026-06-15days on market $37,000 Active 351 DOM
-
2026-06-13days on market $37,000 Active 349 DOM
-
2026-06-13days on market $37,000 Active 348 DOM
-
2026-06-09days on market $37,000 Active 345 DOM
-
2026-06-08days on market $37,000 Active 344 DOM
-
2026-06-07days on market $37,000 Active 343 DOM
-
2026-06-04days on market $37,000 Active 340 DOM
-
2026-06-03days on market $37,000 Active 339 DOM
-
2026-06-02days on market $37,000 Active 338 DOM
-
2026-06-01days on market $37,000 Active 337 DOM
-
2026-05-31days on market $37,000 Active 336 DOM
-
2026-03-31status Active
-
2026-03-27historical
-
2025-12-31status Active
Show marketing remark (247 chars)
FINANCING AVAILABLE. This is a 3 bed 2 full bath double wide manufactured home. Home is in need of handy work throughout such as flooring, paint, and drywall in one of the bedrooms. Awesome 2 car garage. Close to downtown Lexington and Lake Huron.
-
2025-12-31status Active 247-char remark
Show marketing remark (247 chars)
FINANCING AVAILABLE. This is a 3 bed 2 full bath double wide manufactured home. Home is in need of handy work throughout such as flooring, paint, and drywall in one of the bedrooms. Awesome 2 car garage. Close to downtown Lexington and Lake Huron.
-
2025-12-31historical
Show marketing remark (247 chars)
FINANCING AVAILABLE. This is a 3 bed 2 full bath double wide manufactured home. Home is in need of handy work throughout such as flooring, paint, and drywall in one of the bedrooms. Awesome 2 car garage. Close to downtown Lexington and Lake Huron.
-
2025-12-31historical 247-char remark
Show marketing remark (247 chars)
FINANCING AVAILABLE. This is a 3 bed 2 full bath double wide manufactured home. Home is in need of handy work throughout such as flooring, paint, and drywall in one of the bedrooms. Awesome 2 car garage. Close to downtown Lexington and Lake Huron.
-
2025-06-25$37,000 Active
Show marketing remark (247 chars)
FINANCING AVAILABLE. This is a 3 bed 2 full bath double wide manufactured home. Home is in need of handy work throughout such as flooring, paint, and drywall in one of the bedrooms. Awesome 2 car garage. Close to downtown Lexington and Lake Huron.
-
2025-06-25$37,000 Active 247-char remark
Show marketing remark (247 chars)
FINANCING AVAILABLE. This is a 3 bed 2 full bath double wide manufactured home. Home is in need of handy work throughout such as flooring, paint, and drywall in one of the bedrooms. Awesome 2 car garage. Close to downtown Lexington and Lake Huron.
ⓘ Source: listings_history table (triggers on properties + properties_extension) + one-shot
backfill from property_details.listing_events for pre-trigger history.
Nearby sold comps map
Loading sold comps map…
Walkable amenities ~0.75 mi
Loading nearby amenities…
Taxation est. · year 1
- Rental income
- $15,892
- − Mortgage interest
- −$2,073
- − Property taxes
- −$555
- − Insurance
- −$185
- − Repairs & maintenance
- −$1,271
- − Management
- −$1,271
- − HOA
- −$5,520
- − Depreciation
- −$1,076
- Taxable income
- $3,940
- Est. tax owed @ 24.0%
- −$946
- After-tax cash flow
- $3,021/yr
For passive investors: Depreciation is non-cash, so a rental often shows a tax loss while cash-flowing — sheltering income. Rental losses are passive: they offset passive income freely, and up to $25,000/yr can offset ordinary (W-2) income if you actively participate and your MAGI is under $100k (phasing out to $0 by $150k); unused losses carry forward. On sale, claimed depreciation is recaptured at up to 25%, and gains may owe capital-gains tax (a 1031 exchange can defer both). Figures are a year-1 estimate at your 24.0% rate — not tax advice; consult a CPA.
Schools (NCES district)
- District
- Croswell-Lexington Community Schools
- NCES district ID
- 2611140
- Math proficiency
- 30% ▼ -7.00%
- Reading proficiency
- 47% ▼ -6.00%
- Median HH income
- $42,784
- Composite
- 32.49/100
- National rank
- #5707
- State rank
- #239 of 540 in MI
Livability — Peck
- Score
- 64/100
- State rank
- #502
- US rank
- #14853
Category grades
Schools grade is shown separately in the Schools card above.
Census & demographics
- Population (ZIP)
- 6,172
Population outlook (Sanilac County) Hauer SSP2
- Today (2025)
- 37,948 people
- By 2030
- 35,772 · -5.7%
- By 2040
- 30,996 · -18.3%
- By 2050
- 26,280 · -30.7%
- By 2075
- 17,471 · -54.0%
- By 2100
- 10,572 · -72.1%
Race, ethnicity, and origin ACS 2023
- Neighborhood character
- Predominantly White (89%)
- Race & ethnicity
- White 89% Hispanic / Latino 7% Two or more races 4% Black 1%
- Hispanic origin (detail)
- Mexican 7%
- Common ancestry
- Romanian 9% Slovak 5% Lithuanian 3%
- Foreign-born
- 1% · Canada
- Languages at home
- 95% English-only · Spanish 5%
Political lean MEDSL · Sanilac
- 2024 margin
- Solid R (+47.7) · D 25.5% · R 73.2% · Other 1.3%
- 2008→2024 swing
- -39.6pp toward R · 2008: -8.1pp · 2024: -47.7pp
- All cycles
- 2024: R+47.7 2020: R+45.6 2016: R+44.5 2012: R+20.4 2008: R+8.1
Not yet ingested
- Civics
- —
Market trends
- HPI YoY
- ▼ -30.65%
- Current HPI
- 268.6695
- Rent YoY
- —
- Metro
- —
- State GDP YoY
- ▲ 1.37%
- F500 in state
- 28
Industry mix (Fortune 500 HQ in MI)
| Industry | F500 HQs | Revenue |
|---|---|---|
| Automotive Parts | 3 | $48B |
|
||
| Automotive | 2 | $372B |
|
||
| Chemicals | 1 | $45B |
|
||
| Automotive Retail | 1 | $29B |
|
||
| Healthcare / Medical Devices | 1 | $23B |
|
||
| Automotive Technology | 1 | $20B |
|
||
Price history
+0.0% since first listed8 events — show timeline
- 2026-03-31 Relisted — REALCOMP
- 2026-03-27 Listing Removed — REALCOMP
- 2025-12-31 Relisted — REALCOMP
- 2025-12-31 Relisted — MiRealSource-MiMLS
- 2025-12-31 Listing Removed — MiRealSource-MiMLS
- 2025-12-31 Listing Removed — REALCOMP
- 2025-06-25 Listed $37,000 REALCOMP
- 2025-06-25 Listed $37,000 MiRealSource-MiMLS
Cash-flow waterfall
monthlySold comps — $/sqft
last 12 mo · ≤1 miLoading sold comps…