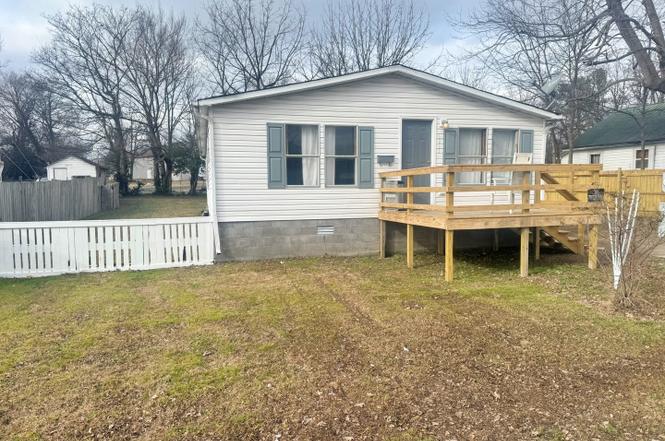
1213 Baynes St · Metropolis, IL
Flood risk No data
- FEMA flood zone
- —
- Chance of flooding over 30 yrs
- —
- Est. flood insurance / yr
- —
Fire risk No data
- Est. fire insurance / yr
- —
Heat risk No data
- Hot days now (above threshold)
- —
- Hot days in 30 yrs
- —
Wind risk No data
- Chance of severe wind over 30 yrs
- —
Air-quality risk No data
- Unhealthy air days now
- —
- Unhealthy air days in 30 yrs
- —
Risk factors via First Street. Map © Google.
Why this score? — see what drove the B- grade
The composite is a weighted blend of 9 inputs, each scored 0–100. Each bar is that input's sub-score; the figure is the points it added to the 100-point composite (weight × sub-score).
- Cash flow +30.0/30.0
- 1% rule +10.0/10.0
- DSCR +10.0/10.0
- ARV discount +7.5/15.0
- Livability +3.8/5.0
- Rent growth +2.5/5.0
- Condition / age +2.5/5.0
- Schools +2.2/10.0
- Appreciation +0.0/10.0
$64,900
🖨 Deal sheet 📄 Offer letter ✓ Due diligence
Listing remarks
3 bedroom, 2 bathroom mobile home on a double lot. All appliances will stay. Large kitchen with pantry and island. The primary bedroom has a walk in closet and it's own bathroom with garden tub. Updates include new front deck, some new fencing, new HVAC and new roof in 2024 and some new fixtures.
Key facts
- New fencing
- New hvac
- Double lot
Tags
Property features AI
Finance
- Other: Fee simple ownership; Property located in an unincorporated area (Metropolis township)
- HOA & community: No master association fees required
Exterior
- Parking: Two parking spaces
- Utilities: Public water; Public sewer
- Home design: Detached single-family home; One-story
- Construction: Built approximately 26–30 years ago; Vinyl siding construction
- Exterior features: Lot dimensions approximately 80 x 120; Lot is less than 0.25 acre; Vinyl siding
Interior
- Kitchen: Kitchen on the main level
- Bedrooms: Three bedrooms (all on the main level); Master bedroom on the main level with a full bath
- Bathrooms: Two full bathrooms
- Heating & cooling: Electric heating; Central air conditioning
- Interior features: Five total rooms
- Laundry & utility: Main-level laundry room (9 x 6)
Neighborhood map
What this means for you Summary
Snapshot
- This is a 3-bed/2.0-bath other listed at $65k.
Deal economics
- At list price, monthly cash flow is $432 ($5k/yr) — positive.
- The deal already cash-flows at list — no discount required.
- Meets the 1% rule at list price ($1k rent vs $65k).
- Recommended offer: $57k (12.0% below list) — sets the bar for market timing.
- Cap rate 14.3% vs local median 5.3% in Metropolis — top-decile yield for the area; either an underpriced asset or a hidden risk that comps aren't pricing in. Stress-test before assuming the spread holds.
Location & tenants
- Location reads 75/100 on livability (#217 in IL, #4,091 nationally) — a middle-class / working-renter tenant base. Strengths: cost of living A+, housing A+, health & safety A+; Watch: commute F, employment D-.
- Massac UD 1 (rural): math 24% / reading 28% proficiency, ranked #318 of 620 in IL (top 51%) — low school quality limits family demand, transient renter base, plan for 1-2y turnover.
- Zoned schools: Metropolis Elem School (math 11% / reading 15%, grade F, #1,362 of 2,056 statewide, top 66%, 484 students, 0% FRL); Massac Jr High School (math 25% / reading 36%, grade F, #241 of 665 statewide, top 37%, 244 students, 0% FRL); Massac County High School (math 12% / reading 27%, grade F, #397 of 693 statewide, top 61%, 583 students, 0% FRL) — zoned schools average 0% FRL vs 52% district-wide (52 pts lower); this property's tenant base skews higher-income than the district average.
- Market conditions: 73 active listings in the ZIP; 5 units permitted in Massac County in 2024 (0 in 5+ unit buildings).
Forward outlook
- Local home prices are declining (-3.0%/yr); year-one equity from $449 of loan paydown is wiped out by about $2k of value loss. Plan a longer hold.
- Massac County population projected at -28% by 2050 — secular population decline; favor cash flow + early exit over multi-decade hold.
- At projected returns (-3.0% appreciation + 3.0% rent growth), your $18k cash investment doubles in ~5 years — after that, you're playing with house money.
Negotiation context
- It's been on market 149 days — a 12% lower offer ($57k) is reasonable based on typical stale-listing flexibility.
Questions for the listing agent
- It's been on market 149 days. Have you received any prior offers? Is the seller open to a 12% concession, seller financing, or rate buy-down credit?
- Why hasn't it sold? Are there any deal-killer items the seller is aware of (foundation, flood, title, zoning, code violations)?
- Is there a deadline driving the sale (1031 exchange, divorce, estate, relocation)? That informs how much negotiation room exists.
- Schools are D-rated, which usually means shorter tenancies and higher turnover. Who's the typical renter profile here, and what's been the actual vacancy rate?
- What's the average days-on-market for RENTAL listings here right now (not sales)? A rising rental-DOM trend means longer vacancies and softer asking-rent achievability than the comps imply.
- What's the recent tenant-quality profile in this submarket — average credit score on applications, eviction rate, late-payment / NSF rate, and stable-employment percentage? A property-management company in the area should have these aggregated.
- How much new for-sale + rental construction is in the pipeline within 1–3 miles? Heavy new supply typically softens prices + rents 12–24 months out; constrained supply supports both.
Investment metrics
- 1% rule
- 1.76% ✓
- Cap rate
- 14.27%
- Cash-on-cash
- 28.50%
- DSCR
- 2.27
- GRM
- 4.7
CMA / ARV
No comps found within radius.
Projected returns pro-forma
-3.0% appreciation · 3.0% rent growth · sell at horizon
- IRR
- 22.8%
- Equity multiple
- 1.94×
- Total profit
- $17,002
- Equity at exit
- $9,677
- IRR
- 30.8%
- Equity multiple
- 3.77×
- Total profit
- $50,329
- Equity at exit
- $5,611
Cash invested: $18,172 (down + closing). Projections, not guarantees.
Landlord ↔ Tenant lean methodology
- Overall (STATE)
- 43 Moderately Tenant-Leaning
- State Illinois
- 43 Moderately Tenant-Leaning · D+7
- County
- — inherits STATE
- City
- — inherits STATE
ZIP-level market 62960
- Home prices YoY
- -19.6%
- Active inventory
- 73
- Price-to-rent
- 4.7×
Monthly cashflow live
- Estimated rent
- $1,145 medium interval (Pro) →
- Mortgage (P&I)
- −$340
- Tax from tax record
- −$106 /mo · $1,267/yr
- Insurance
- −$27
- HOA
- −$0
- Vacancy / Maint / Mgmt
- −$240
- Net cashflow
- $432
Break-even live
UW: 25.0% down · 7.5% · 30yr · 1.5% tax · 5.0% vac · 8.0% maint · 8.0% mgmt
Financing live
Cash to close
- Down payment
- $16,225
- Closing costs
- $1,947
- Reserves months
- —
- Total cash needed
- —
Loan-product check · same deal, 3 products live
Conventional
25% down · 7.5% · 30yr
- Down + closing
- —
- Monthly P&I
- —
- Monthly cashflow
- —
- DSCR
- —
- Eligible?
- —
Personal DTI + credit; lowest rate.
DSCR
20% down · 8.5% · 30yr
- Down + closing
- —
- Monthly P&I
- —
- Monthly cashflow
- —
- DSCR
- —
- Eligible?
- —
No personal income docs; deal must DSCR.
Hard money
10% down · 12.0% · 12mo
- Down + closing
- —
- Monthly P&I
- —
- Monthly cashflow
- —
- DSCR
- —
- Eligible?
- —
Short-term bridge; refi at stabilization.
Listing history 17 events
-
2026-06-18days on market $64,900 Active 149 DOM
-
2026-06-17days on market $64,900 Active 148 DOM
-
2026-06-16days on market $64,900 Active 147 DOM
-
2026-06-15days on market $64,900 Active 146 DOM
-
2026-06-13days on market $64,900 Active 144 DOM
-
2026-06-12days on market $64,900 Active 143 DOM
-
2026-06-09days on market $64,900 Active 140 DOM
-
2026-06-08days on market $64,900 Active 139 DOM
-
2026-06-07days on market $64,900 Active 138 DOM
-
2026-06-05days on market $64,900 Active 136 DOM
-
2026-06-04days on market $64,900 Active 134 DOM
-
2026-06-02days on market $64,900 Active 133 DOM
-
2026-06-01days on market $64,900 Active 132 DOM
-
2026-05-31days on market $64,900 Active 131 DOM
-
2026-05-31days on market $64,900 Active 130 DOM
-
2026-04-30price $64,900
-
2026-01-20$69,900 Active
ⓘ Source: listings_history table (triggers on properties + properties_extension) + one-shot
backfill from property_details.listing_events for pre-trigger history.
Tax reassessment forecast IL · Partial reset (capped growth)
- Current annual tax
- $1,267 · $106/mo
- Projected year-2 tax
- $1,370 · $114/mo
- Expected delta
- +$103/yr (+$9/mo · 8.1%)
ⓘ Screening estimate from a state-policy table — verify with the county assessor before closing.
Nearby sold comps map
Loading sold comps map…
Walkable amenities ~0.75 mi
Loading nearby amenities…
Taxation est. · year 1
- Rental income
- $13,739
- − Mortgage interest
- −$3,635
- − Property taxes
- −$1,267
- − Insurance
- −$324
- − Repairs & maintenance
- −$1,099
- − Management
- −$1,099
- − Depreciation
- −$1,888
- Taxable income
- $4,426
- Est. tax owed @ 24.0%
- −$1,062
- After-tax cash flow
- $4,116/yr
For passive investors: Depreciation is non-cash, so a rental often shows a tax loss while cash-flowing — sheltering income. Rental losses are passive: they offset passive income freely, and up to $25,000/yr can offset ordinary (W-2) income if you actively participate and your MAGI is under $100k (phasing out to $0 by $150k); unused losses carry forward. On sale, claimed depreciation is recaptured at up to 25%, and gains may owe capital-gains tax (a 1031 exchange can defer both). Figures are a year-1 estimate at your 24.0% rate — not tax advice; consult a CPA.
Schools (NCES district)
- District
- Massac UD 1
- NCES district ID
- 1725000
- Math proficiency
- 24% ▼ -13.00%
- Reading proficiency
- 28% ▼ -13.00%
- Median HH income
- $41,431
- Composite
- 22.06/100
- National rank
- #8192
- State rank
- #318 of 620 in IL
Livability — Metropolis
- Score
- 75/100
- State rank
- #217
- US rank
- #4091
Category grades
Schools grade is shown separately in the Schools card above.
Census & demographics
- Census place
- Metropolis, IL
- Population (ZIP)
- 10,823
Population outlook (Massac County) Hauer SSP2
- Today (2025)
- 13,461 people
- By 2030
- 12,675 · -5.8%
- By 2040
- 11,124 · -17.4%
- By 2050
- 9,711 · -27.9%
- By 2075
- 7,253 · -46.1%
- By 2100
- 5,666 · -57.9%
Race, ethnicity, and origin ACS 2023
- Neighborhood character
- Predominantly White (86%)
- Race & ethnicity
- White 86% Black 7% Two or more races 5% Hispanic / Latino 3%
- Common ancestry
- Romanian 2% Serbian 2% Lithuanian 2%
- Foreign-born
- 2% · Canada
- Languages at home
- 97% English-only · Spanish 2%
Political lean MEDSL · Massac
- 2024 margin
- Solid R (+48.8) · D 25.2% · R 74.0%
- 2008→2024 swing
- -25.4pp toward R · 2008: -23.4pp · 2024: -48.8pp
- All cycles
- 2024: R+48.8 2020: R+48.0 2016: R+49.6 2012: R+33.7 2008: R+23.4
Not yet ingested
- Civics
- —
Market trends
- HPI YoY
- ▼ -33.38%
- Current HPI
- 137.0772
- Rent YoY
- —
- Metro
- —
- State GDP YoY
- ▲ 1.59%
- F500 in state
- 60
Industry mix (Fortune 500 HQ in IL)
| Industry | F500 HQs | Revenue |
|---|---|---|
| Insurance | 4 | $201B |
|
||
| Consumer Goods | 4 | $87B |
|
||
| Industrial Machinery | 3 | $64B |
|
||
| Healthcare | 2 | $55B |
|
||
| Retail / Pharmacy | 1 | $148B |
|
||
| Agriculture / Food | 1 | $86B |
|
||
Price history
-7.2% since first listed2 events — show timeline
- 2026-04-30 Price Changed $64,900 MRED as Distributed by MLS Grid
- 2026-01-20 Listed $69,900 MRED as Distributed by MLS Grid
Property tax history
+2.3%/yrLatest (2022): $1,267 · +0.8% YoY. Source: county tax records.
Cash-flow waterfall
monthlySold comps — $/sqft
last 12 mo · ≤1 miLoading sold comps…