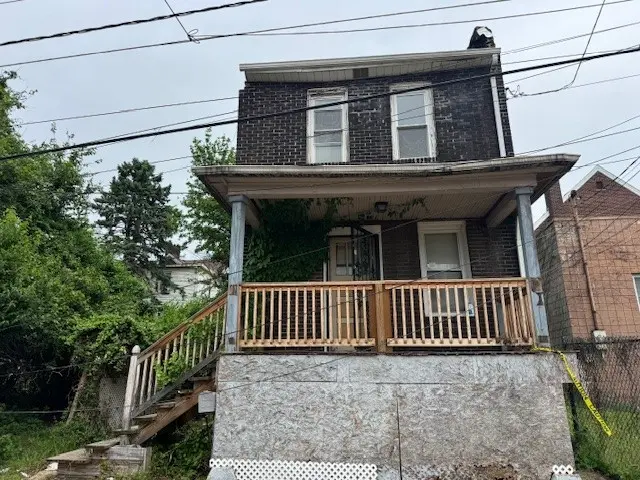
2462 Scott Way · Swissvale, PA
Flood risk 1/10 · Minimal
- FEMA flood zone
- X (unshaded)
- Chance of flooding over 30 yrs
- 0.0%
- Est. flood insurance / yr
- $473 – $860
Fire risk 1/10 · Minimal
- Est. fire insurance / yr
- $511 – $949
Heat risk 4/10 · Minor
- Hot days now (above 98°F)
- 7 days/yr
- Hot days in 30 yrs
- 18 days/yr
Wind risk 2/10 · Minimal
- Chance of severe wind over 30 yrs
- 0.0%
Air-quality risk 4/10 · Minor
- Unhealthy air days now
- 4 days/yr
- Unhealthy air days in 30 yrs
- 5 days/yr
Risk factors via First Street. Map © Google.
Why this score? — see what drove the B grade
The composite is a weighted blend of 9 inputs, each scored 0–100. Each bar is that input's sub-score; the figure is the points it added to the 100-point composite (weight × sub-score).
- Cash flow +30.0/30.0
- 1% rule +10.0/10.0
- DSCR +10.0/10.0
- ARV discount +7.5/15.0
- Livability +4.2/5.0
- Rent growth +4.0/5.0
- Condition / age +2.5/5.0
- Schools +1.8/10.0
- Appreciation +0.0/10.0
$40,000
🖨 Deal sheet (PDF) 📄 Offer letter ✓ Due diligence
Listing remarks
Fantastic Opportunity! This charming classic two-story home offers three generously sized bedrooms and one full bathroom. Spacious, light-filled rooms create an open and comfortable feel. The expansive kitchen serves as the true heart of the home. A full basement provides excellent storage and future possibilities. This is a smart opportunity to create lasting value and craft a truly personalized home. Come take a look and start envisioning the possibilities! Don’t miss your chance to make this house your own.
Key facts
- 1,820 sq ft lot
- Built 1915
- Listed 31 days
Property features AI
Finance
- Financial info: Annual property tax around $1,107
Exterior
- Parking: On-street parking
- Home design: 2-story brick home; Resale property
- Construction: Brick construction
- Exterior features: Small lot (approximately 0.0418 acres)
Interior
- Bathrooms: 1 full bathroom
- Interior features: Unfinished basement
Neighborhood map
What this means for you Summary
Snapshot
- This is a 3-bed/1.0-bath single-family listed at $40k.
Deal economics
- At list price, monthly cash flow is $920 ($11k/yr) — positive.
- The deal already cash-flows at list — no discount required.
- Meets the 1% rule at list price ($2k rent vs $40k).
- Recommended offer: $39k (3.0% below list) — sets the bar for market timing.
- Cap rate 33.9% vs local median 6.5% in Swissvale — top-decile yield for the area; either an underpriced asset or a hidden risk that comps aren't pricing in. Stress-test before assuming the spread holds.
Location & tenants
- Location reads 84/100 on livability (#95 in PA, #694 nationally) — a professional / high-income tenant draw. Strengths: commute A+, cost of living A+, housing A+; Watch: crime C-, amenities D+.
- Woodland Hills SD (suburban): math 13% / reading 30% proficiency, ranked #486 of 539 in PA (top 90%) — low school quality limits family demand, transient renter base, plan for 1-2y turnover; 69% free/reduced lunch — lower-income household profile, screen leases tightly.
- Zoned schools: Edgewood El Steam Academy (math 12% / reading 32%, grade F, #1,221 of 1,518 statewide, top 81%, 531 students, 100% FRL); Dickson Prep Steam Academy (math 8% / reading 27%, grade F, #455 of 512 statewide, top 89%, 642 students, 100% FRL); Woodland Hills Hs (math 37% / reading 30%, grade F, #323 of 437 statewide, top 74%, 949 students, 89% FRL) — zoned schools average 96% FRL vs 69% district-wide (27 pts higher); higher-poverty schools than district average — tighter screening recommended.
- Market conditions: Rents rising fast (+6.0%/yr); 78 active listings in the ZIP; 22 comparable units currently listed for rent nearby; rentals leasing fast (median 13d on market — plan ~1-2 weeks tenant-placement turnaround); 2,996 units permitted in Allegheny County in 2024 (1,588 in 5+ unit buildings).
Forward outlook
- Local home prices are declining (-3.0%/yr); year-one equity from $277 of loan paydown is wiped out by about $1k of value loss. Plan a longer hold.
- At projected returns (-3.0% appreciation + 6.0% rent growth), your $11k cash investment doubles in ~2 years — after that, you're playing with house money.
Negotiation context
- It's been on market 31 days — a 3% lower offer ($39k) is reasonable based on typical stale-listing flexibility.
- Current owner paid $16k; list at $40k implies a 150% gain — meaningful room to come down on a strong offer.
Risks & watch-outs
- Watch-outs: property tax is 2.8% of price; built in 1915 — expect roof / HVAC / electrical / plumbing capex.
Questions for the listing agent
- It's been on market 31 days. Have you received any prior offers? Is the seller open to a 3% concession, seller financing, or rate buy-down credit?
- Built in 1915 — when were the roof, HVAC, electrical panel, plumbing, and water heater last replaced?
- Property tax is high relative to price — has the assessment been appealed recently, and will the sale trigger a re-assessment?
- Is there a deadline driving the sale (1031 exchange, divorce, estate, relocation)? That informs how much negotiation room exists.
- Schools are B-rated — typically a magnet for longer-tenancy family renters. What's the average tenant stay here, and is there a school-zone premium baked into asking?
- What's the average days-on-market for RENTAL listings here right now (not sales)? A rising rental-DOM trend means longer vacancies and softer asking-rent achievability than the comps imply.
- What's the recent tenant-quality profile in this submarket — average credit score on applications, eviction rate, late-payment / NSF rate, and stable-employment percentage? A property-management company in the area should have these aggregated.
- How much new for-sale + rental construction is in the pipeline within 1–3 miles? Heavy new supply typically softens prices + rents 12–24 months out; constrained supply supports both.
Investment metrics
- 1% rule
- 3.92% ✓
- Cap rate
- 33.90%
- Cash-on-cash
- 98.61%
- DSCR
- 5.39
- GRM
- 2.1
CMA / ARV
- ARV (on-the-fly)
- $170,280
- Comps found
- 12
Show comp detail 12 sales within ~0.75 mi
| Address | Dist | Beds/Ba | Sqft | Sold | Price | $/sf | Match |
|---|---|---|---|---|---|---|---|
| 122 N Holland Ave | 0.56mi | 3/1.0 | 1,620 (+5%) | 0mo | $52,000 | $32 | 66 |
| 211 Division St | 0.55mi | 3/1.0 | 1,596 (+3%) | 4mo | $13,500 | $8 | 66 |
| 7342 Denniston | 0.54mi | 4/1.5 (+1) | 1,497 (-3%) | 1mo | $225,000 | $150 | 62 |
| 975 Illinois Ave | 0.59mi | 3/2.5 | 1,500 (-3%) | 2mo | $250,000 | $167 | 60 |
| 2020 Wayne St | 0.63mi | 3/1.0 | 1,440 (-7%) | 0mo | $65,000 | $45 | 59 |
| 2252 Milligan Ave | 0.40mi | 3/2.5 | 1,380 (-11%) | 2mo | $193,000 | $140 | 56 |
| 813 3rd St | 0.71mi | 4/1.0 (+1) | 1,472 (-5%) | 1mo | $14,999 | $10 | 53 |
| 15 Holland Ave | 0.65mi | 3/1.5 | 1,408 (-9%) | 1mo | $32,000 | $23 | 52 |
| 2115 Delaware Ave | 0.59mi | 3/1.0 | 1,344 (-13%) | 2mo | $148,000 | $110 | 48 |
| 2110 Lloyd Ave | 0.74mi | 3/1.0 | 1,720 (+11%) | 2mo | $377,450 | $219 | 46 |
| 2206 Milligan Ave | 0.46mi | 4/2.5 (+1) | 1,355 (-12%) | 2mo | $175,000 | $129 | 45 |
| 226 Lobinger Ave | 0.66mi | 4/2.0 (+1) | 1,696 (+10%) | 3mo | $75,525 | $45 | 42 |
Match score weights: distance 35% · size 25% · config 20% · recency 20%. Top-matched comps best support the ARV.
Projected returns pro-forma
-3.0% appreciation · 6.02% rent growth · sell at horizon
- IRR
- —
- Equity multiple
- 6.10×
- Total profit
- $57,097
- Equity at exit
- $5,964
- IRR
- —
- Equity multiple
- 14.11×
- Total profit
- $146,838
- Equity at exit
- $3,458
Cash invested: $11,200 (down + closing). Projections, not guarantees.
Landlord ↔ Tenant lean methodology
- Overall (STATE)
- 62 Landlord-Friendly
- State Pennsylvania
- 62 Landlord-Friendly · EVEN
- County
- — inherits STATE
- City
- — inherits STATE
ZIP-level market 15218
- Rents YoY
- 6.0%
- Active inventory
- 78
- Price-to-rent
- 2.1×
Monthly cashflow live
- Estimated rent
- $1,568 high interval (Pro) →
- Mortgage (P&I)
- −$210
- Tax from tax record
- −$92 /mo · $1,106/yr
- Insurance
- −$17
- HOA
- −$0
- Vacancy / Maint / Mgmt
- −$329
- Net cashflow
- $920
Break-even live
Sensitivity live
| Price | -10% $943 | -5% $932 | +0% $920 | +5% $909 | +10% $898 |
|---|---|---|---|---|---|
| Rent | -10% $796 | -5% $858 | +0% $920 | +5% $982 | +10% $1,044 |
| Rate | -1.0pp $941 | -0.5pp $931 | base $920 | +0.5pp $910 | +1.0pp $899 |
UW: 25.0% down · 7.5% · 30yr · 1.5% tax · 5.0% vac · 8.0% maint · 8.0% mgmt
Financing live
Cash to close
- Down payment
- $10,000
- Closing costs
- $1,200
- Reserves months
- —
- Total cash needed
- —
Loan-product check · same deal, 3 products live
Conventional
25% down · 7.5% · 30yr
- Down + closing
- —
- Monthly P&I
- —
- Monthly cashflow
- —
- DSCR
- —
- Eligible?
- —
Personal DTI + credit; lowest rate.
DSCR
20% down · 8.5% · 30yr
- Down + closing
- —
- Monthly P&I
- —
- Monthly cashflow
- —
- DSCR
- —
- Eligible?
- —
No personal income docs; deal must DSCR.
Hard money
10% down · 12.0% · 12mo
- Down + closing
- —
- Monthly P&I
- —
- Monthly cashflow
- —
- DSCR
- —
- Eligible?
- —
Short-term bridge; refi at stabilization.
Rent comps 22 comps
| Address | Beds | Baths | Sqft | Rent | $/sqft | DOM | Units | Dist |
|---|---|---|---|---|---|---|---|---|
| 7542 Ormond St Apt 2 Swissvale, PA | 2.0 | 1.0 | 1200 | $1,099 | $0.92 | 0d | 1 | 0.20mi |
| 7645 Highland Ave Pittsburgh, PA | 3.0 | 1.0 | 1161 | $1,325 | $1.14 | 9d | 1 | 0.25mi |
| 7656 Highland Ave Pittsburgh, PA | 4.0 | 1.0 | 1180 | $1,800 | $1.53 | 0d | 1 | 0.28mi |
| 2219 Manor Ave Pittsburgh, PA | 3.0 | 1.0 | 1638 | $1,600 | $0.98 | 26d | 1 | 0.38mi |
| 212 Kenmawr Ave Braddock, PA | 2.0 | 1.5 | 1417 | $1,300 | $0.92 | 46d | 1 | 0.42mi |
| 2323 Patterson Ave Pittsburgh, PA | 3.0 | 1.0 | 1440 | $1,800 | $1.25 | 46d | 1 | 0.43mi |
| 2323 Patterson Ave Unit NA Pittsburgh, PA | 3.0 | 1.0 | 1440 | $1,800 | $1.25 | 0d | 1 | 0.43mi |
| 2210 Hampton St Pittsburgh, PA | 3.0 | 1.5 | 1512 | $1,650 | $1.09 | 26d | 1 | 0.59mi |
| 7009 Church St Pittsburgh, PA | 3.0 | 2.0 | 1800 | $1,550 | $0.86 | 0d | 1 | 0.89mi |
| 7009 Church St Pittsburgh, PA | 3.0 | 2.0 | 1800 | $1,550 | $0.86 | 46d | 1 | 0.89mi |
| 931 Hilltop St Homestead, PA | 3.0 | 1.5 | 1312 | $1,500 | $1.14 | 16d | 1 | 0.93mi |
| 1723 Nevada St Swissvale, PA | 2.0 | 1.0 | 1100 | $1,100 | $1.00 | 0d | 1 | 0.94mi |
| 7225 Whipple St Unit 72255 Pittsburgh, PA | 3.0 | 1.5 | 1440 | $1,695 | $1.18 | 5d | 1 | 1.05mi |
| 537 6th St Braddock, PA | 3.0 | 1.0 | 1360 | $1,400 | $1.03 | 46d | 1 | 1.07mi |
| 442 Locust St Pittsburgh, PA | 2.0 | 1.0 | 1600 | $2,600 | $1.62 | 5d | 1 | 1.08mi |
| 621 E 9th Ave Homestead, PA | 2.0 | 2.0 | 1400 | $1,425 | $1.02 | 26d | 1 | 1.27mi |
| 611 E Waterfront Dr Homestead, PA | 1.0–2.0 | 1.0–2.5 | 1149 | $2,605 | $2.27 | 0d | 9 | 1.34mi |
| 826 Walnut St Pittsburgh, PA | 2.0 | 1.0 | 1270 | $1,195 | $0.94 | 46d | 1 | 1.40mi |
| 623 E 18th Ave Homestead, PA | 2.0 | 1.0 | 1156 | $1,600 | $1.38 | 46d | 1 | 1.41mi |
| 565 Ardmore Blvd Pittsburgh, PA | 4.0 | 1.0 | 1368 | $1,450 | $1.06 | 12d | 1 | 1.44mi |
| 1027 Lancaster Ave Unit 2 Pittsburgh, PA | 2.0 | 2.0 | 1300 | $2,599 | $2.00 | 0d | 1 | 1.46mi |
| 1001-1003 S Trenton Ave Pittsburgh, PA | 3.0 | 1.5 | 1400 | $2,000 | $1.43 | 0d | 1 | 1.48mi |
Listing history 18 events
-
2026-06-22days on market $40,000 Active 31 DOM
-
2026-06-21days on market $40,000 Active 30 DOM
-
2026-06-18days on market $40,000 Active 27 DOM
-
2026-06-17days on market $40,000 Active 26 DOM
-
2026-06-16days on market $40,000 Active 25 DOM
-
2026-06-15days on market $40,000 Active 24 DOM
-
2026-06-13days on market $40,000 Active 22 DOM
-
2026-06-09days on market $40,000 Active 18 DOM
-
2026-06-08days on market $40,000 Active 17 DOM
-
2026-06-07days on market $40,000 Active 16 DOM
-
2026-06-05days on market $40,000 Active 13 DOM
-
2026-06-03days on market $40,000 Active 12 DOM
-
2026-06-02days on market $40,000 Active 11 DOM
-
2026-06-01days on market $40,000 Active 10 DOM
-
2026-05-31days on market $40,000 Active 9 DOM
-
2026-05-22$40,000 Active
-
2018-09-14soldstatus $16,000
-
2009-05-18soldstatus $16,100
ⓘ Source: listings_history table (triggers on properties + properties_extension) + one-shot
backfill from property_details.listing_events for pre-trigger history.
Tax reassessment forecast PA · Partial reset (capped growth)
- Current annual tax
- $1,106 · $92/mo
- Projected year-2 tax
- $1,106 · $92/mo
- Expected delta
- $0/yr ($0/mo · 0.0%)
ⓘ Screening estimate from a state-policy table — verify with the county assessor before closing.
Climate risk First Street
- Flood 1/10 Low FEMA zone X (unshaded) · 0% chance over 30 yrs
- Wildfire 1/10 Low
- Heat 4/10 Moderate 7 d/yr ≥98°F today · 18 d/yr by 30 yrs out
- Wind 2/10 Low 0% chance of damaging wind over 30 yrs
- Air quality 4/10 Moderate 4 unhealthy d/yr today · 5 by 30 yrs out
Nearby sold comps map
Loading sold comps map…
Walkable amenities ~0.75 mi
Loading nearby amenities…
Taxation est. · year 1
- Rental income
- $18,820
- − Mortgage interest
- −$2,241
- − Property taxes
- −$1,106
- − Insurance
- −$200
- − Repairs & maintenance
- −$1,506
- − Management
- −$1,506
- − Depreciation
- −$1,164
- Taxable income
- $11,098
- Est. tax owed @ 24.0%
- −$2,664
- After-tax cash flow
- $8,381/yr
For passive investors: Depreciation is non-cash, so a rental often shows a tax loss while cash-flowing — sheltering income. Rental losses are passive: they offset passive income freely, and up to $25,000/yr can offset ordinary (W-2) income if you actively participate and your MAGI is under $100k (phasing out to $0 by $150k); unused losses carry forward. On sale, claimed depreciation is recaptured at up to 25%, and gains may owe capital-gains tax (a 1031 exchange can defer both). Figures are a year-1 estimate at your 24.0% rate — not tax advice; consult a CPA.
Schools (NCES district)
- District
- Woodland Hills SD
- NCES district ID
- 4216500
- Math proficiency
- 13% ▼ -13.00%
- Reading proficiency
- 30% ▼ -10.00%
- Median HH income
- $41,803
- Composite
- 18.31/100
- National rank
- #8954
- State rank
- #486 of 539 in PA
Livability — Swissvale
- Score
- 84/100
- State rank
- #95
- US rank
- #694
Category grades
Schools grade is shown separately in the Schools card above.
Census & demographics
- Census place
- Swissvale, PA
- County
- Allegheny County · 1,022,028 people
- City population
- 13,443
- Metro
- Pittsburgh, PA
- Population (ZIP)
- 13,379
- Household income
- $67,960
- Rent vs Own
- Severe rent burden
- 605.0
Population outlook (Allegheny County) Hauer SSP2
- Today (2025)
- 1,250,282 people
- By 2030
- 1,256,482 · +0.5%
- By 2040
- 1,256,318 · +0.5%
- By 2050
- 1,244,169 · -0.5%
- By 2075
- 1,197,693 · -4.2%
- By 2100
- 1,093,187 · -12.6%
Race, ethnicity, and origin ACS 2023
- Neighborhood character
- Predominantly White (69%)
- Race & ethnicity
- White 69% Black 19% Two or more races 7% Hispanic / Latino 4% Asian 3%
- Common ancestry
- Romanian 6% Serbian 2% Lithuanian 2%
- Foreign-born
- 6% · Canada, China
- Languages at home
- 94% English-only · Spanish 2% Other Indo-European 1% Chinese 1%
Political lean MEDSL · Allegheny
- 2024 margin
- Strong D (+20.3) · D 59.7% · R 39.4%
- 2008→2024 swing
- +4.8pp toward D · 2008: 15.5pp · 2024: 20.3pp
- All cycles
- 2024: D+20.3 2020: D+20.4 2016: D+16.4 2012: D+14.4 2008: D+15.5
Not yet ingested
- Civics
- —
Market trends
- HPI YoY
- ▼ -188.20%
- Current HPI
- 297.8483
- Rent YoY
- ▲ 6.02%
- Metro
- Pittsburgh, PA
- State GDP YoY
- ▲ 1.68%
- F500 in state
- 34
Industry mix (Fortune 500 HQ in PA)
| Industry | F500 HQs | Revenue |
|---|---|---|
| Healthcare | 2 | $309B |
|
||
| Insurance | 2 | $27B |
|
||
| Telecommunications / Media | 1 | $124B |
|
||
| Industrial Distribution | 1 | $22B |
|
||
| Financial Services | 1 | $20B |
|
||
| Chemicals / Materials | 1 | $18B |
|
||
Price history
+148.4% since first listed3 events — show timeline
- 2026-05-22 Listed $40,000 West Penn MLS
- 2018-09-14 Sold (Public Records) $16,000 Public Records
- 2009-05-18 Sold (Public Records) $16,100 Public Records
Property tax history
+10.0%/yrLatest (2026): $1,106 · +277.0% YoY. Source: county tax records.
Cash-flow waterfall
monthlySold comps — $/sqft
last 12 mo · ≤1 miLoading sold comps…