 Duplex
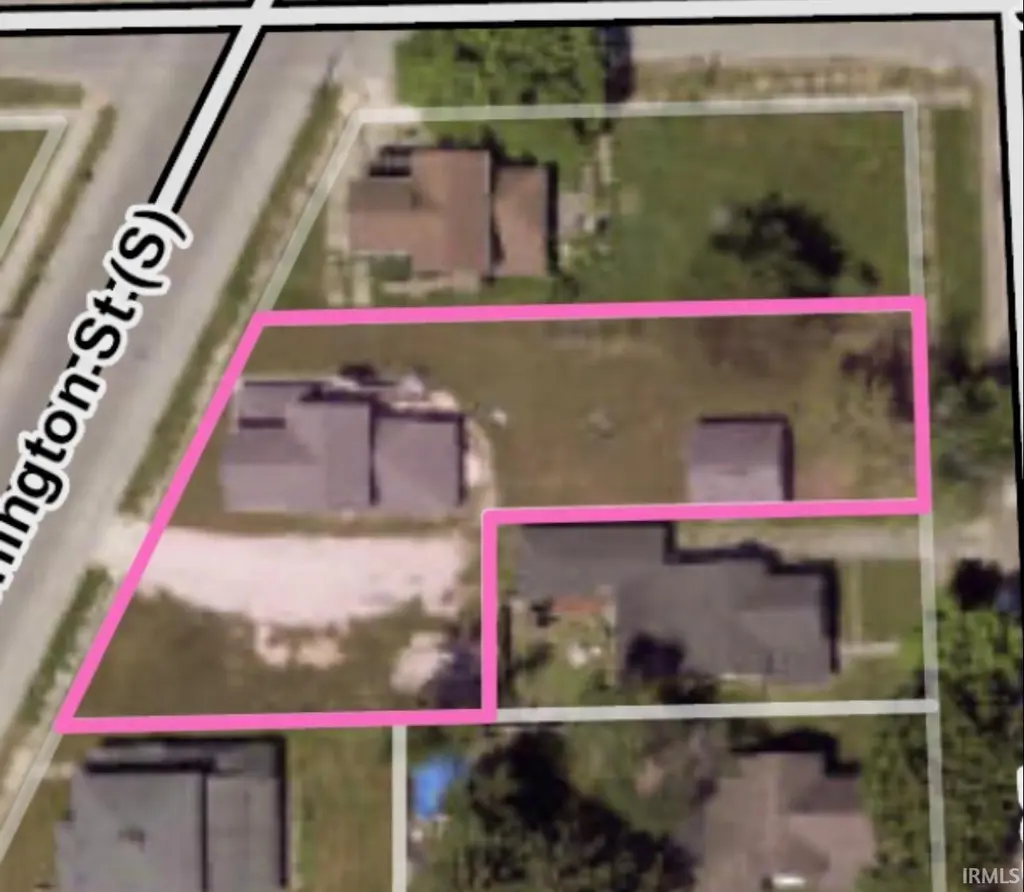
3405 S Washington St · Marion, IN
Flood risk 1/10 · Minimal
- FEMA flood zone
- X (unshaded)
- Chance of flooding over 30 yrs
- 0.0%
- Est. flood insurance / yr
- $473 – $860
Fire risk 1/10 · Minimal
- Est. fire insurance / yr
- $717 – $1,331
Heat risk 3/10 · Minor
- Hot days now (above 100°F)
- 7 days/yr
- Hot days in 30 yrs
- 18 days/yr
Wind risk 2/10 · Minimal
- Chance of severe wind over 30 yrs
- —
Air-quality risk 2/10 · Minimal
- Unhealthy air days now
- 1 days/yr
- Unhealthy air days in 30 yrs
- 2 days/yr
Risk factors via First Street. Map © Google.
Why this score? — see what drove the C+ grade
The composite is a weighted blend of 9 inputs, each scored 0–100. Each bar is that input's sub-score; the figure is the points it added to the 100-point composite (weight × sub-score).
- Cash flow +30.0/30.0
- 1% rule +10.0/10.0
- DSCR +10.0/10.0
- Livability +3.2/5.0
- Rent growth +2.5/5.0
- Condition / age +2.5/5.0
- Schools +1.7/10.0
- ARV discount +0.9/15.0
- Appreciation +0.0/10.0
$90,000
🖨 Deal sheet (PDF) 📄 Offer letter ✓ Due diligence
Multi-family units
County records classify this as Multi-Family (2-4 Unit). Listing-text estimate: 2 units. confirmed
Listing remarks MLS
Great investment opportunity and within walking distance to IWU! Whether you're looking to rent out both units or live in one and make extra money by renting out the other this property is for you! Recently remodeled and fully furnished kitchens and baths in both units, detached garage for storage and new 100 amp electrical in each unit. Roof, windows, heat and siding are all 5 years old. The property offers 2 lots so you will have ample, off street parking and plenty of yard space. Don't miss out on this low maintenance and affordable opportunity.
Key facts
- Large lot
- 8,712 sq ft lot
- Built 1900
Tags
Property features AI
Exterior
- Utilities: Public water; Public sewer
- Home design: Duplex (residential income); 2 stories
- Construction: Vinyl siding
- Exterior features: Irregular lot; Lot dimensions approximately 189 x 50; Lot size about 0.2 acre; Pets allowed
Interior
- Kitchen: Range; Refrigerator
- Flooring: Carpet
- Bathrooms: 2 full bathrooms; 5 main-level bathrooms
- Heating & cooling: Forced air heating; Natural gas heating
- Interior features: Range; Refrigerator
- Laundry & utility: Washer hookup; Partial unfinished basement
Neighborhood map
What this means for you Summary
Snapshot
- This is a 2 × 2-bed/1.0-bath units multifamily listed at $90k.
Deal economics
- At list price, monthly cash flow is $728 ($9k/yr) — positive. Per door: $364/mo.
- The deal already cash-flows at list — no discount required.
- Meets the 1% rule at list price ($2k rent vs $90k).
- Recommended offer: $87k (3.0% below list) — sets the bar for market timing.
- Cap rate 16.0% vs local median 8.1% in Marion — top-decile yield for the area; either an underpriced asset or a hidden risk that comps aren't pricing in. Stress-test before assuming the spread holds.
Location & tenants
- Location reads 65/100 on livability (#337 in IN) — a middle-class / working-renter tenant base. Strengths: crime A+, cost of living A+, housing A+; Watch: amenities F, commute F, employment F.
- Marion Community Schools (town): math 18% / reading 24% proficiency, ranked #277 of 301 in IN (top 92%) — low school quality limits family demand, transient renter base, plan for 1-2y turnover; 67% free/reduced lunch — lower-income household profile, screen leases tightly.
- Zoned schools: John W Kendall Elem School (math 37% / reading 32%, grade F, #597 of 994 statewide, top 63%, 372 students, 69% FRL); John L Mcculloch Junior High Sch (math 11% / reading 22%, grade F, #287 of 330 statewide, top 88%, 524 students, 74% FRL); Marion High School (math 12% / reading 47%, grade F, #308 of 369 statewide, top 84%, 1,050 students, 66% FRL) — zoned schools at 70% FRL track the district average.
- Market conditions: 114 active listings in the ZIP; 52 units permitted in Grant County in 2024 (8 in 5+ unit buildings).
- At $1,771/mo this rent would consume 46% of the median local household income ($46k/yr) (locally 597% of renters already pay >50% of income on rent) — very limited rent-growth headroom before tenants either downsize or default.
Forward outlook
- Local home prices are declining (-3.0%/yr); year-one equity from $622 of loan paydown is wiped out by about $3k of value loss. Plan a longer hold.
- Grant County population projected at -18% by 2050 — secular population decline; favor cash flow + early exit over multi-decade hold.
- At projected returns (-3.0% appreciation + 3.0% rent growth), your $25k cash investment doubles in ~4 years — after that, you're playing with house money.
Negotiation context
- It's been on market 49 days — a 3% lower offer ($87k) is reasonable based on typical stale-listing flexibility.
- 2 sale attempts since 8y ago with the ask held roughly flat each time — persistent listings suggest the price (not the market) is what's stuck; bring a comps-based counter.
- Current owner paid $55k; list at $90k implies a 64% gain — meaningful room to come down on a strong offer.
Risks & watch-outs
- Watch-outs: built in 1900 — expect roof / HVAC / electrical / plumbing capex.
Questions for the listing agent
- It's been on market 49 days. Have you received any prior offers? Is the seller open to a 3% concession, seller financing, or rate buy-down credit?
- Can we see the unit-by-unit rent roll, current vacancy, and any below-market leases? What's the average tenancy length?
- What capital expenditures (roof, boiler, parking lot, exteriors) have been made in the last 5 years, and what's planned in the next 2?
- Built in 1900 — when were the roof, HVAC, electrical panel, plumbing, and water heater last replaced?
- Is there a deadline driving the sale (1031 exchange, divorce, estate, relocation)? That informs how much negotiation room exists.
- Schools are F-rated, which usually means shorter tenancies and higher turnover. Who's the typical renter profile here, and what's been the actual vacancy rate?
- What's the average days-on-market for RENTAL listings here right now (not sales)? A rising rental-DOM trend means longer vacancies and softer asking-rent achievability than the comps imply.
- What's the recent tenant-quality profile in this submarket — average credit score on applications, eviction rate, late-payment / NSF rate, and stable-employment percentage? A property-management company in the area should have these aggregated.
- How much new apartment / multifamily construction is in the pipeline within 1–3 miles? Heavy new supply (>2% of stock underway) typically softens rents 12–24 months out; light construction supports rent growth.
Investment metrics
- 1% rule
- 1.97% ✓
- Cap rate
- 16.00%
- Cash-on-cash
- 34.66%
- DSCR
- 2.54
- GRM
- 4.2
CMA / ARV
- ARV (median comp)
- $78,424
- List price
- $90,000
- Delta
- 14.76%
- Verdict
- OVERPRICED
- Comps
- 9 within 1.0 mi
Show comp detail 2 sales within ~0.75 mi
| Address | Dist | Beds/Ba | Sqft | Sold | Price | $/sf | Match |
|---|---|---|---|---|---|---|---|
| 3633 S Gallatin St | 0.23mi | 3/2.0 (-1) | 1,616 (-12%) | 15mo | $64,000 | $40 | 52 |
| 3807 S Landess St | 0.57mi | 4/2.0 | 1,632 (-11%) | 12mo | $131,000 | $80 | 44 |
Match score weights: distance 35% · size 25% · config 20% · recency 20%. Top-matched comps best support the ARV.
Projected returns pro-forma
-3.0% appreciation · 3.0% rent growth · sell at horizon
- IRR
- 30.2%
- Equity multiple
- 2.26×
- Total profit
- $31,826
- Equity at exit
- $13,419
- IRR
- 37.4%
- Equity multiple
- 4.48×
- Total profit
- $87,633
- Equity at exit
- $7,782
Cash invested: $25,200 (down + closing). Projections, not guarantees.
Landlord ↔ Tenant lean methodology
- Overall (STATE)
- 90 Strongly Landlord-Friendly
- State Indiana
- 90 Strongly Landlord-Friendly · R+11
- County
- — inherits STATE
- City
- — inherits STATE
ZIP-level market 46953
- Home prices YoY
- -23.4%
- Active inventory
- 114
- Price-to-rent
- 8.5×
Monthly cashflow live
- Estimated rent
- $1,771 medium interval (Pro) →
- Mortgage (P&I)
- −$472
- Tax from tax record
- −$162 /mo · $1,942/yr
- Insurance
- −$38
- HOA
- −$0
- Vacancy / Maint / Mgmt
- −$372
- Net cashflow
- $728
Break-even live
Sensitivity live
| Price | -10% $779 | -5% $753 | +0% $728 | +5% $702 | +10% $677 |
|---|---|---|---|---|---|
| Rent | -10% $588 | -5% $658 | +0% $728 | +5% $798 | +10% $868 |
| Rate | -1.0pp $773 | -0.5pp $751 | base $728 | +0.5pp $704 | +1.0pp $681 |
2-unit breakdown (identical units grouped — click to expand)
| Units | Beds | Baths | Est. rent |
|---|---|---|---|
| 2× units | 2 | 1 | $1,772 |
| #1 | 2 | 1 | $886 |
| #2 | 2 | 1 | $886 |
| Total (2 units) | $1,771 | ||
UW: 25.0% down · 7.5% · 30yr · 1.5% tax · 5.0% vac · 8.0% maint · 8.0% mgmt
Financing live
Cash to close
- Down payment
- $22,500
- Closing costs
- $2,700
- Reserves months
- —
- Total cash needed
- —
Loan-product check · same deal, 3 products live
Conventional
25% down · 7.5% · 30yr
- Down + closing
- —
- Monthly P&I
- —
- Monthly cashflow
- —
- DSCR
- —
- Eligible?
- —
Personal DTI + credit; lowest rate.
DSCR
20% down · 8.5% · 30yr
- Down + closing
- —
- Monthly P&I
- —
- Monthly cashflow
- —
- DSCR
- —
- Eligible?
- —
No personal income docs; deal must DSCR.
Hard money
10% down · 12.0% · 12mo
- Down + closing
- —
- Monthly P&I
- —
- Monthly cashflow
- —
- DSCR
- —
- Eligible?
- —
Short-term bridge; refi at stabilization.
Listing history 19 events
-
2026-06-22days on market $90,000 Active 49 DOM
-
2026-06-21days on market $90,000 Active 48 DOM
-
2026-06-19days on market $90,000 Active 46 DOM
-
2026-06-18days on market $90,000 Active 45 DOM
-
2026-06-17days on market $90,000 Active 44 DOM
-
2026-06-16days on market $90,000 Active 43 DOM
-
2026-06-15days on market $90,000 Active 42 DOM
-
2026-06-14days on market $90,000 Active 40 DOM
-
2026-06-12days on market $90,000 Active 39 DOM
-
2026-06-09days on market $90,000 Active 36 DOM
-
2026-06-08days on market $90,000 Active 35 DOM
-
2026-06-07days on market $90,000 Active 34 DOM
-
2026-06-02days on market $90,000 Active 29 DOM
-
2026-06-01days on market $90,000 Active 28 DOM
-
2026-05-31days on market $90,000 Active 27 DOM
-
2026-05-30days on market $90,000 Active 26 DOM
-
2026-05-04$90,000 Active 338-char remark
-
2019-02-19soldstatus $55,000 555-char remark
Show marketing remark (555 chars)
Great investment opportunity and within walking distance to IWU! Whether you're looking to rent out both units or live in one and make extra money by renting out the other this property is for you! Recently remodeled and fully furnished kitchens and baths in both units, detached garage for storage and new 100 amp electrical in each unit. Roof, windows, heat and siding are all 5 years old. The property offers 2 lots so you will have ample, off street parking and plenty of yard space. Don't miss out on this low maintenance and affordable opportunity.
-
2018-08-27$59,000 555-char remark
Show marketing remark (555 chars)
Great investment opportunity and within walking distance to IWU! Whether you're looking to rent out both units or live in one and make extra money by renting out the other this property is for you! Recently remodeled and fully furnished kitchens and baths in both units, detached garage for storage and new 100 amp electrical in each unit. Roof, windows, heat and siding are all 5 years old. The property offers 2 lots so you will have ample, off street parking and plenty of yard space. Don't miss out on this low maintenance and affordable opportunity.
ⓘ Source: listings_history table (triggers on properties + properties_extension) + one-shot
backfill from property_details.listing_events for pre-trigger history.
Tax reassessment forecast IN · Partial reset (capped growth)
- Current annual tax
- $1,942 · $162/mo
- Projected year-2 tax
- $1,942 · $162/mo
- Expected delta
- $0/yr ($0/mo · 0.0%)
ⓘ Screening estimate from a state-policy table — verify with the county assessor before closing.
Climate risk First Street
- Flood 1/10 Low FEMA zone X (unshaded) · 0% chance over 30 yrs
- Wildfire 1/10 Low
- Heat 3/10 Moderate 7 d/yr ≥100°F today · 18 d/yr by 30 yrs out
- Wind 2/10 Low
- Air quality 2/10 Low 1 unhealthy d/yr today · 2 by 30 yrs out
Nearby sold comps map
Loading sold comps map…
Walkable amenities ~0.75 mi
Loading nearby amenities…
Taxation est. · year 1
- Rental income
- $21,252
- − Mortgage interest
- −$5,041
- − Property taxes
- −$1,942
- − Insurance
- −$450
- − Repairs & maintenance
- −$1,700
- − Management
- −$1,700
- − Depreciation
- −$2,618
- Taxable income
- $7,800
- Est. tax owed @ 24.0%
- −$1,872
- After-tax cash flow
- $6,861/yr
For passive investors: Depreciation is non-cash, so a rental often shows a tax loss while cash-flowing — sheltering income. Rental losses are passive: they offset passive income freely, and up to $25,000/yr can offset ordinary (W-2) income if you actively participate and your MAGI is under $100k (phasing out to $0 by $150k); unused losses carry forward. On sale, claimed depreciation is recaptured at up to 25%, and gains may owe capital-gains tax (a 1031 exchange can defer both). Figures are a year-1 estimate at your 24.0% rate — not tax advice; consult a CPA.
Schools (NCES district)
- District
- Marion Community Schools
- NCES district ID
- 1806390
- Math proficiency
- 18% ▼ -9.00%
- Reading proficiency
- 24% ▼ -6.00%
- Median HH income
- $33,415
- Composite
- 17.13/100
- National rank
- #9115
- State rank
- #277 of 301 in IN
Livability — Marion
- Score
- 65/100
- State rank
- #337
- US rank
- #13006
Category grades
Schools grade is shown separately in the Schools card above.
Census & demographics
- Census place
- Marion, IN
- County
- Grant County · 41,561 people
- City population
- 41,561
- Metro
- Marion, IN
- Population (ZIP)
- 23,372
- Household income
- $46,288
- Rent vs Own
- Severe rent burden
- 597.0
Population outlook (Grant County) Hauer SSP2
- Today (2025)
- 64,394 people
- By 2030
- 62,145 · -3.5%
- By 2040
- 57,252 · -11.1%
- By 2050
- 52,968 · -17.7%
- By 2075
- 45,986 · -28.6%
- By 2100
- 39,400 · -38.8%
Race, ethnicity, and origin ACS 2023
- Neighborhood character
- Predominantly White (77%)
- Race & ethnicity
- White 77% Black 10% Two or more races 9% Hispanic / Latino 6%
- Hispanic origin (detail)
- Mexican 4%
- Common ancestry
- Italian 3% Iranian 1% Slovak 1%
- Foreign-born
- 2% · Canada
- Languages at home
- 96% English-only · Spanish 3%
Political lean MEDSL · Grant
- 2024 margin
- Solid R (+41.8) · D 28.2% · R 70.0% · Other 1.9%
- 2008→2024 swing
- -28.7pp toward R · 2008: -13.1pp · 2024: -41.8pp
- All cycles
- 2024: R+41.8 2020: R+38.8 2016: R+39.5 2012: R+22.0 2008: R+13.1
Not yet ingested
- Civics
- —
Market trends
- HPI YoY
- ▼ -52.47%
- Current HPI
- 171.7246
- Rent YoY
- —
- Metro
- Marion, IN
- State GDP YoY
- ▲ 2.90%
- F500 in state
- 18
Industry mix (Fortune 500 HQ in IN)
| Industry | F500 HQs | Revenue |
|---|---|---|
| Industrial Machinery | 2 | $37B |
|
||
| Healthcare | 1 | $177B |
|
||
| Pharmaceuticals | 1 | $45B |
|
||
| Metals / Steel | 1 | $18B |
|
||
| Agriculture | 1 | $17B |
|
||
| Packaging | 1 | $12B |
|
||
Price history
+52.5% since first listed3 events — show timeline
- 2026-05-04 Listed $90,000 IRMLS
- 2019-02-19 Sold (MLS) $55,000 IRMLS
- 2018-08-27 Listed $59,000 IRMLS
Property tax history
+1.6%/yrLatest (2025): $1,942 · +9.7% YoY. Source: county tax records.
Cash-flow waterfall
monthlySold comps — $/sqft
last 12 mo · ≤1 miLoading sold comps…