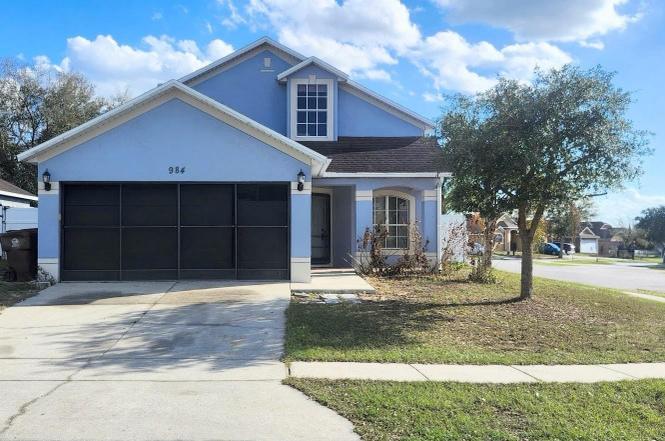
984 Kenbar Ave · Haines City, FL
Flood risk 1/10 · Minimal
- FEMA flood zone
- X (unshaded)
- Chance of flooding over 30 yrs
- 0.0%
- Est. flood insurance / yr
- $507 – $1,088
Fire risk 7/10 · Major
- Est. fire insurance / yr
- $947 – $1,759
Heat risk 9/10 · Severe
- Hot days now (above 107°F)
- 7 days/yr
- Hot days in 30 yrs
- 25 days/yr
Wind risk 9/10 · Severe
- Chance of severe wind over 30 yrs
- 99.0%
Air-quality risk 1/10 · Minimal
- Unhealthy air days now
- 0 days/yr
- Unhealthy air days in 30 yrs
- 0 days/yr
Risk factors via First Street. Map © Google.
Why this score? — see what drove the B- grade
The composite is a weighted blend of 9 inputs, each scored 0–100. Each bar is that input's sub-score; the figure is the points it added to the 100-point composite (weight × sub-score).
- Cash flow +28.7/30.0
- DSCR +10.0/10.0
- ARV discount +7.5/15.0
- 1% rule +7.1/10.0
- Livability +3.7/5.0
- Schools +3.5/10.0
- Rent growth +2.8/5.0
- Condition / age +2.5/5.0
- Appreciation +0.0/10.0
$190,000
🖨 Deal sheet (PDF) 📄 Offer letter ✓ Due diligence
Listing remarks MLS
LISTING PRICE MAY NOT BE SUFFICIENT TO PAY THE TOTAL OF ALL LIENS AND COSTS OF SALE , AND SALE PROPERTY AT FULL LISTING PRICE MAY REQUIRE APPROVAL OF SELLER'S LENDER(S0, AND SUCH APPROVAL MAY BE CONDITIONED UPON THE GROSS COMMISSION BEING REDUCED.
Key facts
- Fenced yard
- Large closet
- Functional layout
Tags
Neighborhood map
What this means for you Summary
Snapshot
- This is a 4-bed/2.0-bath single-family listed at $190k.
Deal economics
- At list price, monthly cash flow is $634 ($8k/yr) — positive.
- The deal already cash-flows at list — no discount required.
- Meets the 1% rule at list price ($2k rent vs $190k).
- Recommended offer: $187k (1.5% below list) — sets the bar for market timing.
Location & tenants
- Location reads 74/100 on livability (#285 in FL, #4,575 nationally) — a middle-class / working-renter tenant base. Strengths: crime A+, cost of living A+, housing A+; Watch: amenities F, commute F, employment F.
- Polk (suburban): math 39% / reading 43% proficiency, ranked #62 of 73 in FL (top 85%) — families likely to look elsewhere, expect single-tenant / working-renter base with shorter leases.
- Zoned schools: Horizons Elementary School (math 37% / reading 39%, grade F, #1,587 of 2,144 statewide, top 74%, 1,468 students, 42% FRL); Shelley S. Boone Middle School (math 25% / reading 25%, grade F, #517 of 571 statewide, top 91%, 1,403 students, 52% FRL); Ridge Community High School (math 12% / reading 33%, grade F, #539 of 667 statewide, top 81%, 2,711 students, 48% FRL).
- Zoned-school proficiency averages 28% at this address vs 41% district-wide (-12 pts) — the specific schools serving this property underperform the Polk average; the district grade overstates school quality for this exact location.
- Market conditions: Rents rising (+1.2%/yr); 1344 active listings in the ZIP; 23 comparable units currently listed for rent nearby; rentals at typical pace (median 25d on market — plan ~3-4 weeks tenant-placement turnaround); 10,384 units permitted in Polk County in 2024 (1,716 in 5+ unit buildings).
- This rent runs 43% of the median local income ($64k/yr) — at the standard rent-burdened threshold; future hikes will face affordability resistance.
Forward outlook
- Local home prices are declining (-3.0%/yr); year-one equity from $1k of loan paydown is wiped out by about $6k of value loss. Plan a longer hold.
- Polk County population projected at +33% by 2050 — long-run rental-demand tailwind backs the buy-and-hold thesis.
- At projected returns (-3.0% appreciation + 1.2% rent growth), your $53k cash investment doubles in ~10 years — after that, you're playing with house money.
Negotiation context
- It's been on market 24 days — a 2% lower offer ($187k) is reasonable based on typical stale-listing flexibility.
- 3 sale attempts since 21y ago; this cycle's ask has dropped $55k (22%) from the opening price — seller is motivated, your offer sets the floor, not the list.
- Current owner paid $70k; list at $190k implies a 171% gain — meaningful room to come down on a strong offer.
Risks & watch-outs
- Climate carrying-cost: severe wind risk, 99% chance of damaging wind over 30y; major wildfire risk; extreme-heat days projected 7→25/yr by 2055 (HVAC capex compounding) — expect insurance premiums to compound above CPI over the hold.
Questions for the listing agent
- What does the HOA fee cover, when was the last increase, and are there any pending special assessments or reserve-fund shortfalls?
- Is there a deadline driving the sale (1031 exchange, divorce, estate, relocation)? That informs how much negotiation room exists.
- Schools are D-rated, which usually means shorter tenancies and higher turnover. Who's the typical renter profile here, and what's been the actual vacancy rate?
- What's the average days-on-market for RENTAL listings here right now (not sales)? A rising rental-DOM trend means longer vacancies and softer asking-rent achievability than the comps imply.
- What's the recent tenant-quality profile in this submarket — average credit score on applications, eviction rate, late-payment / NSF rate, and stable-employment percentage? A property-management company in the area should have these aggregated.
- How much new for-sale + rental construction is in the pipeline within 1–3 miles? Heavy new supply typically softens prices + rents 12–24 months out; constrained supply supports both.
Investment metrics
- 1% rule
- 1.21% ✓
- Cap rate
- 10.30%
- Cash-on-cash
- 14.30%
- DSCR
- 1.64
- GRM
- 6.9
CMA / ARV
No comps found within radius.
Projected returns pro-forma
-3.0% appreciation · 1.16% rent growth · sell at horizon
- IRR
- 2.7%
- Equity multiple
- 1.10×
- Total profit
- $5,361
- Equity at exit
- $28,330
- IRR
- 10.5%
- Equity multiple
- 1.75×
- Total profit
- $39,962
- Equity at exit
- $16,428
Cash invested: $53,200 (down + closing). Projections, not guarantees.
Landlord ↔ Tenant lean methodology
- Overall (STATE)
- 87 Strongly Landlord-Friendly
- State Florida
- 87 Strongly Landlord-Friendly · R+3
- County
- — inherits STATE
- City
- — inherits STATE
ZIP-level market 33844
- Home prices YoY
- -26.7%
- Rents YoY
- 1.2%
- Active inventory
- 1344
- Price-to-rent
- 6.9×
Monthly cashflow live
- Estimated rent
- $2,294 high interval (Pro) →
- Mortgage (P&I)
- −$996
- Tax from tax record
- −$87 /mo · $1,039/yr
- Insurance
- −$79
- HOA
- −$16
- Vacancy / Maint / Mgmt
- −$482
- Net cashflow
- $634
Break-even live
Sensitivity live
| Price | -10% $741 | -5% $688 | +0% $634 | +5% $580 | +10% $526 |
|---|---|---|---|---|---|
| Rent | -10% $453 | -5% $543 | +0% $634 | +5% $724 | +10% $815 |
| Rate | -1.0pp $729 | -0.5pp $682 | base $634 | +0.5pp $585 | +1.0pp $534 |
UW: 25.0% down · 7.5% · 30yr · 1.5% tax · 5.0% vac · 8.0% maint · 8.0% mgmt
Financing live
Cash to close
- Down payment
- $47,500
- Closing costs
- $5,700
- Reserves months
- —
- Total cash needed
- —
Loan-product check · same deal, 3 products live
Conventional
25% down · 7.5% · 30yr
- Down + closing
- —
- Monthly P&I
- —
- Monthly cashflow
- —
- DSCR
- —
- Eligible?
- —
Personal DTI + credit; lowest rate.
DSCR
20% down · 8.5% · 30yr
- Down + closing
- —
- Monthly P&I
- —
- Monthly cashflow
- —
- DSCR
- —
- Eligible?
- —
No personal income docs; deal must DSCR.
Hard money
10% down · 12.0% · 12mo
- Down + closing
- —
- Monthly P&I
- —
- Monthly cashflow
- —
- DSCR
- —
- Eligible?
- —
Short-term bridge; refi at stabilization.
Rent comps 23 comps
| Address | Beds | Baths | Sqft | Rent | $/sqft | DOM | Units | Dist |
|---|---|---|---|---|---|---|---|---|
| 945 Kenbar Ave Haines City, FL | 4.0 | 2.5 | 1527 | $2,051 | $1.34 | 15d | 1 | 0.20mi |
| 3053 Cassidy Ln Haines City, FL | 4.0 | 3.0 | 1988 | $2,500 | $1.26 | 25d | 1 | 0.25mi |
| 3108 Cassidy Ln Haines City, FL | 4.0 | 2.0 | 1823 | $2,200 | $1.21 | 25d | 1 | 0.37mi |
| 1109 Ronlin St Haines City, FL | 4.0 | 2.0 | 1874 | $1,981 | $1.06 | 25d | 1 | 0.42mi |
| 3521 Yarian Dr Haines City, FL | 3.0 | 2.0 | 1695 | $1,800 | $1.06 | 13d | 1 | 0.68mi |
| 3707 Eisel Way Haines City, FL | 3.0 | 2.0 | 1407 | $2,065 | $1.47 | 16d | 1 | 0.77mi |
| 3815 Whitney Way Haines City, FL | 4.0 | 2.0 | 1767 | $2,150 | $1.22 | 16d | 1 | 0.81mi |
| 4014 Alissa Ln Haines City, FL | 4.0 | 2.0 | 1598 | $2,250 | $1.41 | 25d | 1 | 0.83mi |
| 3593 Yarian Dr Haines City, FL | 3.0 | 2.0 | 1672 | $1,900 | $1.14 | 25d | 1 | 0.84mi |
| 3593 Yarian Dr Haines City, FL | 3.0 | 2.0 | 1672 | $1,900 | $1.14 | 12d | 1 | 0.84mi |
| 5280 Maddie Dr Haines City, FL | 4.0 | 2.0 | 2024 | $2,300 | $1.14 | 21d | 1 | 0.89mi |
| 4629 Bernard Blvd Haines City, FL | 4.0 | 2.0 | 2112 | $2,300 | $1.09 | 25d | 1 | 0.89mi |
| 5309 Maddie Dr Haines City, FL | 4.0 | 3.0 | 1850 | $2,300 | $1.24 | 25d | 1 | 0.89mi |
| 5268 Maddie Dr Haines City, FL | 4.0 | 2.0 | 1867 | $2,600 | $1.39 | 23d | 1 | 0.90mi |
| 4373 Deleon St Haines City, FL | 4.0 | 2.0 | 1867 | $2,250 | $1.21 | 25d | 1 | 0.95mi |
| 106 Reineke Rd Haines City, FL | 3.0 | 2.0 | 1344 | $1,495 | $1.11 | 5d | 1 | 0.98mi |
| 6004 Bimini Ave Haines City, FL | 3.0 | 2.0 | 1480 | $1,750 | $1.18 | 25d | 1 | 1.07mi |
| 4209 Deleon St Haines City, FL | 4.0 | 2.0 | 1863 | $2,450 | $1.32 | 16d | 1 | 1.14mi |
| 2518 Trinidad Rd Haines City, FL | 4.0 | 2.0 | 1830 | $2,150 | $1.17 | 25d | 1 | 1.14mi |
| 3329 Aruba Way Haines City, FL | 3.0 | 2.0 | 1669 | $2,200 | $1.32 | 25d | 1 | 1.30mi |
| 2621 Trinidad Rd Haines City, FL | 4.0 | 2.0 | 1830 | $2,200 | $1.20 | 25d | 1 | 1.33mi |
| 2393 Paulette Dr Haines City, FL | 3.0 | 2.0 | 1546 | $1,875 | $1.21 | 5d | 1 | 1.43mi |
| 1229 Forest Gate Cir Haines City, FL | 3.0 | 2.0 | 1584 | $1,895 | $1.20 | 16d | 1 | 1.48mi |
HOA detail
- Monthly dues
- $16 · $192/yr
Listing history 9 events
-
2026-03-26status Pending
-
2026-03-20price $190,000
-
2026-03-13price $219,900
-
2026-03-02$244,900 Active
-
2009-07-27soldstatus $70,000 247-char remark
Show marketing remark (247 chars)
LISTING PRICE MAY NOT BE SUFFICIENT TO PAY THE TOTAL OF ALL LIENS AND COSTS OF SALE , AND SALE PROPERTY AT FULL LISTING PRICE MAY REQUIRE APPROVAL OF SELLER'S LENDER(S0, AND SUCH APPROVAL MAY BE CONDITIONED UPON THE GROSS COMMISSION BEING REDUCED.
-
2009-02-03$89,900 247-char remark
Show marketing remark (247 chars)
LISTING PRICE MAY NOT BE SUFFICIENT TO PAY THE TOTAL OF ALL LIENS AND COSTS OF SALE , AND SALE PROPERTY AT FULL LISTING PRICE MAY REQUIRE APPROVAL OF SELLER'S LENDER(S0, AND SUCH APPROVAL MAY BE CONDITIONED UPON THE GROSS COMMISSION BEING REDUCED.
-
2006-06-23soldstatus $233,000
-
2006-06-09soldstatus $233,000 83-char remark
Show marketing remark (83 chars)
BRAND NEW NEVERLIVED IN. BEAUTIFUL FLOOR PLAN. CLOSE TO SHOPPING AND MAJOR HIGHWAYS
-
2005-12-21$224,900 83-char remark
Show marketing remark (83 chars)
BRAND NEW NEVERLIVED IN. BEAUTIFUL FLOOR PLAN. CLOSE TO SHOPPING AND MAJOR HIGHWAYS
ⓘ Source: listings_history table (triggers on properties + properties_extension) + one-shot
backfill from property_details.listing_events for pre-trigger history.
Tax reassessment forecast FL · Resets to sale price
- Current annual tax
- $1,039 · $87/mo
- Projected year-2 tax
- $1,577 · $131/mo
- Expected delta
- +$538/yr (+$45/mo · 51.7%)
ⓘ Screening estimate from a state-policy table — verify with the county assessor before closing.
Climate risk First Street
- Flood 1/10 Low FEMA zone X (unshaded) · 0% chance over 30 yrs
- Wildfire 7/10 Severe
- Heat 9/10 Extreme 7 d/yr ≥107°F today · 25 d/yr by 30 yrs out
- Wind 9/10 Extreme 99% chance of damaging wind over 30 yrs
- Air quality 1/10 Low 0 unhealthy d/yr today · 0 by 30 yrs out
Nearby sold comps map
Loading sold comps map…
Walkable amenities ~0.75 mi
Loading nearby amenities…
Taxation est. · year 1
- Rental income
- $27,524
- − Mortgage interest
- −$10,643
- − Property taxes
- −$1,039
- − Insurance
- −$950
- − Repairs & maintenance
- −$2,202
- − Management
- −$2,202
- − HOA
- −$192
- − Depreciation
- −$5,527
- Taxable income
- $4,768
- Est. tax owed @ 24.0%
- −$1,144
- After-tax cash flow
- $6,461/yr
For passive investors: Depreciation is non-cash, so a rental often shows a tax loss while cash-flowing — sheltering income. Rental losses are passive: they offset passive income freely, and up to $25,000/yr can offset ordinary (W-2) income if you actively participate and your MAGI is under $100k (phasing out to $0 by $150k); unused losses carry forward. On sale, claimed depreciation is recaptured at up to 25%, and gains may owe capital-gains tax (a 1031 exchange can defer both). Figures are a year-1 estimate at your 24.0% rate — not tax advice; consult a CPA.
Schools (NCES district)
- District
- Polk
- NCES district ID
- 1201590
- Math proficiency
- 39% ▼ -11.00%
- Reading proficiency
- 43% ▼ -4.00%
- Median HH income
- $43,979
- Composite
- 34.74/100
- National rank
- #5132
- State rank
- #62 of 73 in FL
Livability — Haines City
- Score
- 74/100
- State rank
- #285
- US rank
- #4575
Category grades
Schools grade is shown separately in the Schools card above.
Census & demographics
- Census place
- Haines City, FL
- County
- Polk County · 740,051 people
- City population
- 51,255
- Metro
- Lakeland-Winter Haven, FL
- Population (ZIP)
- 51,255
- Household income
- $63,650
- Rent vs Own
- Severe rent burden
- 1107.0
Population outlook (Polk County) Hauer SSP2
- Today (2025)
- 752,975 people
- By 2030
- 804,621 · +6.9%
- By 2040
- 906,117 · +20.3%
- By 2050
- 1,000,476 · +32.9%
- By 2075
- 1,197,520 · +59.0%
- By 2100
- 1,271,518 · +68.9%
Race, ethnicity, and origin ACS 2023
- Neighborhood character
- Diverse neighborhood (Simpson 0.64)
- Race & ethnicity
- Hispanic / Latino 48% White 31% Black 18% Two or more races 12% Asian 1%
- Hispanic origin (detail)
- Mexican 19% Puerto Rican 19% Cuban 1% Dominican 3%
- Common ancestry
- Hispanic 4% Lithuanian 1% Romanian 1%
- Foreign-born
- 15% · Canada, Jamaica, Guatemala
- Languages at home
- 55% English-only · Spanish 39% French/Haitian/Cajun 4% Other Indo-European 0%
Political lean MEDSL · Polk
- 2024 margin
- Strong R (+20.7) · D 39.2% · R 59.9%
- 2008→2024 swing
- -14.6pp toward R · 2008: -6.1pp · 2024: -20.7pp
- All cycles
- 2024: R+20.7 2020: R+14.4 2016: R+14.1 2012: R+6.8 2008: R+6.1
Not yet ingested
- Civics
- —
Market trends
- HPI YoY
- ▼ -105.94%
- Current HPI
- 291.0798
- Rent YoY
- ▲ 1.16%
- Metro
- Lakeland-Winter Haven, FL
- State GDP YoY
- ▲ 3.28%
- F500 in state
- 36
Industry mix (Fortune 500 HQ in FL)
| Industry | F500 HQs | Revenue |
|---|---|---|
| Industrial Technology | 2 | $29B |
|
||
| Insurance | 2 | $17B |
|
||
| Retail | 1 | $60B |
|
||
| Technology Distribution | 1 | $58B |
|
||
| Homebuilding | 1 | $35B |
|
||
| Technology Manufacturing | 1 | $35B |
|
||
Price history
-15.5% since first listed9 events — show timeline
- 2026-03-26 Pending — Stellar MLS as Distributed by MLS Grid
- 2026-03-20 Price Changed $190,000 Stellar MLS as Distributed by MLS Grid
- 2026-03-13 Price Changed $219,900 Stellar MLS as Distributed by MLS Grid
- 2026-03-02 Listed $244,900 Stellar MLS as Distributed by MLS Grid
- 2009-07-27 Sold (MLS) $70,000 Stellar MLS as Distributed by MLS Grid
- 2009-02-03 Listed $89,900 Stellar MLS as Distributed by MLS Grid
- 2006-06-23 Sold (Public Records) $233,000 Public Records
- 2006-06-09 Sold (MLS) $233,000 Stellar MLS as Distributed by MLS Grid
- 2005-12-21 Listed $224,900 Stellar MLS as Distributed by MLS Grid
Property tax history
+3.9%/yrLatest (2025): $1,039 · +2.5% YoY. Source: county tax records.
Cash-flow waterfall
monthlySold comps — $/sqft
last 12 mo · ≤1 miLoading sold comps…