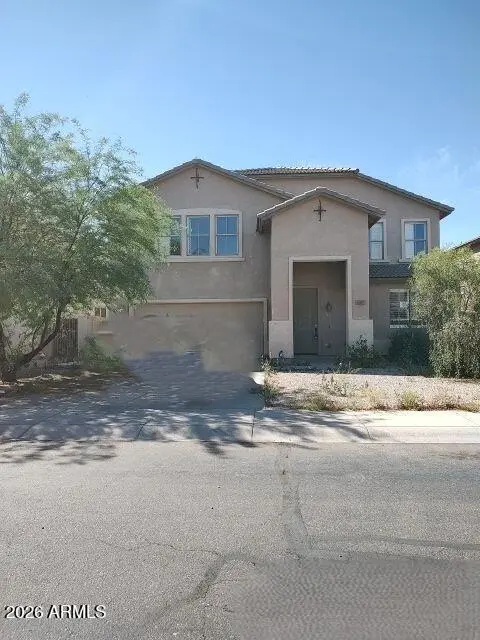
46041 W Belle Ave · Maricopa, AZ
Flood risk 1/10 · Minimal
- FEMA flood zone
- X (unshaded)
- Chance of flooding over 30 yrs
- 0.0%
- Est. flood insurance / yr
- $507 – $1,088
Fire risk 7/10 · Major
- Est. fire insurance / yr
- $610 – $1,132
Heat risk 9/10 · Severe
- Hot days now (above 114°F)
- 7 days/yr
- Hot days in 30 yrs
- 18 days/yr
Wind risk 1/10 · Minimal
- Chance of severe wind over 30 yrs
- —
Air-quality risk 1/10 · Minimal
- Unhealthy air days now
- 0 days/yr
- Unhealthy air days in 30 yrs
- 0 days/yr
Risk factors via First Street. Map © Google.
Why this score? — see what drove the D- grade
The composite is a weighted blend of 9 inputs, each scored 0–100. Each bar is that input's sub-score; the figure is the points it added to the 100-point composite (weight × sub-score).
- ARV discount +15.0/15.0
- Cash flow +8.4/30.0
- Livability +3.6/5.0
- 1% rule +2.9/10.0
- Condition / age +2.5/5.0
- DSCR +2.3/10.0
- Schools +2.3/10.0
- Rent growth +2.0/5.0
- Appreciation +0.0/10.0
$290,000
🖨 Deal sheet 📄 Offer letter ✓ Due diligence
Listing remarks
Room to spread out and keep life moving--this 5-bedroom, 3-bath Maricopa home offers an open floor plan, natural flow, island kitchen, 3 full bathrooms, and a 2-car attached garage. The layout gives flexibility for everyday living, work, guests, or extra storage, while the kitchen anchors the main living space for easy use. Conveniently located near local shopping, dining, schools, parks, and main routes through Maricopa.
Key facts
- Open floor plan
- Island kitchen
- 6,326 sq ft lot
Tags
Property features AI
Finance
- Other: Lot features include gravel/stone front and back
- HOA & community: Community association with quarterly fee of $240; Association covers street maintenance and other items; Biking/walking path in community
Exterior
- Parking: Covered parking for 2 vehicles; 2-car garage
- Utilities: City water; Public sewer
- Home design: Single family residence; Fee simple ownership; City and city lights views; Asphalt road access
- Construction: Stucco, cement siding, and block construction; Composition roof
- Exterior features: Private street(s); Gravel/stone front and back; Other exterior features
Interior
- Kitchen: Built-in microwave; Dishwasher
- Bedrooms: Up to 4 bedrooms; Primary bedroom located on the main level
- Flooring: Carpet; Tile
- Bathrooms: 3 full bathrooms
- Heating & cooling: Electric heating; Central air conditioning
- Interior features: Two master bathrooms; Dishwasher
- Laundry & utility: Washer/dryer hookup; Gas dryer hookup
Neighborhood map
What this means for you Summary
Snapshot
- This is a 4-bed/3.0-bath single-family listed at $290k.
Deal economics
- At list price, monthly cash flow is $-258 ($-3k/yr) — negative.
- To cash-flow at today's rent, offer at most $244k (15.7% below list).
- To meet the 1% rule (rent ≥ 1% of price), the offer needs to be $228k (21.4% below list).
- Recommended offer: $228k (21.4% below list) — sets the bar for 1% rule.
- Cap rate 5.2% vs local median 3.7% in Maricopa — top-decile yield for the area; either an underpriced asset or a hidden risk that comps aren't pricing in. Stress-test before assuming the spread holds.
Location & tenants
- Location reads 72/100 on livability (#28 in AZ) — a middle-class / working-renter tenant base. Strengths: housing A+, employment A-, crime B+; Watch: amenities F, commute F, health & safety F.
- Maricopa Unified School District (4441) (town): math 20% / reading 29% proficiency, ranked #128 of 249 in AZ (top 51%) — low school quality limits family demand, transient renter base, plan for 1-2y turnover.
- Zoned schools: Maricopa Elementary School (math 23% / reading 28%, grade F, #631 of 1,109 statewide, top 57%, 733 students, 65% FRL); Maricopa Wells Middle School (math 13% / reading 23%, grade F, #143 of 218 statewide, top 66%, 934 students, 57% FRL); Maricopa High School (math 12% / reading 19%, grade F, #262 of 381 statewide, top 69%, 2,188 students, 46% FRL).
- Market conditions: Rents soft (-2.1%/yr); 415 active listings in the ZIP; 4 comparable units currently listed for rent nearby; rentals leasing fast (median 10d on market — plan ~1-2 weeks tenant-placement turnaround); solid renter incomes; 9,504 units permitted in Pinal County in 2024 (776 in 5+ unit buildings).
- This rent runs 31% of the median local income ($87k/yr) — at the standard rent-burdened threshold; future hikes will face affordability resistance.
Forward outlook
- Local home prices are declining (-3.0%/yr); year-one equity from $2k of loan paydown is wiped out by about $9k of value loss. Plan a longer hold.
Negotiation context
- It's been on market 48 days — a 3% lower offer ($281k) is reasonable based on typical stale-listing flexibility.
Risks & watch-outs
- Climate carrying-cost: major wildfire risk; extreme-heat days projected 7→18/yr by 2055 (HVAC capex compounding) — expect insurance premiums to compound above CPI over the hold.
Questions for the listing agent
- What do current leases actually rent for vs. the listed asking? Can we see a recent rent roll and the last 12 months of T-12 income?
- It's been on market 48 days. Have you received any prior offers? Is the seller open to a 21% concession, seller financing, or rate buy-down credit?
- What does the HOA fee cover, when was the last increase, and are there any pending special assessments or reserve-fund shortfalls?
- Is there a deadline driving the sale (1031 exchange, divorce, estate, relocation)? That informs how much negotiation room exists.
- Schools are B-rated — typically a magnet for longer-tenancy family renters. What's the average tenant stay here, and is there a school-zone premium baked into asking?
- The area grade is low — what's the realistic commute time and amenity access for the typical tenant pool here? Any planned neighborhood developments (good or bad) we should know about?
- What's the average days-on-market for RENTAL listings here right now (not sales)? A rising rental-DOM trend means longer vacancies and softer asking-rent achievability than the comps imply.
- What's the recent tenant-quality profile in this submarket — average credit score on applications, eviction rate, late-payment / NSF rate, and stable-employment percentage? A property-management company in the area should have these aggregated.
- How much new for-sale + rental construction is in the pipeline within 1–3 miles? Heavy new supply typically softens prices + rents 12–24 months out; constrained supply supports both.
Investment metrics
- 1% rule
- 0.79% ✗
- Cap rate
- 5.23%
- Cash-on-cash
- -3.81%
- DSCR
- 0.83
- GRM
- 10.6
CMA / ARV
- ARV (median comp)
- $412,431
- List price
- $290,000
- Delta
- -29.69%
- Verdict
- UNDERPRICED
- Comps
- 20 within 1.0 mi
Show comp detail 4 sales within ~0.75 mi
| Address | Dist | Beds/Ba | Sqft | Sold | Price | $/sf | Match |
|---|---|---|---|---|---|---|---|
| 46057 W Dutchman Dr | 0.05mi | 4/3.0 | 3,925 (-4%) | 3mo | $355,000 | $90 | 89 |
| 46088 W Sonny Rd | 0.04mi | 4/2.5 | 3,829 (-6%) | 3mo | $369,000 | $96 | 84 |
| 46137 W Belle Ave | 0.06mi | 4/2.5 | 3,884 (-5%) | 4mo | $371,250 | $96 | 84 |
| 19182 N Smith Dr | 0.12mi | 5/2.5 (+1) | 3,741 (-8%) | 10mo | $384,000 | $103 | 65 |
Match score weights: distance 35% · size 25% · config 20% · recency 20%. Top-matched comps best support the ARV.
Projected returns pro-forma
-3.0% appreciation · 0.0% rent growth · sell at horizon
- IRR
- -26.2%
- Equity multiple
- 0.14×
- Total profit
- $-70,025
- Equity at exit
- $43,240
- IRR
- -37.8%
- Equity multiple
- -0.33×
- Total profit
- $-107,658
- Equity at exit
- $25,074
Cash invested: $81,200 (down + closing). Projections, not guarantees.
Landlord ↔ Tenant lean methodology
- Overall (STATE)
- 87 Strongly Landlord-Friendly
- State Arizona
- 87 Strongly Landlord-Friendly · R+3
- County
- — inherits STATE
- City
- — inherits STATE
ZIP-level market 85139
- Home prices YoY
- -17.4%
- Rents YoY
- -2.1%
- Active inventory
- 415
- Price-to-rent
- 10.6×
Monthly cashflow live
- Estimated rent
- $2,279 medium interval (Pro) →
- Mortgage (P&I)
- −$1,521
- Tax from tax record
- −$337 /mo · $4,040/yr
- Insurance
- −$121
- HOA
- −$80
- Vacancy / Maint / Mgmt
- −$479
- Net cashflow
- $-258
Break-even live
UW: 25.0% down · 7.5% · 30yr · 1.5% tax · 5.0% vac · 8.0% maint · 8.0% mgmt
Financing live
Cash to close
- Down payment
- $72,500
- Closing costs
- $8,700
- Reserves months
- —
- Total cash needed
- —
Loan-product check · same deal, 3 products live
Conventional
25% down · 7.5% · 30yr
- Down + closing
- —
- Monthly P&I
- —
- Monthly cashflow
- —
- DSCR
- —
- Eligible?
- —
Personal DTI + credit; lowest rate.
DSCR
20% down · 8.5% · 30yr
- Down + closing
- —
- Monthly P&I
- —
- Monthly cashflow
- —
- DSCR
- —
- Eligible?
- —
No personal income docs; deal must DSCR.
Hard money
10% down · 12.0% · 12mo
- Down + closing
- —
- Monthly P&I
- —
- Monthly cashflow
- —
- DSCR
- —
- Eligible?
- —
Short-term bridge; refi at stabilization.
Rent comps 4 comps
| Address | Beds | Baths | Sqft | Rent | $/sqft | DOM | Units | Dist |
|---|---|---|---|---|---|---|---|---|
| 46137 W Belle Ave Maricopa, AZ | 4.0 | 2.5 | 3884 | $2,095 | $0.54 | 5d | 1 | 0.09mi |
| 45666 W Tucker Rd Maricopa, AZ | 5.0 | 2.5 | 3256 | $2,950 | $0.91 | 10d | 1 | 0.50mi |
| 45599 W Tucker Rd Maricopa, AZ | 4.0 | 2.5 | 3212 | $2,000 | $0.62 | 21d | 1 | 0.54mi |
| 45063 W Jack Rabbit Trl Maricopa, AZ | 4.0 | 2.5 | 3040 | $2,269 | $0.75 | 2d | 1 | 0.64mi |
HOA detail
- Monthly dues
- $80 · $960/yr
Listing history 16 events
-
2026-06-18days on market $290,000 Active 48 DOM
-
2026-06-17days on market $290,000 Active 47 DOM
-
2026-06-16days on market $290,000 Active 46 DOM
-
2026-06-15days on market $290,000 Active 45 DOM
-
2026-06-13days on market $290,000 Active 43 DOM
-
2026-06-13days on market $290,000 Active 42 DOM
-
2026-06-09days on market $290,000 Active 39 DOM
-
2026-06-08pricedays on market $290,000 Active 38 DOM
-
2026-06-07days on market $305,000 Active 37 DOM
-
2026-06-04days on market $305,000 Active 34 DOM
-
2026-06-03days on market $305,000 Active 33 DOM
-
2026-06-02days on market $305,000 Active 32 DOM
-
2026-06-01days on market $305,000 Active 31 DOM
-
2026-05-31days on market $305,000 Active 30 DOM
-
2026-05-01$305,000 Active 425-char remark
-
2004-04-14soldstatus $3,188,100
ⓘ Source: listings_history table (triggers on properties + properties_extension) + one-shot
backfill from property_details.listing_events for pre-trigger history.
Tax reassessment forecast AZ · Resets to sale price
- Current annual tax
- $4,040 · $337/mo
- Projected year-2 tax
- $4,040 · $337/mo
- Expected delta
- $0/yr ($0/mo · 0.0%)
ⓘ Screening estimate from a state-policy table — verify with the county assessor before closing.
Climate risk First Street
- Flood 1/10 Low FEMA zone X (unshaded) · 0% chance over 30 yrs
- Wildfire 7/10 Severe
- Heat 9/10 Extreme 7 d/yr ≥114°F today · 18 d/yr by 30 yrs out
- Wind 1/10 Low
- Air quality 1/10 Low 0 unhealthy d/yr today · 0 by 30 yrs out
Nearby sold comps map
Loading sold comps map…
Walkable amenities ~0.75 mi
Loading nearby amenities…
Taxation est. · year 1
- Rental income
- $27,348
- − Mortgage interest
- −$16,245
- − Property taxes
- −$4,040
- − Insurance
- −$1,450
- − Repairs & maintenance
- −$2,188
- − Management
- −$2,188
- − HOA
- −$960
- − Depreciation
- −$8,436
- Taxable loss
- −$8,158
- Est. tax savings @ 24.0%
- +$1,958
- After-tax cash flow
- $-1,136/yr
For passive investors: Depreciation is non-cash, so a rental often shows a tax loss while cash-flowing — sheltering income. Rental losses are passive: they offset passive income freely, and up to $25,000/yr can offset ordinary (W-2) income if you actively participate and your MAGI is under $100k (phasing out to $0 by $150k); unused losses carry forward. On sale, claimed depreciation is recaptured at up to 25%, and gains may owe capital-gains tax (a 1031 exchange can defer both). Figures are a year-1 estimate at your 24.0% rate — not tax advice; consult a CPA.
Schools (NCES district)
- District
- Maricopa Unified School District (4441)
- NCES district ID
- 0404720
- Math proficiency
- 20% ▼ -18.00%
- Reading proficiency
- 29% ▼ -9.00%
- Median HH income
- $63,725
- Composite
- 22.92/100
- National rank
- #7993
- State rank
- #128 of 249 in AZ
Livability — Maricopa
- Score
- 72/100
- State rank
- #28
- US rank
- #5943
Category grades
Schools grade is shown separately in the Schools card above.
Census & demographics
- Census place
- Maricopa, AZ
- County
- Pinal County · 399,947 people
- City population
- 76,044
- Metro
- Phoenix-Mesa-Chandler, AZ
- Population (ZIP)
- 20,784
- Household income
- $86,894
- Rent vs Own
- Severe rent burden
- 272.0
Population outlook (Pinal County) Hauer SSP2
- Today (2025)
- 437,574 people
- By 2030
- 446,903 · +2.1%
- By 2040
- 452,589 · +3.4%
- By 2050
- 444,126 · +1.5%
- By 2075
- 430,300 · -1.7%
- By 2100
- 393,536 · -10.1%
Race, ethnicity, and origin ACS 2023
- Neighborhood character
- Diverse neighborhood (Simpson 0.68)
- Race & ethnicity
- White 48% Hispanic / Latino 28% Two or more races 13% Black 9% Native American 8% Asian 2%
- Hispanic origin (detail)
- Mexican 25%
- Common ancestry
- Portuguese 2% Lithuanian 2% Italian 2%
- Foreign-born
- 10% · Canada
- Languages at home
- 80% English-only · Spanish 17% Vietnamese 1% Other Asian/Pacific 0%
Political lean MEDSL · Pinal
- 2024 margin
- Strong R (+22.1) · D 38.5% · R 60.6%
- 2008→2024 swing
- -7.6pp toward R · 2008: -14.5pp · 2024: -22.1pp
- All cycles
- 2024: R+22.1 2020: R+17.3 2016: R+19.3 2012: R+17.1 2008: R+14.5
Not yet ingested
- Civics
- —
Market trends
- HPI YoY
- ▼ -66.22%
- Current HPI
- 313.8539
- Rent YoY
- ▼ -2.10%
- Metro
- Phoenix-Mesa-Chandler, AZ
- State GDP YoY
- ▲ 4.54%
- F500 in state
- 20
Industry mix (Fortune 500 HQ in AZ)
| Industry | F500 HQs | Revenue |
|---|---|---|
| Technology | 2 | $13B |
|
||
| Mining / Metals | 1 | $23B |
|
||
| Environmental Services | 1 | $16B |
|
||
| Metals / Steel | 1 | $14B |
|
||
| Technology Distribution | 1 | $9B |
|
||
| Homebuilding | 1 | $8B |
|
||
Price history
-90.9% since first listed3 events — show timeline
- 2026-06-08 Price Changed $290,000 ARMLS
- 2026-05-01 Listed $305,000 ARMLS
- 2004-04-14 Sold (Public Records) $3,188,100 Public Records
Property tax history
+1.1%/yrLatest (2025): $4,040 · -1.5% YoY. Source: county tax records.
Cash-flow waterfall
monthlySold comps — $/sqft
last 12 mo · ≤1 miLoading sold comps…