207 N Walnut St · Fort Cobb, OK
Flood risk 1/10 · Minimal
- FEMA flood zone
- X (unshaded)
- Chance of flooding over 30 yrs
- 0.0%
- Est. flood insurance / yr
- $507 – $1,088
Fire risk 4/10 · Minor
- Est. fire insurance / yr
- $2,463 – $4,575
Heat risk 6/10 · Moderate
- Hot days now (above 107°F)
- 7 days/yr
- Hot days in 30 yrs
- 19 days/yr
Wind risk 2/10 · Minimal
- Chance of severe wind over 30 yrs
- 3.0%
Air-quality risk 1/10 · Minimal
- Unhealthy air days now
- 0 days/yr
- Unhealthy air days in 30 yrs
- 0 days/yr
Risk factors via First Street. Map © Google.
Why this score? — see what drove the C- grade
The composite is a weighted blend of 9 inputs, each scored 0–100. Each bar is that input's sub-score; the figure is the points it added to the 100-point composite (weight × sub-score).
- Cash flow +20.2/30.0
- ARV discount +7.5/15.0
- DSCR +6.4/10.0
- 1% rule +4.0/10.0
- Livability +3.2/5.0
- Schools +2.6/10.0
- Rent growth +2.5/5.0
- Condition / age +2.5/5.0
- Appreciation +2.2/10.0
$112,000
🖨 Deal sheet 📄 Offer letter ✓ Due diligence
Listing remarks
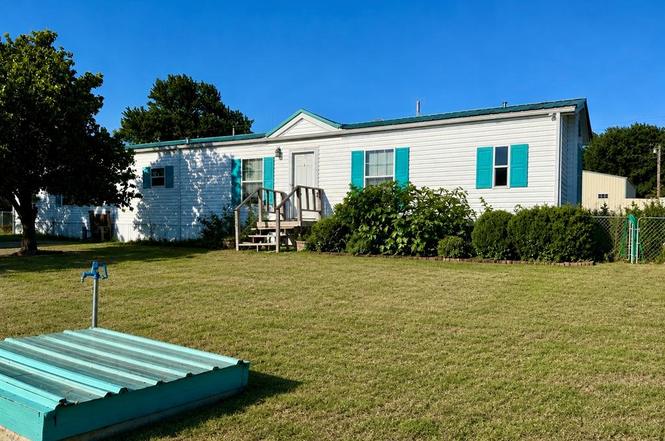
Country Living Minutes from Fort Cobb Lake- Contents Included!! Discover a unique opportunity just minutes from Fort Cobb lake! This 3 bedroom, 2 Bathroom mobile home sits on a spacious property and offers excellent value for the right buyer looking for a project with big potential. The home features a durable metal roof, a functional layout, and all contents will remain, making this an ideal investment, weekend getaway, or full-time residence after updates. Outside, the property truly shines with a water well, a shop with garage door, covered outbuilding, and a charming gazebo- perfect for storage, hobbies, or enjoying quiet Oklahoma evenings. * IMPORTANT DISCLOSURE * The home does hav
Key facts
- Metal roof
- Water well
- Charming gazebo
Tags
Property features AI
Finance
- Other: Homestead not claimed
- Financial info: Assumable financing not available; Loan qualification unknown
- HOA & community: No mandatory association dues
Exterior
- Utilities: Private well available
- Home design: Single family residence; One story; Faces west; Residential property; Move-to-site build status
- Construction: Mobile construction; Metal roof; Conventional foundation
- Exterior features: Gazebo; Outbuildings; Interior lot
Interior
- Kitchen: Freestanding electric range; Electric oven
- Bedrooms: 3 bedrooms
- Bathrooms: 2 full bathrooms
- Heating & cooling: Electric heating
- Interior features: Dishwasher; Refrigerator; No fireplace
Neighborhood map
What this means for you Summary
Snapshot
- This is a 3-bed/2.0-bath manufactured listed at $112k.
Deal economics
- At list price, monthly cash flow is $142 ($2k/yr) — positive.
- The deal already cash-flows at list — no discount required.
- To meet the 1% rule (rent ≥ 1% of price), the offer needs to be $101k (10.1% below list).
- Recommended offer: $99k (12.0% below list) — sets the bar for market timing.
Location & tenants
- Location reads 63/100 on livability (#200 in OK) — a middle-class / working-renter tenant base. Strengths: crime A+, cost of living A+, housing A; Watch: employment C-, amenities F, commute F.
- Binger-Oney (rural): math 25% / reading 30% proficiency, ranked #305 of 513 in OK (top 60%) — low school quality limits family demand, transient renter base, plan for 1-2y turnover; 64% free/reduced lunch — lower-income household profile, screen leases tightly.
- Zoned schools: Binger-Oney Es (math 22% / reading 17%, grade F, #479 of 845 statewide, top 63%, 191 students, 0% FRL); Binger-Oney Hs (math 30% / reading 50%, grade F, #25 of 447 statewide, top 8%, 99 students, 0% FRL) — zoned schools average 0% FRL vs 64% district-wide (64 pts lower); this property's tenant base skews higher-income than the district average.
- Market conditions: 18 active listings in the ZIP.
Forward outlook
- Local home prices are declining (-3.0%/yr); year-one equity from $774 of loan paydown is wiped out by about $3k of value loss. Plan a longer hold.
- Caddo County population projected to shrink 7% by 2050 — rents likely to lag national; underwrite the cash flow, not the appreciation.
Negotiation context
- It's been on market 140 days — a 12% lower offer ($99k) is reasonable based on typical stale-listing flexibility.
- 2 sale attempts since 9y ago; this cycle's ask has dropped $18k (14%) from the opening price — seller is motivated, your offer sets the floor, not the list.
- Current owner paid $9k; list at $112k implies a 1144% gain — meaningful room to come down on a strong offer.
Risks & watch-outs
- Climate carrying-cost: extreme-heat days projected 7→19/yr by 2055 (HVAC capex compounding) — expect insurance premiums to compound above CPI over the hold.
Questions for the listing agent
- It's been on market 140 days. Have you received any prior offers? Is the seller open to a 12% concession, seller financing, or rate buy-down credit?
- Why hasn't it sold? Are there any deal-killer items the seller is aware of (foundation, flood, title, zoning, code violations)?
- Is there a deadline driving the sale (1031 exchange, divorce, estate, relocation)? That informs how much negotiation room exists.
- Schools are F-rated, which usually means shorter tenancies and higher turnover. Who's the typical renter profile here, and what's been the actual vacancy rate?
- What's the average days-on-market for RENTAL listings here right now (not sales)? A rising rental-DOM trend means longer vacancies and softer asking-rent achievability than the comps imply.
- What's the recent tenant-quality profile in this submarket — average credit score on applications, eviction rate, late-payment / NSF rate, and stable-employment percentage? A property-management company in the area should have these aggregated.
- How much new for-sale + rental construction is in the pipeline within 1–3 miles? Heavy new supply typically softens prices + rents 12–24 months out; constrained supply supports both.
Investment metrics
- 1% rule
- 0.90% ✗
- Cap rate
- 7.81%
- Cash-on-cash
- 5.42%
- DSCR
- 1.24
- GRM
- 9.3
CMA / ARV
No comps found within radius.
Projected returns pro-forma
-3.0% appreciation · 3.0% rent growth · sell at horizon
- IRR
- -8.0%
- Equity multiple
- 0.71×
- Total profit
- $-9,183
- Equity at exit
- $16,700
- IRR
- 1.5%
- Equity multiple
- 1.11×
- Total profit
- $3,385
- Equity at exit
- $9,684
Cash invested: $31,360 (down + closing). Projections, not guarantees.
Landlord ↔ Tenant lean methodology
- Overall (STATE)
- 83 Strongly Landlord-Friendly
- State Oklahoma
- 83 Strongly Landlord-Friendly · R+20
- County
- — inherits STATE
- City
- — inherits STATE
ZIP-level market 73038
- Home prices YoY
- -3.3%
- Active inventory
- 18
- Price-to-rent
- 9.3×
Monthly cashflow live
- Estimated rent
- $1,007 medium interval (Pro) →
- Mortgage (P&I)
- −$587
- Tax from tax record
- −$20 /mo · $239/yr
- Insurance
- −$47
- HOA
- −$0
- Vacancy / Maint / Mgmt
- −$211
- Net cashflow
- $142
Break-even live
UW: 25.0% down · 7.5% · 30yr · 1.5% tax · 5.0% vac · 8.0% maint · 8.0% mgmt
Financing live
Cash to close
- Down payment
- $28,000
- Closing costs
- $3,360
- Reserves months
- —
- Total cash needed
- —
Loan-product check · same deal, 3 products live
Conventional
25% down · 7.5% · 30yr
- Down + closing
- —
- Monthly P&I
- —
- Monthly cashflow
- —
- DSCR
- —
- Eligible?
- —
Personal DTI + credit; lowest rate.
DSCR
20% down · 8.5% · 30yr
- Down + closing
- —
- Monthly P&I
- —
- Monthly cashflow
- —
- DSCR
- —
- Eligible?
- —
No personal income docs; deal must DSCR.
Hard money
10% down · 12.0% · 12mo
- Down + closing
- —
- Monthly P&I
- —
- Monthly cashflow
- —
- DSCR
- —
- Eligible?
- —
Short-term bridge; refi at stabilization.
Listing history 20 events
-
2026-06-18days on market $112,000 Active 140 DOM
-
2026-06-17days on market $112,000 Active 139 DOM
-
2026-06-16days on market $112,000 Active 138 DOM
-
2026-06-15days on market $112,000 Active 137 DOM
-
2026-06-13days on market $112,000 Active 135 DOM
-
2026-06-12days on market $112,000 Active 134 DOM
-
2026-06-09days on market $112,000 Active 131 DOM
-
2026-06-08days on market $112,000 Active 130 DOM
-
2026-06-08days on market $112,000 Active 129 DOM
-
2026-06-05days on market $112,000 Active 127 DOM
-
2026-06-04days on market $112,000 Active 125 DOM
-
2026-06-02days on market $112,000 Active 124 DOM
-
2026-06-01days on market $112,000 Active 123 DOM
-
2026-05-31days on market $112,000 Active 122 DOM
-
2026-03-27price $115,000
-
2026-01-29$130,000 Active
-
2018-08-08historical
-
2017-08-08$105,000 Active
-
2004-09-17soldstatus $9,000
-
2002-09-09soldstatus $8,000
ⓘ Source: listings_history table (triggers on properties + properties_extension) + one-shot
backfill from property_details.listing_events for pre-trigger history.
Tax reassessment forecast OK · Resets to sale price
- Current annual tax
- $239 · $20/mo
- Projected year-2 tax
- $1,008 · $84/mo
- Expected delta
- +$769/yr (+$64/mo · 321.8%)
ⓘ Screening estimate from a state-policy table — verify with the county assessor before closing.
Climate risk First Street
- Flood 1/10 Low FEMA zone X (unshaded) · 0% chance over 30 yrs
- Wildfire 4/10 Moderate
- Heat 6/10 Major 7 d/yr ≥107°F today · 19 d/yr by 30 yrs out
- Wind 2/10 Low 3% chance of damaging wind over 30 yrs
- Air quality 1/10 Low 0 unhealthy d/yr today · 0 by 30 yrs out
Nearby sold comps map
Loading sold comps map…
Walkable amenities ~0.75 mi
Loading nearby amenities…
Taxation est. · year 1
- Rental income
- $12,085
- − Mortgage interest
- −$6,274
- − Property taxes
- −$239
- − Insurance
- −$560
- − Repairs & maintenance
- −$967
- − Management
- −$967
- − Depreciation
- −$3,258
- Taxable loss
- −$179
- Est. tax savings @ 24.0%
- +$43
- After-tax cash flow
- $1,743/yr
For passive investors: Depreciation is non-cash, so a rental often shows a tax loss while cash-flowing — sheltering income. Rental losses are passive: they offset passive income freely, and up to $25,000/yr can offset ordinary (W-2) income if you actively participate and your MAGI is under $100k (phasing out to $0 by $150k); unused losses carry forward. On sale, claimed depreciation is recaptured at up to 25%, and gains may owe capital-gains tax (a 1031 exchange can defer both). Figures are a year-1 estimate at your 24.0% rate — not tax advice; consult a CPA.
Schools (NCES district)
- District
- Binger-Oney
- NCES district ID
- 4033603
- Math proficiency
- 25% ▼ -10.00%
- Reading proficiency
- 30% ▼ -10.00%
- Median HH income
- $40,528
- Composite
- 26.15/100
- National rank
- #12717
- State rank
- #305 of 513 in OK
Livability — Fort Cobb
- Score
- 63/100
- State rank
- #200
- US rank
- #15072
Category grades
Schools grade is shown separately in the Schools card above.
Census & demographics
- Population (ZIP)
- 1,442
Population outlook (Caddo County) Hauer SSP2
- Today (2025)
- 28,391 people
- By 2030
- 27,844 · -1.9%
- By 2040
- 27,057 · -4.7%
- By 2050
- 26,484 · -6.7%
- By 2075
- 26,266 · -7.5%
- By 2100
- 26,077 · -8.2%
Race, ethnicity, and origin ACS 2023
- Neighborhood character
- Diverse neighborhood (Simpson 0.57)
- Race & ethnicity
- White 64% Native American 21% Two or more races 12% Hispanic / Latino 11%
- Hispanic origin (detail)
- Mexican 9% Puerto Rican 1%
- Common ancestry
- Lithuanian 2% Iranian 1% Romanian 1%
- Foreign-born
- 1% · Canada
- Languages at home
- 96% English-only · Spanish 4%
Political lean MEDSL · Caddo
- 2024 margin
- Solid R (+47.1) · D 25.4% · R 72.5% · Other 2.1%
- 2008→2024 swing
- -16.4pp toward R · 2008: -30.7pp · 2024: -47.1pp
- All cycles
- 2024: R+47.1 2020: R+44.0 2016: R+43.4 2012: R+28.5 2008: R+30.7
Not yet ingested
- Civics
- —
Market trends
- HPI YoY
- ▼ -5.67%
- Current HPI
- 167.8913
- Rent YoY
- —
- Metro
- —
- State GDP YoY
- ▲ 1.55%
- F500 in state
- 6
Industry mix (Fortune 500 HQ in OK)
| Industry | F500 HQs | Revenue |
|---|---|---|
| Energy | 3 | $48B |
|
||
Price history
+1337.5% since first listed6 events — show timeline
- 2026-03-27 Price Changed $115,000 MLSOK
- 2026-01-29 Listed $130,000 MLSOK
- 2018-08-08 Listing Removed — MLSOK
- 2017-08-08 Listed $105,000 MLSOK
- 2004-09-17 Sold (Public Records) $9,000 Public Records
- 2002-09-09 Sold (Public Records) $8,000 Public Records
Property tax history
-3.5%/yrLatest (2025): $239 · +1.7% YoY. Source: county tax records.
Cash-flow waterfall
monthlySold comps — $/sqft
last 12 mo · ≤1 miLoading sold comps…