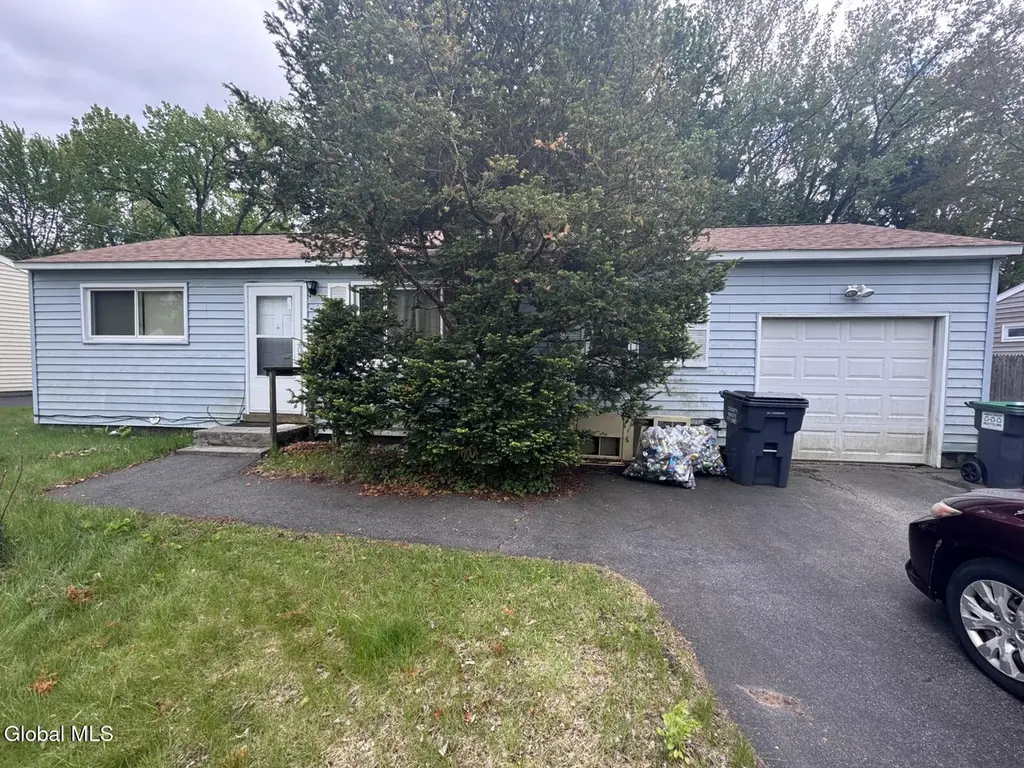
9 Mary Hadge Dr · Niskayuna, NY
Flood risk 1/10 · Minimal
- FEMA flood zone
- X (unshaded)
- Chance of flooding over 30 yrs
- 0.0%
- Est. flood insurance / yr
- $507 – $1,088
Fire risk 3/10 · Minor
- Est. fire insurance / yr
- $691 – $1,283
Heat risk 3/10 · Minor
- Hot days now (above 96°F)
- 7 days/yr
- Hot days in 30 yrs
- 16 days/yr
Wind risk 3/10 · Minor
- Chance of severe wind over 30 yrs
- 5.0%
Air-quality risk 1/10 · Minimal
- Unhealthy air days now
- 0 days/yr
- Unhealthy air days in 30 yrs
- 0 days/yr
Risk factors via First Street. Map © Google.
Why this score? — see what drove the C grade
The composite is a weighted blend of 9 inputs, each scored 0–100. Each bar is that input's sub-score; the figure is the points it added to the 100-point composite (weight × sub-score).
- Cash flow +18.4/30.0
- ARV discount +15.0/15.0
- DSCR +5.8/10.0
- 1% rule +5.3/10.0
- Schools +5.3/10.0
- Livability +4.5/5.0
- Condition / age +2.5/5.0
- Rent growth +2.1/5.0
- Appreciation +0.0/10.0
$200,000
🖨 Deal sheet (PDF) 📄 Offer letter ✓ Due diligence
Listing remarks
ATTENTION INVESTORS: 3-bedroom, 1-bath home ready for rehab with tons of potential in a quiet neighborhood within the highly desirable South Colonie Central School District. Featuring a 2-car attached garage, this property offers a solid starting point for your renovation vision. Conveniently located close to shopping, dining, and entertainment, it's a fantastic opportunity for investors or handy buyers alike. Whether you're looking for your next fix-and-flip project or a long-term rental addition to your portfolio, this home offers strong upside potential in a sought-after area. CASH BUYERS ONLY - ASSIGNMENT OF CONTRACT
Key facts
- Close to dining
- Quiet neighborhood
- Close to shopping
Tags
Property features AI
Exterior
- Parking: 2-car garage
- Utilities: Public water; Public sewer
- Home design: Single family residence; One-story (all main rooms listed on first level)
- Construction: Vinyl siding construction
- Exterior features: Shingle roof; Vinyl siding; 0.18 acre lot
Interior
- Kitchen: Oven; Range; Refrigerator
- Bedrooms: Three first-floor bedrooms
- Bathrooms: One full bathroom on the first floor
- Heating & cooling: Forced air heating (natural gas); Cooling present (type listed as other)
- Interior features: 6 total rooms; Crawl space basement; Other exterior features noted
- Laundry & utility: First-floor laundry room
Neighborhood map
What this means for you Summary
Snapshot
- This is a 3-bed/1.0-bath single-family listed at $200k.
Deal economics
- At list price, monthly cash flow is $188 ($2k/yr) — positive.
- The deal already cash-flows at list — no discount required.
- Meets the 1% rule at list price ($2k rent vs $200k).
- Recommended offer: $194k (3.0% below list) — sets the bar for market timing.
- Cap rate 7.4% vs local median 2.6% in Niskayuna — top-decile yield for the area; either an underpriced asset or a hidden risk that comps aren't pricing in. Stress-test before assuming the spread holds.
Location & tenants
- Location reads 91/100 on livability (#3 in NY, #51 nationally) — a professional / high-income tenant draw. Strengths: commute A+, employment A+, housing A+; Watch: cost of living F.
- South Colonie Central School District (suburban): math 63% / reading 57% proficiency, ranked #215 of 590 in NY (top 36%) — acceptable for families but not a draw, mixed tenant base, ~2y average lease; only 19% free/reduced lunch — higher-income household profile.
- Zoned schools: Veeder Elementary School (math 67% / reading 62%, grade B, #591 of 2,108 statewide, top 31%, 436 students, 32% FRL); Lisha Kill Middle School (math 44% / reading 55%, grade C, #280 of 729 statewide, top 40%, 628 students, 33% FRL); Colonie Central High School (math 96% / reading 72%, grade A, #404 of 1,100 statewide, top 37%, 1,538 students, 39% FRL) — zoned schools average 35% FRL vs 19% district-wide (16 pts higher); higher-poverty schools than district average — tighter screening recommended.
- Market conditions: Rents soft (-1.6%/yr); 166 active listings in the ZIP; high-income renter base; 675 units permitted in Albany County in 2024 (451 in 5+ unit buildings).
Forward outlook
- Local home prices are declining (-3.0%/yr); year-one equity from $1k of loan paydown is wiped out by about $6k of value loss. Plan a longer hold.
- Albany County population projected at +9% by 2050 — modest demand growth; plan on rents tracking national, not racing it.
Negotiation context
- It's been on market 37 days — a 3% lower offer ($194k) is reasonable based on typical stale-listing flexibility.
Risks & watch-outs
- Watch-outs: built in 1954 — expect roof / HVAC / electrical / plumbing capex.
Questions for the listing agent
- It's been on market 37 days. Have you received any prior offers? Is the seller open to a 3% concession, seller financing, or rate buy-down credit?
- Built in 1954 — when were the roof, HVAC, electrical panel, plumbing, and water heater last replaced?
- Is there a deadline driving the sale (1031 exchange, divorce, estate, relocation)? That informs how much negotiation room exists.
- Schools are A-rated — typically a magnet for longer-tenancy family renters. What's the average tenant stay here, and is there a school-zone premium baked into asking?
- What's the average days-on-market for RENTAL listings here right now (not sales)? A rising rental-DOM trend means longer vacancies and softer asking-rent achievability than the comps imply.
- What's the recent tenant-quality profile in this submarket — average credit score on applications, eviction rate, late-payment / NSF rate, and stable-employment percentage? A property-management company in the area should have these aggregated.
- How much new for-sale + rental construction is in the pipeline within 1–3 miles? Heavy new supply typically softens prices + rents 12–24 months out; constrained supply supports both.
Investment metrics
- 1% rule
- 1.03% ✓
- Cap rate
- 7.42%
- Cash-on-cash
- 4.03%
- DSCR
- 1.18
- GRM
- 8.1
CMA / ARV
- ARV (median comp)
- $296,420
- List price
- $200,000
- Delta
- -32.53%
- Verdict
- UNDERPRICED
- Comps
- 20 within 1.0 mi
Show comp detail 4 sales within ~0.75 mi
| Address | Dist | Beds/Ba | Sqft | Sold | Price | $/sf | Match |
|---|---|---|---|---|---|---|---|
| 18 Plaske Dr | 0.11mi | 2/1.0 (-1) | 876 (-11%) | 13mo | $255,000 | $291 | 60 |
| 36 Plaske Dr | 0.21mi | 2/1.0 (-1) | 899 (-9%) | 13mo | $315,000 | $350 | 60 |
| 6 Concord Dr | 0.62mi | 3/1.0 | 1,044 (+6%) | 12mo | $355,000 | $340 | 52 |
| 61 Jones Dr | 0.42mi | 3/1.5 | 1,104 (+12%) | 17mo | $392,000 | $355 | 45 |
Match score weights: distance 35% · size 25% · config 20% · recency 20%. Top-matched comps best support the ARV.
Projected returns pro-forma
-3.0% appreciation · 0.0% rent growth · sell at horizon
- IRR
- -13.5%
- Equity multiple
- 0.53×
- Total profit
- $-26,398
- Equity at exit
- $29,821
- IRR
- -10.5%
- Equity multiple
- 0.45×
- Total profit
- $-30,600
- Equity at exit
- $17,292
Cash invested: $56,000 (down + closing). Projections, not guarantees.
Landlord ↔ Tenant lean methodology
- Overall (STATE)
- 15 Strongly Tenant-Friendly
- State New York
- 15 Strongly Tenant-Friendly · D+10
- County
- — inherits STATE
- City
- — inherits STATE
ZIP-level market 12309
- Rents YoY
- -1.6%
- Active inventory
- 166
- Price-to-rent
- 8.1×
Monthly cashflow live
- Estimated rent
- $2,056 medium interval (Pro) →
- Mortgage (P&I)
- −$1,049
- Tax from tax record
- −$304 /mo · $3,654/yr
- Insurance
- −$83
- HOA
- −$0
- Vacancy / Maint / Mgmt
- −$432
- Net cashflow
- $188
Break-even live
Sensitivity live
| Price | -10% $301 | -5% $245 | +0% $188 | +5% $131 | +10% $75 |
|---|---|---|---|---|---|
| Rent | -10% $26 | -5% $107 | +0% $188 | +5% $269 | +10% $350 |
| Rate | -1.0pp $289 | -0.5pp $239 | base $188 | +0.5pp $136 | +1.0pp $83 |
UW: 25.0% down · 7.5% · 30yr · 1.5% tax · 5.0% vac · 8.0% maint · 8.0% mgmt
Financing live
Cash to close
- Down payment
- $50,000
- Closing costs
- $6,000
- Reserves months
- —
- Total cash needed
- —
Loan-product check · same deal, 3 products live
Conventional
25% down · 7.5% · 30yr
- Down + closing
- —
- Monthly P&I
- —
- Monthly cashflow
- —
- DSCR
- —
- Eligible?
- —
Personal DTI + credit; lowest rate.
DSCR
20% down · 8.5% · 30yr
- Down + closing
- —
- Monthly P&I
- —
- Monthly cashflow
- —
- DSCR
- —
- Eligible?
- —
No personal income docs; deal must DSCR.
Hard money
10% down · 12.0% · 12mo
- Down + closing
- —
- Monthly P&I
- —
- Monthly cashflow
- —
- DSCR
- —
- Eligible?
- —
Short-term bridge; refi at stabilization.
Listing history 19 events
-
2026-06-22days on market $200,000 Active 37 DOM
-
2026-06-18days on market $200,000 Active 34 DOM
-
2026-06-17days on market $200,000 Active 33 DOM
-
2026-06-16pricedays on market $200,000 Active 32 DOM
-
2026-06-15days on market $205,000 Active 31 DOM
-
2026-06-14days on market $205,000 Active 29 DOM
-
2026-06-13days on market $205,000 Active 28 DOM
-
2026-06-10days on market $205,000 Active 26 DOM
-
2026-06-09days on market $205,000 Active 25 DOM
-
2026-06-08days on market $205,000 Active 24 DOM
-
2026-06-07days on market $205,000 Active 23 DOM
-
2026-06-05days on market $205,000 Active 20 DOM
-
2026-06-03days on market $205,000 Active 19 DOM
-
2026-06-03price $205,000 Active 18 DOM
-
2026-06-02days on market $210,000 Active 18 DOM
-
2026-06-01days on market $210,000 Active 17 DOM
-
2026-05-31days on market $210,000 Active 16 DOM
-
2026-05-31days on market $210,000 Active 15 DOM
-
2026-05-15$210,000 Active 631-char remark
ⓘ Source: listings_history table (triggers on properties + properties_extension) + one-shot
backfill from property_details.listing_events for pre-trigger history.
Tax reassessment forecast NY · Partial reset (capped growth)
- Current annual tax
- $3,654 · $304/mo
- Projected year-2 tax
- $3,654 · $304/mo
- Expected delta
- $0/yr ($0/mo · 0.0%)
ⓘ Screening estimate from a state-policy table — verify with the county assessor before closing.
Climate risk First Street
- Flood 1/10 Low FEMA zone X (unshaded) · 0% chance over 30 yrs
- Wildfire 3/10 Moderate
- Heat 3/10 Moderate 7 d/yr ≥96°F today · 16 d/yr by 30 yrs out
- Wind 3/10 Moderate 5% chance of damaging wind over 30 yrs
- Air quality 1/10 Low 0 unhealthy d/yr today · 0 by 30 yrs out
Nearby sold comps map
Loading sold comps map…
Walkable amenities ~0.75 mi
Loading nearby amenities…
Taxation est. · year 1
- Rental income
- $24,678
- − Mortgage interest
- −$11,203
- − Property taxes
- −$3,654
- − Insurance
- −$1,000
- − Repairs & maintenance
- −$1,974
- − Management
- −$1,974
- − Depreciation
- −$5,818
- Taxable loss
- −$946
- Est. tax savings @ 24.0%
- +$227
- After-tax cash flow
- $2,483/yr
For passive investors: Depreciation is non-cash, so a rental often shows a tax loss while cash-flowing — sheltering income. Rental losses are passive: they offset passive income freely, and up to $25,000/yr can offset ordinary (W-2) income if you actively participate and your MAGI is under $100k (phasing out to $0 by $150k); unused losses carry forward. On sale, claimed depreciation is recaptured at up to 25%, and gains may owe capital-gains tax (a 1031 exchange can defer both). Figures are a year-1 estimate at your 24.0% rate — not tax advice; consult a CPA.
Schools (NCES district)
- District
- South Colonie Central School District
- NCES district ID
- 3627210
- Math proficiency
- 63% ▼ -1.00%
- Reading proficiency
- 57% ▲ 4.00%
- Median HH income
- $69,499
- Composite
- 52.97/100
- National rank
- #1527
- State rank
- #215 of 590 in NY
Livability — Niskayuna
- Score
- 91/100
- State rank
- #3
- US rank
- #51
Category grades
Schools grade is shown separately in the Schools card above.
Census & demographics
- County
- Schenectady County · 141,369 people
- City population
- 32,996
- Metro
- Albany-Schenectady-Troy, NY
- Population (ZIP)
- 33,246
- Household income
- $125,274
- Rent vs Own
- Severe rent burden
- 300.0
Population outlook (Albany County) Hauer SSP2
- Today (2025)
- 320,794 people
- By 2030
- 327,401 · +2.1%
- By 2040
- 338,218 · +5.4%
- By 2050
- 348,467 · +8.6%
- By 2075
- 381,693 · +19.0%
- By 2100
- 393,809 · +22.8%
Race, ethnicity, and origin ACS 2023
- Neighborhood character
- Predominantly White (76%)
- Race & ethnicity
- White 76% Asian 9% Two or more races 8% Hispanic / Latino 5% Black 3%
- Hispanic origin (detail)
- Puerto Rican 3%
- Common ancestry
- Romanian 6% Lithuanian 4% Iranian 3%
- Foreign-born
- 11% · Canada, China, Vietnam
- Languages at home
- 89% English-only · Other Indo-European 3% Spanish 2% Other Asian/Pacific 2%
Political lean MEDSL · Albany
- 2024 margin
- Strong D (+25.8) · D 62.9% · R 37.1%
- 2008→2024 swing
- -3.6pp toward R · 2008: 29.4pp · 2024: 25.8pp
- All cycles
- 2024: D+25.8 2020: D+31.4 2016: D+24.3 2012: D+31.0 2008: D+29.4
Not yet ingested
- Civics
- —
Market trends
- HPI YoY
- ▼ -228.63%
- Current HPI
- 294.773
- Rent YoY
- ▼ -1.55%
- Metro
- Albany-Schenectady-Troy, NY
- State GDP YoY
- ▲ 2.60%
- F500 in state
- 92
Industry mix (Fortune 500 HQ in NY)
| Industry | F500 HQs | Revenue |
|---|---|---|
| Financial Services | 10 | $950B |
|
||
| Consumer Goods | 9 | $162B |
|
||
| Insurance | 4 | $225B |
|
||
| Telecommunications | 2 | $144B |
|
||
| Pharmaceuticals | 2 | $112B |
|
||
| Media / Entertainment | 2 | $69B |
|
||
Price history
-4.8% since first listed3 events — show timeline
- 2026-06-16 Price Changed $200,000 Global MLS
- 2026-06-02 Price Changed $205,000 Global MLS
- 2026-05-15 Listed $210,000 Global MLS
Property tax history
+22.4%/yrLatest (2025): $3,654 · +22.9% YoY. Source: county tax records.
Cash-flow waterfall
monthlySold comps — $/sqft
last 12 mo · ≤1 miLoading sold comps…