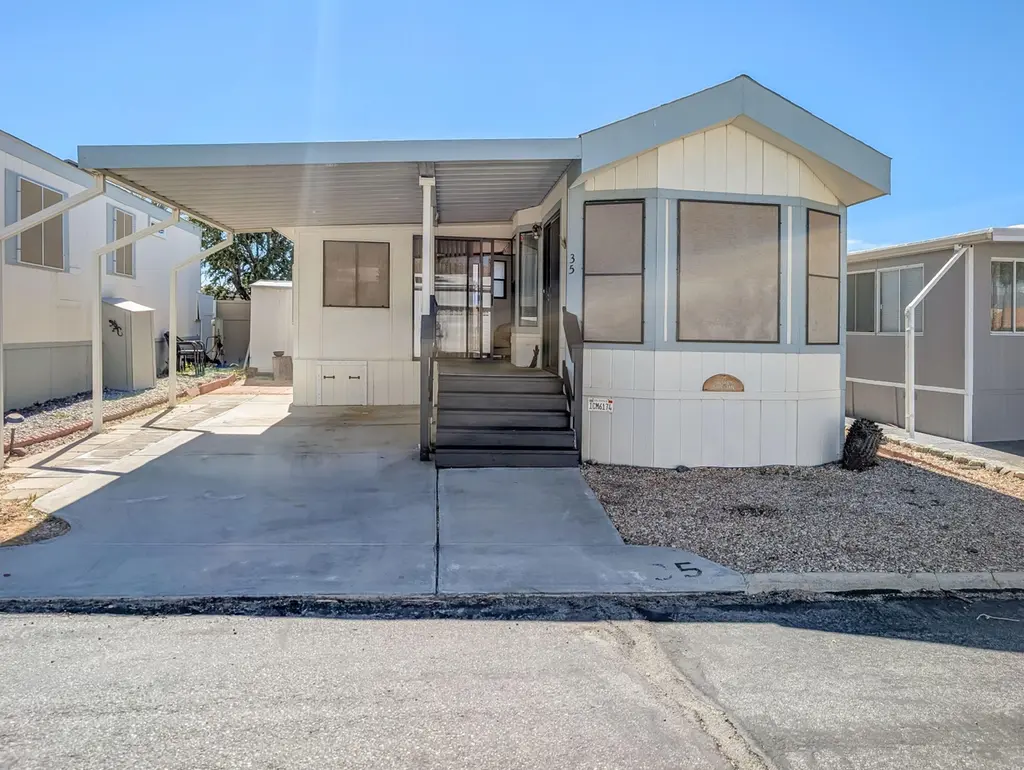
70200 Dillon Rd #35 · Desert Edge, CA
Flood risk 1/10 · Minimal
- FEMA flood zone
- A
- Chance of flooding over 30 yrs
- 0.0%
- Est. flood insurance / yr
- $1,009 – $1,996
Fire risk 5/10 · Moderate
- Est. fire insurance / yr
- $659 – $1,223
Heat risk 8/10 · Major
- Hot days now (above 109°F)
- 6 days/yr
- Hot days in 30 yrs
- 16 days/yr
Wind risk 1/10 · Minimal
- Chance of severe wind over 30 yrs
- —
Air-quality risk 5/10 · Moderate
- Unhealthy air days now
- 6 days/yr
- Unhealthy air days in 30 yrs
- 8 days/yr
Risk factors via First Street. Map © Google.
Why this score? — see what drove the B+ grade
The composite is a weighted blend of 9 inputs, each scored 0–100. Each bar is that input's sub-score; the figure is the points it added to the 100-point composite (weight × sub-score).
- Cash flow +30.0/30.0
- ARV discount +15.0/15.0
- 1% rule +10.0/10.0
- DSCR +10.0/10.0
- Condition / age +3.8/5.0
- Livability +3.4/5.0
- Schools +2.7/10.0
- Rent growth +2.5/5.0
- Appreciation +0.0/10.0
$44,900
🖨 Deal sheet (PDF) 📄 Offer letter ✓ Due diligence
Listing remarks MLS
This well-appointed and comfortable home is conveniently located steps from the Clubhouse and centrally positioned to take advantage of all amenities offered by this outstanding resort. The residence is approximately 550 sq. ft. , featuring one bedroom and one bathroom, with bright interiors and efficient use of space. Residents can appreciate crisp vistas of the surrounding desert landscape and scenic hills from both the front view and a private rear patio, ideal for relaxation and enjoying the natural environment. Situated within Caliente Springs, a welcoming 55+ resort community, homeowners have access to a range of amenities including mineral-fed hot spring pools and spas, a 9-hole golf course, pickleball and tennis courts, among others. Caliente Springs fosters a vibrant, active atmosphere, encouraging social engagement and community participation. Please note, the lot is not owned and space rent is $673 per month.
Key facts
- Private rear patio
- 9-hole golf course
- Garage
Tags
Neighborhood map
What this means for you Summary
Snapshot
- This is a 1-bed/1.0-bath manufactured listed at $45k. Condition is rated good.
Deal economics
- At list price, monthly cash flow is $1k ($12k/yr) — positive.
- The deal already cash-flows at list — no discount required.
- Meets the 1% rule at list price ($2k rent vs $45k).
- Recommended offer: $41k (9.0% below list) — sets the bar for market timing.
- Cap rate 36.7% vs local median 14.8% in Desert Edge — top-decile yield for the area; either an underpriced asset or a hidden risk that comps aren't pricing in. Stress-test before assuming the spread holds.
Location & tenants
- Location reads 68/100 on livability (#297 in CA) — a middle-class / working-renter tenant base. Strengths: cost of living A+, housing A+; Watch: crime C-, schools F, commute D-.
- Palm Springs Unified (suburban): math 21% / reading 42% proficiency, ranked #328 of 517 in CA (top 63%) — families likely to look elsewhere, expect single-tenant / working-renter base with shorter leases; 73% free/reduced lunch — lower-income household profile, screen leases tightly.
- Market conditions: 218 active listings in the ZIP; 2 comparable units currently listed for rent nearby; 9,195 units permitted in Riverside County in 2024 (1,512 in 5+ unit buildings).
Forward outlook
- Local home prices are declining (-3.0%/yr); year-one equity from $310 of loan paydown is wiped out by about $1k of value loss. Plan a longer hold.
- Riverside County population projected at +22% by 2050 — long-run rental-demand tailwind backs the buy-and-hold thesis.
- At projected returns (-3.0% appreciation + 3.0% rent growth), your $13k cash investment doubles in ~2 years — after that, you're playing with house money.
Negotiation context
- It's been on market 118 days — a 9% lower offer ($41k) is reasonable based on typical stale-listing flexibility.
Risks & watch-outs
- Watch-outs: flood insurance adds $125/mo.
- Climate carrying-cost: in FEMA flood zone A (mandatory federal flood insurance); moderate wildfire risk; extreme-heat days projected 6→16/yr by 2055 (HVAC capex compounding) — expect insurance premiums to compound above CPI over the hold.
Questions for the listing agent
- It's been on market 118 days. Have you received any prior offers? Is the seller open to a 9% concession, seller financing, or rate buy-down credit?
- What's the actual annual flood-insurance premium (NFIP or private), and is the property in a SFHA with mandatory coverage?
- Why hasn't it sold? Are there any deal-killer items the seller is aware of (foundation, flood, title, zoning, code violations)?
- Is there a deadline driving the sale (1031 exchange, divorce, estate, relocation)? That informs how much negotiation room exists.
- Schools are F-rated, which usually means shorter tenancies and higher turnover. Who's the typical renter profile here, and what's been the actual vacancy rate?
- What's the average days-on-market for RENTAL listings here right now (not sales)? A rising rental-DOM trend means longer vacancies and softer asking-rent achievability than the comps imply.
- What's the recent tenant-quality profile in this submarket — average credit score on applications, eviction rate, late-payment / NSF rate, and stable-employment percentage? A property-management company in the area should have these aggregated.
- How much new for-sale + rental construction is in the pipeline within 1–3 miles? Heavy new supply typically softens prices + rents 12–24 months out; constrained supply supports both.
Investment metrics
- 1% rule
- 4.08% ✓
- Cap rate
- 36.67%
- Cash-on-cash
- 108.51%
- DSCR
- 5.83
- GRM
- 2.0
CMA / ARV
- ARV (median comp)
- $55,900
- List price
- $44,900
- Delta
- -19.68%
- Verdict
- UNDERPRICED
- Comps
- 20 within 1.0 mi
Show comp detail 12 sales within ~0.75 mi
| Address | Dist | Beds/Ba | Sqft | Sold | Price | $/sf | Match |
|---|---|---|---|---|---|---|---|
| 70200 Dillon Rd #416 | 0.17mi | 1/1.0 | 550 (0%) | 8mo | $48,000 | $87 | 86 |
| 70200 Dillon Rd #654 | 0.17mi | 2/1.0 (+1) | 550 (0%) | 3mo | $97,500 | $177 | 84 |
| 70200 Dillon Rd #320 | 0.16mi | 1/1.0 | 550 (0%) | 10mo | $50,000 | $91 | 84 |
| 70200 Dillon Rd #324 | 0.11mi | 1/1.0 | 570 (+4%) | 12mo | $76,000 | $133 | 78 |
| 70200 Dillon Rd #215 | 0.11mi | 1/1.0 | 600 (+9%) | 4mo | $65,000 | $108 | 76 |
| 70200 Dillon Rd #605 | 0.11mi | 1/1.0 | 600 (+9%) | 5mo | $97,500 | $163 | 76 |
| 70200 Dillon Rd #446 | 0.00mi | 2/1.5 (+1) | 600 (+9%) | 4mo | $75,000 | $125 | 74 |
| 70200 Dillon Rd #36 | 0.11mi | 1/1.0 | 600 (+9%) | 8mo | $65,000 | $108 | 73 |
| 70200 Dillon Rd #97 | 0.17mi | 1/1.0 | 600 (+9%) | 5mo | $20,500 | $34 | 73 |
| 70200 Dillon Rd #527 | 0.16mi | 2/1.0 (+1) | 525 (-4%) | 13mo | $55,000 | $105 | 69 |
| 70200 Dillon Rd #590 | 0.17mi | 2/1.0 (+1) | 625 (+14%) | 4mo | $61,500 | $98 | 61 |
| 17850 Corkill Rd #31 | 0.61mi | 2/1.0 (+1) | 600 (+9%) | 5mo | $25,000 | $42 | 47 |
Match score weights: distance 35% · size 25% · config 20% · recency 20%. Top-matched comps best support the ARV.
Projected returns pro-forma
-3.0% appreciation · 3.0% rent growth · sell at horizon
- IRR
- 97.6%
- Equity multiple
- 5.55×
- Total profit
- $57,256
- Equity at exit
- $6,695
- IRR
- —
- Equity multiple
- 11.60×
- Total profit
- $133,243
- Equity at exit
- $3,882
Cash invested: $12,572 (down + closing). Projections, not guarantees.
Landlord ↔ Tenant lean methodology
- Overall (STATE)
- 18 Strongly Tenant-Friendly
- State California
- 18 Strongly Tenant-Friendly · D+13
- County
- — inherits STATE
- City
- — inherits STATE
ZIP-level market 92241
- Home prices YoY
- -22.8%
- Active inventory
- 218
- Price-to-rent
- 2.0×
Monthly cashflow live
- Estimated rent
- $1,832 medium interval (Pro) →
- Mortgage (P&I)
- −$235
- Tax est. 1.5%
- −$56 /mo · $674/yr
- Insurance
- −$19
- Flood insurance flood zone
- −$125 /mo · $1,502/yr
- HOA
- −$0
- Vacancy / Maint / Mgmt
- −$385
- Net cashflow
- $1,012
Break-even live
Sensitivity live
| Price | -10% $1,043 | -5% $1,027 | +0% $1,012 | +5% $996 | +10% $981 |
|---|---|---|---|---|---|
| Rent | -10% $867 | -5% $939 | +0% $1,012 | +5% $1,084 | +10% $1,156 |
| Rate | -1.0pp $1,034 | -0.5pp $1,023 | base $1,012 | +0.5pp $1,000 | +1.0pp $988 |
UW: 25.0% down · 7.5% · 30yr · 1.5% tax · 5.0% vac · 8.0% maint · 8.0% mgmt
Financing live
Cash to close
- Down payment
- $11,225
- Closing costs
- $1,347
- Reserves months
- —
- Total cash needed
- —
Loan-product check · same deal, 3 products live
Conventional
25% down · 7.5% · 30yr
- Down + closing
- —
- Monthly P&I
- —
- Monthly cashflow
- —
- DSCR
- —
- Eligible?
- —
Personal DTI + credit; lowest rate.
DSCR
20% down · 8.5% · 30yr
- Down + closing
- —
- Monthly P&I
- —
- Monthly cashflow
- —
- DSCR
- —
- Eligible?
- —
No personal income docs; deal must DSCR.
Hard money
10% down · 12.0% · 12mo
- Down + closing
- —
- Monthly P&I
- —
- Monthly cashflow
- —
- DSCR
- —
- Eligible?
- —
Short-term bridge; refi at stabilization.
Rent comps 2 comps
| Address | Beds | Baths | Sqft | Rent | $/sqft | DOM | Units | Dist |
|---|---|---|---|---|---|---|---|---|
| 70875 Dillon Rd Desert Hot Springs, CA | 2.0 | 2.0 | 720 | $2,200 | $3.06 | 45d | 1 | 0.80mi |
| 15935 Mary Cir Desert Hot Springs, CA | 1.0 | 1.0 | 550 | $1,350 | $2.45 | 19d | 1 | 1.37mi |
Listing history 16 events
-
2026-06-21days on market $44,900 Active 118 DOM
-
2026-06-18days on market $44,900 Active 115 DOM
-
2026-06-17days on market $44,900 Active 114 DOM
-
2026-06-16days on market $44,900 Active 113 DOM
-
2026-06-15days on market $44,900 Active 112 DOM
-
2026-06-13days on market $44,900 Active 110 DOM
-
2026-06-13days on market $44,900 Active 109 DOM
-
2026-06-09days on market $44,900 Active 106 DOM
-
2026-06-08days on market $44,900 Active 105 DOM
-
2026-06-07days on market $44,900 Active 104 DOM
-
2026-06-04days on market $44,900 Active 101 DOM
-
2026-06-03days on market $44,900 Active 100 DOM
-
2026-06-02days on market $44,900 Active 99 DOM
-
2026-06-01days on market $44,900 Active 98 DOM
-
2026-05-31days on market $44,900 Active 97 DOM
-
2026-02-22$44,900 Active 933-char remark
Show marketing remark (933 chars)
This well-appointed and comfortable home is conveniently located steps from the Clubhouse and centrally positioned to take advantage of all amenities offered by this outstanding resort. The residence is approximately 550 sq. ft. , featuring one bedroom and one bathroom, with bright interiors and efficient use of space. Residents can appreciate crisp vistas of the surrounding desert landscape and scenic hills from both the front view and a private rear patio, ideal for relaxation and enjoying the natural environment. Situated within Caliente Springs, a welcoming 55+ resort community, homeowners have access to a range of amenities including mineral-fed hot spring pools and spas, a 9-hole golf course, pickleball and tennis courts, among others. Caliente Springs fosters a vibrant, active atmosphere, encouraging social engagement and community participation. Please note, the lot is not owned and space rent is $673 per month.
ⓘ Source: listings_history table (triggers on properties + properties_extension) + one-shot
backfill from property_details.listing_events for pre-trigger history.
Climate risk First Street
- Flood 1/10 Low FEMA zone A · 0% chance over 30 yrs
- Wildfire 5/10 Major
- Heat 8/10 Severe 6 d/yr ≥109°F today · 16 d/yr by 30 yrs out
- Wind 1/10 Low
- Air quality 5/10 Major 6 unhealthy d/yr today · 8 by 30 yrs out
Nearby sold comps map
Loading sold comps map…
Walkable amenities ~0.75 mi
Loading nearby amenities…
Taxation est. · year 1
- Rental income
- $21,981
- − Mortgage interest
- −$2,515
- − Property taxes
- −$674
- − Insurance
- −$1,727
- − Repairs & maintenance
- −$1,758
- − Management
- −$1,758
- − Depreciation
- −$1,306
- Taxable income
- $12,242
- Est. tax owed @ 24.0%
- −$2,938
- After-tax cash flow
- $9,201/yr
For passive investors: Depreciation is non-cash, so a rental often shows a tax loss while cash-flowing — sheltering income. Rental losses are passive: they offset passive income freely, and up to $25,000/yr can offset ordinary (W-2) income if you actively participate and your MAGI is under $100k (phasing out to $0 by $150k); unused losses carry forward. On sale, claimed depreciation is recaptured at up to 25%, and gains may owe capital-gains tax (a 1031 exchange can defer both). Figures are a year-1 estimate at your 24.0% rate — not tax advice; consult a CPA.
Condition & rehab AI · 12 photos
This well-maintained mobile home is in good condition with minimal repairs needed. It offers a good investment opportunity with potential for value appreciation through cosmetic updates and improvements.
Value-add opportunities
- Both Painting the exterior and interior walls — Fresh paint can enhance the curb appeal and interior aesthetics.
- Both Updating the flooring — New flooring can improve the overall look and feel of the home.
- Both Upgrading the kitchen appliances — Modern appliances can increase the home's appeal and functionality.
- Both Renovating the bathrooms — Fresh bathrooms can significantly enhance the home's value and functionality.
- Both Landscaping improvements — A well-maintained landscape can improve curb appeal and add value to the property.
Renovation cost estimate screening
Value-add ROI direction
- Both Painting the exterior and interior walls — Fresh paint can enhance the curb appeal and interior aesthetics. ↑
- Both Updating the flooring — New flooring can improve the overall look and feel of the home. ↑
- Both Upgrading the kitchen appliances — Modern appliances can increase the home's appeal and functionality. ↑
- Both Renovating the bathrooms — Fresh bathrooms can significantly enhance the home's value and functionality. ↑
- Both Landscaping improvements — A well-maintained landscape can improve curb appeal and add value to the property. ↑
ⓘ Cost ranges are severity-bucket heuristics (US national rule-of-thumb). Get contractor quotes + a written scope before underwriting a rehab budget.
Schools (NCES district)
- District
- Palm Springs Unified
- NCES district ID
- 0629550
- Math proficiency
- 21% ▼ -7.00%
- Reading proficiency
- 42% ▬ 0.00%
- Median HH income
- $43,638
- Composite
- 26.76/100
- National rank
- #7131
- State rank
- #328 of 517 in CA
Livability — Desert Edge
- Score
- 68/100
- State rank
- #297
- US rank
- #9953
Category grades
Schools grade is shown separately in the Schools card above.
Census & demographics
- Census place
- Desert Edge, CA
- Population (ZIP)
- 8,624
Population outlook (Riverside County) Hauer SSP2
- Today (2025)
- 2,664,475 people
- By 2030
- 2,802,692 · +5.2%
- By 2040
- 3,050,904 · +14.5%
- By 2050
- 3,256,783 · +22.2%
- By 2075
- 3,655,058 · +37.2%
- By 2100
- 3,766,594 · +41.4%
Race, ethnicity, and origin ACS 2023
- Race & ethnicity
- White 50% Hispanic / Latino 46% Two or more races 16% Asian 2% Native American 1%
- Hispanic origin (detail)
- Mexican 36%
- Common ancestry
- Lithuanian 3% Slovak 2% Portuguese 2%
- Foreign-born
- 28% · Canada, South Korea
- Languages at home
- 57% English-only · Spanish 38% Chinese 1% Russian/Polish/Slavic 1%
Political lean MEDSL · Riverside
- 2024 margin
- Toss-up / Even · D 48.0% · R 49.3% · Other 2.6%
- 2008→2024 swing
- -3.6pp toward R · 2008: 2.3pp · 2024: -1.3pp
- All cycles
- 2024: R+1.3 2020: D+8.0 2016: D+4.3 2012: R+0.4 2008: D+2.3
Not yet ingested
- Civics
- —
Market trends
- HPI YoY
- ▼ -118.23%
- Current HPI
- 400.5663
- Rent YoY
- —
- Metro
- —
- State GDP YoY
- ▲ 3.21%
- F500 in state
- 116
Industry mix (Fortune 500 HQ in CA)
| Industry | F500 HQs | Revenue |
|---|---|---|
| Technology | 27 | $1,492B |
|
||
| Financial Services | 3 | $174B |
|
||
| Retail | 3 | $44B |
|
||
| Insurance | 3 | $26B |
|
||
| Media / Entertainment | 2 | $115B |
|
||
| Pharmaceuticals / Biotech | 2 | $62B |
|
||
Price history
1 event — show timeline
- 2026-02-22 Listed $44,900 GPSMLS
Cash-flow waterfall
monthlySold comps — $/sqft
last 12 mo · ≤1 miLoading sold comps…