5826 Waddell St · Sansom Park, TX
Flood risk 1/10 · Minimal
- FEMA flood zone
- X (unshaded)
- Chance of flooding over 30 yrs
- 0.0%
- Est. flood insurance / yr
- $507 – $1,088
Fire risk 4/10 · Minor
- Est. fire insurance / yr
- $1,222 – $2,270
Heat risk 7/10 · Major
- Hot days now (above 109°F)
- 7 days/yr
- Hot days in 30 yrs
- 23 days/yr
Wind risk 4/10 · Minor
- Chance of severe wind over 30 yrs
- 24.0%
Air-quality risk 3/10 · Minor
- Unhealthy air days now
- 3 days/yr
- Unhealthy air days in 30 yrs
- 4 days/yr
Risk factors via First Street. Map © Google.
Why this score? — see what drove the B- grade
The composite is a weighted blend of 9 inputs, each scored 0–100. Each bar is that input's sub-score; the figure is the points it added to the 100-point composite (weight × sub-score).
- Cash flow +30.0/30.0
- DSCR +10.0/10.0
- 1% rule +8.0/10.0
- ARV discount +7.5/15.0
- Livability +3.5/5.0
- Rent growth +3.0/5.0
- Condition / age +2.5/5.0
- Schools +1.4/10.0
- Appreciation +0.0/10.0
$140,000
🖨 Deal sheet (PDF) 📄 Offer letter ✓ Due diligence
Listing remarks MLS
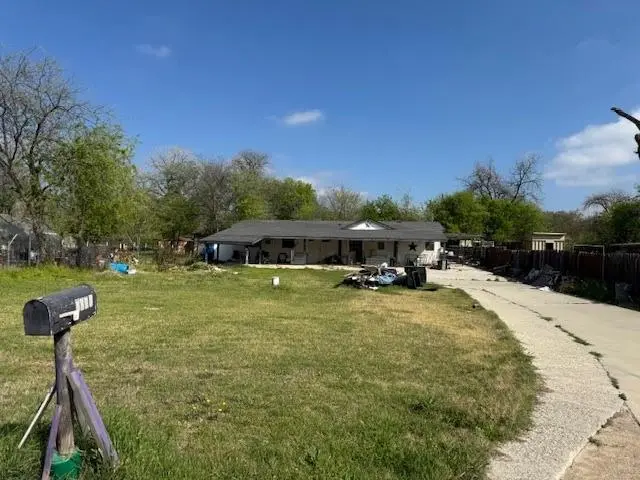
Looking for space, versatility, and a great investment opportunity? This mobile home sits toward the back of a generous lot, leaving plenty of room up front to build, expand, or enjoy a wide open yard. The home has been thoughtfully converted into a duplex, with each side offering its own primary bedroom, full bath, kitchen, and living area. It’s a perfect setup to live on one side while renting out the other, hosting extended family, or creating two independent living spaces. Come take a look at this unique property and imagine the possibilities.
Key facts
- Generous lot
- Kitchen
- Living area
Tags
Neighborhood map
What this means for you Summary
Snapshot
- This is a 3-bed/2.0-bath manufactured listed at $140k.
Deal economics
- At list price, monthly cash flow is $559 ($7k/yr) — positive.
- The deal already cash-flows at list — no discount required.
- Meets the 1% rule at list price ($2k rent vs $140k).
- Recommended offer: $132k (6.0% below list) — sets the bar for market timing.
Location & tenants
- Location reads 69/100 on livability (#403 in TX) — a middle-class / working-renter tenant base. Strengths: cost of living A+, housing A+, health & safety A+; Watch: employment C-, crime D, amenities F.
- Lake Worth ISD (suburban): math 12% / reading 22% proficiency, ranked #801 of 826 in TX (top 97%) — low school quality limits family demand, transient renter base, plan for 1-2y turnover; 73% free/reduced lunch — lower-income household profile, screen leases tightly.
- Zoned schools: Marilyn Miller Language Academy (math 12% / reading 19%, grade F, #3,990 of 4,322 statewide, top 93%, 507 students, 95% FRL); Lucyle Collins Middle (math 13% / reading 21%, grade F, #1,520 of 1,662 statewide, top 92%, 793 students, 92% FRL); Lake Worth H S (math 13% / reading 31%, grade F, #1,366 of 1,632 statewide, top 84%, 996 students, 85% FRL) — zoned schools average 91% FRL vs 73% district-wide (18 pts higher); higher-poverty schools than district average — tighter screening recommended.
- Market conditions: Rents rising (+1.9%/yr); 152 active listings in the ZIP; 31 comparable units currently listed for rent nearby; rentals at typical pace (median 24d on market — plan ~3-4 weeks tenant-placement turnaround); 18,938 units permitted in Tarrant County in 2024 (8,336 in 5+ unit buildings).
- This rent runs 35% of the median local income ($62k/yr) — at the standard rent-burdened threshold; future hikes will face affordability resistance.
Forward outlook
- Local home prices are declining (-3.0%/yr); year-one equity from $968 of loan paydown is wiped out by about $4k of value loss. Plan a longer hold.
- Tarrant County population projected at +41% by 2050 — long-run rental-demand tailwind backs the buy-and-hold thesis.
- At projected returns (-3.0% appreciation + 1.9% rent growth), your $39k cash investment doubles in ~8 years — after that, you're playing with house money.
Negotiation context
- It's been on market 84 days — a 6% lower offer ($132k) is reasonable based on typical stale-listing flexibility.
- 4 sale attempts since 14y ago; this cycle's ask has dropped $10k (7%) from the opening price — seller is motivated, your offer sets the floor, not the list.
Risks & watch-outs
- Climate carrying-cost: extreme-heat days projected 7→23/yr by 2055 (HVAC capex compounding) — expect insurance premiums to compound above CPI over the hold.
Questions for the listing agent
- It's been on market 84 days. Have you received any prior offers? Is the seller open to a 6% concession, seller financing, or rate buy-down credit?
- Why hasn't it sold? Are there any deal-killer items the seller is aware of (foundation, flood, title, zoning, code violations)?
- Is there a deadline driving the sale (1031 exchange, divorce, estate, relocation)? That informs how much negotiation room exists.
- Schools are F-rated, which usually means shorter tenancies and higher turnover. Who's the typical renter profile here, and what's been the actual vacancy rate?
- Crime grade is D in this area — have there been break-ins, vandalism, or insurance claims at this property in the last 3 years? What carrier currently insures it and at what premium?
- What's the average days-on-market for RENTAL listings here right now (not sales)? A rising rental-DOM trend means longer vacancies and softer asking-rent achievability than the comps imply.
- What's the recent tenant-quality profile in this submarket — average credit score on applications, eviction rate, late-payment / NSF rate, and stable-employment percentage? A property-management company in the area should have these aggregated.
- How much new for-sale + rental construction is in the pipeline within 1–3 miles? Heavy new supply typically softens prices + rents 12–24 months out; constrained supply supports both.
Investment metrics
- 1% rule
- 1.30% ✓
- Cap rate
- 11.08%
- Cash-on-cash
- 17.11%
- DSCR
- 1.76
- GRM
- 6.4
CMA / ARV
No comps found within radius.
Projected returns pro-forma
-3.0% appreciation · 1.88% rent growth · sell at horizon
- IRR
- 7.2%
- Equity multiple
- 1.28×
- Total profit
- $10,848
- Equity at exit
- $20,874
- IRR
- 15.5%
- Equity multiple
- 2.20×
- Total profit
- $47,031
- Equity at exit
- $12,105
Cash invested: $39,200 (down + closing). Projections, not guarantees.
Landlord ↔ Tenant lean methodology
- Overall (STATE)
- 87 Strongly Landlord-Friendly
- State Texas
- 87 Strongly Landlord-Friendly · R+5
- County
- — inherits STATE
- City
- — inherits STATE
ZIP-level market 76114
- Home prices YoY
- -24.3%
- Rents YoY
- 1.9%
- Active inventory
- 152
- Price-to-rent
- 6.4×
Monthly cashflow live
- Estimated rent
- $1,817 high interval (Pro) →
- Mortgage (P&I)
- −$734
- Tax from tax record
- −$84 /mo · $1,014/yr
- Insurance
- −$58
- HOA
- −$0
- Vacancy / Maint / Mgmt
- −$382
- Net cashflow
- $559
Break-even live
Sensitivity live
| Price | -10% $638 | -5% $598 | +0% $559 | +5% $519 | +10% $480 |
|---|---|---|---|---|---|
| Rent | -10% $415 | -5% $487 | +0% $559 | +5% $631 | +10% $702 |
| Rate | -1.0pp $629 | -0.5pp $594 | base $559 | +0.5pp $522 | +1.0pp $486 |
UW: 25.0% down · 7.5% · 30yr · 1.5% tax · 5.0% vac · 8.0% maint · 8.0% mgmt
Financing live
Cash to close
- Down payment
- $35,000
- Closing costs
- $4,200
- Reserves months
- —
- Total cash needed
- —
Loan-product check · same deal, 3 products live
Conventional
25% down · 7.5% · 30yr
- Down + closing
- —
- Monthly P&I
- —
- Monthly cashflow
- —
- DSCR
- —
- Eligible?
- —
Personal DTI + credit; lowest rate.
DSCR
20% down · 8.5% · 30yr
- Down + closing
- —
- Monthly P&I
- —
- Monthly cashflow
- —
- DSCR
- —
- Eligible?
- —
No personal income docs; deal must DSCR.
Hard money
10% down · 12.0% · 12mo
- Down + closing
- —
- Monthly P&I
- —
- Monthly cashflow
- —
- DSCR
- —
- Eligible?
- —
Short-term bridge; refi at stabilization.
Rent comps 31 comps
| Address | Beds | Baths | Sqft | Rent | $/sqft | DOM | Units | Dist |
|---|---|---|---|---|---|---|---|---|
| 5712 Azle Ave Unit 5745 Fort Worth, TX | 3.0 | 2.0 | 1246 | $1,453 | $1.17 | 45d | 1 | 0.55mi |
| 5712 Azle Ave Unit 3121 Fort Worth, TX | 3.0 | 2.0 | 1246 | $1,402 | $1.13 | 0d | 1 | 0.55mi |
| 5600 Azle Ave Fort Worth, TX | 1.0–2.0 | 1.0–2.0 | 935 | $1,410 | $1.51 | 0d | 7 | 0.56mi |
| 6303 Shady Oaks Manor Dr Fort Worth, TX | 3.0 | 1.0–2.0 | 861 | $1,520 | $1.76 | 0d | 40 | 0.66mi |
| 3000 Comanche Ave Unit B Fort Worth, TX | 3.0 | 2.0 | 1200 | $1,450 | $1.21 | 45d | 1 | 0.70mi |
| 5109 Crowley St Fort Worth, TX | 3.0 | 2.0 | 1509 | $1,995 | $1.32 | 23d | 1 | 0.77mi |
| 3917 Mantis St Fort Worth, TX | 4.0 | 2.0 | 1821 | $2,200 | $1.21 | 45d | 1 | 0.82mi |
| 5500 Korth St Fort Worth, TX | 3.0 | 2.0 | 1750 | $1,875 | $1.07 | 45d | 1 | 0.91mi |
| 6201 Azle Ave Fort Worth, TX | 1.0–3.0 | 1.0–2.0 | 1039 | $2,177 | $2.09 | 0d | 22 | 0.97mi |
| 3665 Marine Creek Pkwy Fort Worth, TX | 1.0–2.0 | 1.0–2.0 | 896 | $1,770 | $1.98 | 0d | 40 | 1.02mi |
| 3636 Marine Creek Pkwy Fort Worth, TX | 3.0–4.0 | 2.5 | 1628 | $2,049 | $1.26 | 0d | 1 | 1.07mi |
| 5825 Shadydell Dr #5829 Fort Worth, TX | 2.0 | 1.5 | 1088 | $1,400 | $1.29 | 26d | 1 | 1.20mi |
| 5829 Shadydell Dr Fort Worth, TX | 2.0 | 1.5 | 1088 | $1,400 | $1.29 | 26d | 1 | 1.20mi |
| 5837 Shadydell Dr Fort Worth, TX | 2.0 | 1.5 | 1155 | $1,500 | $1.30 | 23d | 1 | 1.21mi |
| 5911 Shadydell Dr Fort Worth, TX | 2.0 | 1.5 | 1088 | $1,350 | $1.24 | 26d | 1 | 1.23mi |
| 5935 Shadydell Dr Fort Worth, TX | 2.0 | 1.5 | 1088 | $1,300 | $1.19 | 26d | 1 | 1.25mi |
| 5947 Shadydell Dr Fort Worth, TX | 2.0 | 1.5 | 1088 | $1,350 | $1.24 | 0d | 1 | 1.26mi |
| 5947 Shadydell Dr Fort Worth, TX | 2.0 | 1.5 | 1088 | $1,350 | $1.24 | 22d | 1 | 1.26mi |
| 3465 Vista Highlands Ln Fort Worth, TX | 3.0 | 2.5 | 1708 | $2,200 | $1.29 | 45d | 1 | 1.28mi |
| 6655 Calgary Ln Fort Worth, TX | 1.0–3.0 | 1.0–2.0 | 949 | $1,359 | $1.43 | 45d | 1 | 1.29mi |
| 4109 Ridgecrest Cir Lake Worth, TX | 3.0 | 2.0 | 1640 | $1,850 | $1.13 | 22d | 1 | 1.35mi |
| 4808 Terrace Trl Fort Worth, TX | 3.0 | 2.0 | 1875 | $2,000 | $1.07 | 0d | 1 | 1.36mi |
| 6721 Lake Overlook Dr Fort Worth, TX | 3.0 | 2.0 | 1602 | $2,400 | $1.50 | 45d | 1 | 1.36mi |
| 5222 Shadydell Dr Unit 13204 Fort Worth, TX | 2.0 | 2.0 | 1073 | $1,899 | $1.77 | 8d | 1 | 1.39mi |
| 5222 Shadydell Dr Unit 13205 Fort Worth, TX | 2.0 | 2.0 | 1401 | $2,350 | $1.68 | 14d | 1 | 1.39mi |
| 5222 Shadydell Dr Unit 7205 Fort Worth, TX | 2.0 | 2.0 | 1401 | $2,275 | $1.62 | 6d | 1 | 1.39mi |
| 5222 Shadydell Dr Unit 10308 Fort Worth, TX | 2.0 | 2.0 | 1324 | $1,985 | $1.50 | 14d | 1 | 1.39mi |
| 5222 Shadydell Dr Unit 8201 Fort Worth, TX | 2.0 | 2.0 | 1073 | $1,999 | $1.86 | 25d | 1 | 1.39mi |
| 4729 Oarlock Dr Fort Worth, TX | 3.0 | 2.0 | 1384 | $1,700 | $1.23 | 14d | 1 | 1.43mi |
| 5000 Montrose Dr Fort Worth, TX | 3.0 | 2.0 | 1230 | $1,875 | $1.52 | 45d | 1 | 1.44mi |
| 1805 Brook Hollow Dr Fort Worth, TX | 3.0 | 1.0 | 1782 | $1,850 | $1.04 | 45d | 1 | 1.46mi |
Listing history 30 events
-
2026-06-21days on market $140,000 Active 84 DOM
-
2026-06-18days on market $140,000 Active 81 DOM
-
2026-06-17days on market $140,000 Active 80 DOM
-
2026-06-16days on market $140,000 Active 79 DOM
-
2026-06-15days on market $140,000 Active 78 DOM
-
2026-06-13days on market $140,000 Active 76 DOM
-
2026-06-13days on market $140,000 Active 75 DOM
-
2026-06-09days on market $140,000 Active 72 DOM
-
2026-06-08days on market $140,000 Active 71 DOM
-
2026-06-07days on market $140,000 Active 70 DOM
-
2026-06-04days on market $140,000 Active 67 DOM
-
2026-06-03days on market $140,000 Active 66 DOM
-
2026-06-02days on market $140,000 Active 65 DOM
-
2026-06-01days on market $140,000 Active 64 DOM
-
2026-05-31days on market $140,000 Active 63 DOM
-
2026-05-12status Active 565-char remark
Show marketing remark (565 chars)
Looking for space, versatility, and a great investment opportunity? This mobile home sits toward the back of a generous lot, leaving plenty of room up front to build, expand, or enjoy a wide open yard. The home has been thoughtfully converted into a duplex, with each side offering its own primary bedroom, full bath, kitchen, and living area. It’s a perfect setup to live on one side while renting out the other, hosting extended family, or creating two independent living spaces. Come take a look at this unique property and imagine the possibilities.
-
2026-05-07status Pending 565-char remark
Show marketing remark (565 chars)
Looking for space, versatility, and a great investment opportunity? This mobile home sits toward the back of a generous lot, leaving plenty of room up front to build, expand, or enjoy a wide open yard. The home has been thoughtfully converted into a duplex, with each side offering its own primary bedroom, full bath, kitchen, and living area. It’s a perfect setup to live on one side while renting out the other, hosting extended family, or creating two independent living spaces. Come take a look at this unique property and imagine the possibilities.
-
2026-04-02price $140,000 565-char remark
Show marketing remark (565 chars)
Looking for space, versatility, and a great investment opportunity? This mobile home sits toward the back of a generous lot, leaving plenty of room up front to build, expand, or enjoy a wide open yard. The home has been thoughtfully converted into a duplex, with each side offering its own primary bedroom, full bath, kitchen, and living area. It’s a perfect setup to live on one side while renting out the other, hosting extended family, or creating two independent living spaces. Come take a look at this unique property and imagine the possibilities.
-
2026-03-24$150,000 Active 565-char remark
Show marketing remark (565 chars)
Looking for space, versatility, and a great investment opportunity? This mobile home sits toward the back of a generous lot, leaving plenty of room up front to build, expand, or enjoy a wide open yard. The home has been thoughtfully converted into a duplex, with each side offering its own primary bedroom, full bath, kitchen, and living area. It’s a perfect setup to live on one side while renting out the other, hosting extended family, or creating two independent living spaces. Come take a look at this unique property and imagine the possibilities.
-
2014-05-07soldstatus
-
2012-10-22historical
-
2012-09-28price $31,900
-
2012-08-30price $34,900
-
2012-08-09price $37,900
-
2012-08-04status Active
-
2012-07-30historical
-
2012-07-05$39,000 Active
-
2002-08-24soldstatus
-
1996-07-02soldstatus
-
1983-08-08soldstatus
ⓘ Source: listings_history table (triggers on properties + properties_extension) + one-shot
backfill from property_details.listing_events for pre-trigger history.
Tax reassessment forecast TX · Resets to sale price
- Current annual tax
- $1,014 · $84/mo
- Projected year-2 tax
- $2,562 · $214/mo
- Expected delta
- +$1,548/yr (+$129/mo · 152.7%)
ⓘ Screening estimate from a state-policy table — verify with the county assessor before closing.
Climate risk First Street
- Flood 1/10 Low FEMA zone X (unshaded) · 0% chance over 30 yrs
- Wildfire 4/10 Moderate
- Heat 7/10 Severe 7 d/yr ≥109°F today · 23 d/yr by 30 yrs out
- Wind 4/10 Moderate 24% chance of damaging wind over 30 yrs
- Air quality 3/10 Moderate 3 unhealthy d/yr today · 4 by 30 yrs out
Nearby sold comps map
Loading sold comps map…
Walkable amenities ~0.75 mi
Loading nearby amenities…
Taxation est. · year 1
- Rental income
- $21,809
- − Mortgage interest
- −$7,842
- − Property taxes
- −$1,014
- − Insurance
- −$700
- − Repairs & maintenance
- −$1,745
- − Management
- −$1,745
- − Depreciation
- −$4,073
- Taxable income
- $4,691
- Est. tax owed @ 24.0%
- −$1,126
- After-tax cash flow
- $5,579/yr
For passive investors: Depreciation is non-cash, so a rental often shows a tax loss while cash-flowing — sheltering income. Rental losses are passive: they offset passive income freely, and up to $25,000/yr can offset ordinary (W-2) income if you actively participate and your MAGI is under $100k (phasing out to $0 by $150k); unused losses carry forward. On sale, claimed depreciation is recaptured at up to 25%, and gains may owe capital-gains tax (a 1031 exchange can defer both). Figures are a year-1 estimate at your 24.0% rate — not tax advice; consult a CPA.
Schools (NCES district)
- District
- Lake Worth ISD
- NCES district ID
- 4826490
- Math proficiency
- 12% ▼ -13.00%
- Reading proficiency
- 22% ▼ -5.00%
- Median HH income
- $39,451
- Composite
- 14.38/100
- National rank
- #9436
- State rank
- #801 of 826 in TX
Livability — Sansom Park
- Score
- 69/100
- State rank
- #403
- US rank
- #8368
Category grades
Schools grade is shown separately in the Schools card above.
Census & demographics
- Census place
- Sansom Park, TX
- County
- Tarrant County · 2,033,669 people
- Metro
- Dallas-Fort Worth-Arlington, TX
- Population (ZIP)
- 27,357
- Household income
- $62,073
- Rent vs Own
- Severe rent burden
- 1095.0
Population outlook (Tarrant County) Hauer SSP2
- Today (2025)
- 2,380,417 people
- By 2030
- 2,578,900 · +8.3%
- By 2040
- 2,974,995 · +25.0%
- By 2050
- 3,350,489 · +40.8%
- By 2075
- 4,216,909 · +77.2%
- By 2100
- 4,741,527 · +99.2%
Race, ethnicity, and origin ACS 2023
- Neighborhood character
- Majority Hispanic (61%)
- Race & ethnicity
- Hispanic / Latino 61% White 35% Two or more races 20% Native American 3% Black 2%
- Hispanic origin (detail)
- Mexican 56%
- Common ancestry
- Slovak 2% Italian 1% Serbian 1%
- Foreign-born
- 17% · Canada
- Languages at home
- 54% English-only · Spanish 45%
Political lean MEDSL · Tarrant
- 2024 margin
- Lean R (+5.1) · D 46.7% · R 51.9% · Other 1.4%
- 2008→2024 swing
- +6.6pp toward D · 2008: -11.7pp · 2024: -5.1pp
- All cycles
- 2024: R+5.1 2020: D+0.2 2016: R+8.7 2012: R+15.7 2008: R+11.7
Not yet ingested
- Civics
- —
Market trends
- HPI YoY
- ▼ -117.88%
- Current HPI
- 366.5263
- Rent YoY
- ▲ 1.88%
- Metro
- Dallas-Fort Worth-Arlington, TX
- State GDP YoY
- ▲ 3.95%
- F500 in state
- 110
Industry mix (Fortune 500 HQ in TX)
| Industry | F500 HQs | Revenue |
|---|---|---|
| Energy | 16 | $1,198B |
|
||
| Technology | 5 | $198B |
|
||
| Engineering / Construction | 4 | $72B |
|
||
| Energy Services | 3 | $60B |
|
||
| Utilities | 3 | $41B |
|
||
| Healthcare | 2 | $330B |
|
||
Price history
+259.0% since first listed15 events — show timeline
- 2026-05-12 Relisted — NTREIS
- 2026-05-07 Pending — NTREIS
- 2026-04-02 Price Changed $140,000 NTREIS
- 2026-03-24 Listed $150,000 NTREIS
- 2014-05-07 Sold (Public Records) — Public Records
- 2012-10-22 Listing Removed — NTREIS
- 2012-09-28 Price Changed $31,900 NTREIS
- 2012-08-30 Price Changed $34,900 NTREIS
- 2012-08-09 Price Changed $37,900 NTREIS
- 2012-08-04 Relisted — NTREIS
- 2012-07-30 Listing Removed — NTREIS
- 2012-07-05 Listed $39,000 NTREIS
- 2002-08-24 Sold (Public Records) — Public Records
- 1996-07-02 Sold (Public Records) — Public Records
- 1983-08-08 Sold (Public Records) — Public Records
Property tax history
-2.9%/yrLatest (2025): $1,014 · +10.8% YoY. Source: county tax records.
Cash-flow waterfall
monthlySold comps — $/sqft
last 12 mo · ≤1 miLoading sold comps…